Automated Monthly Reporting System Excel •

Jamie Tran

Automated Monthly Reporting System
Excel • Power Query • PivotTables • Reporting Automation
Overview
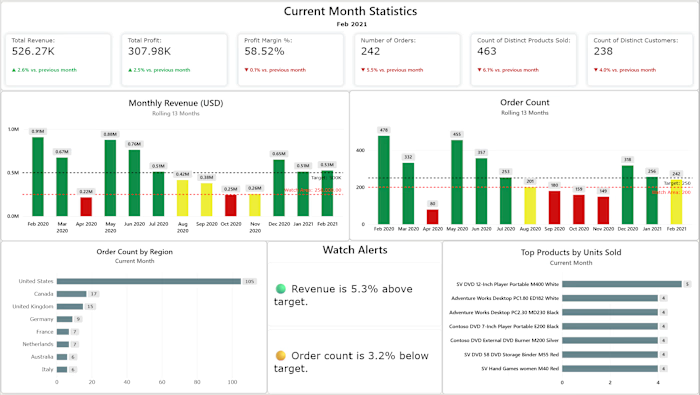
Built an automated Excel reporting system that transforms recurring monthly sales files into a polished, management-ready performance report.
What I Built
Power Query consolidates and prepares incoming sales data, while PivotTables and dynamic Excel formulas automatically populate the reporting layer with current and previous-period performance.
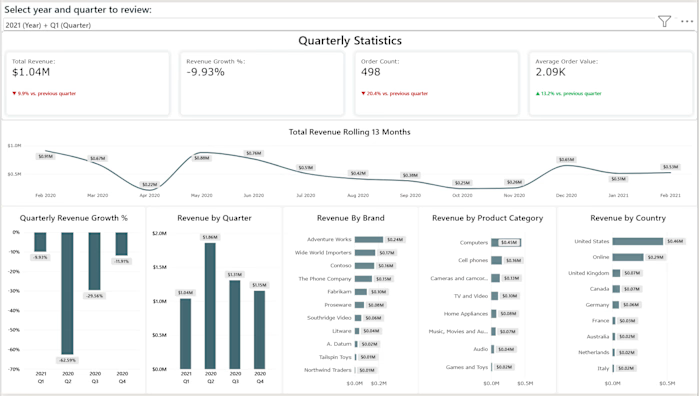
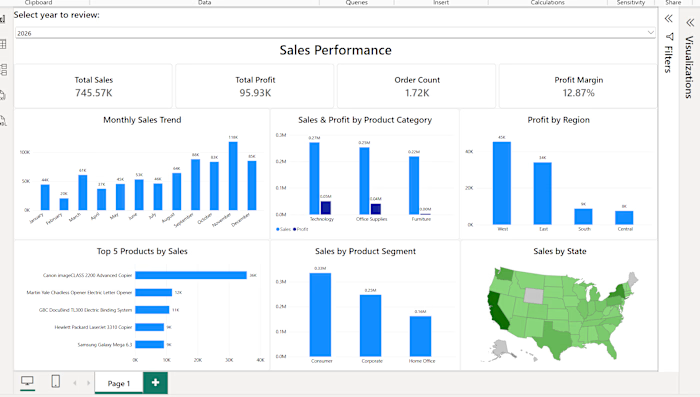
The final report provides management with KPIs, month-over-month trends, category and store performance, Top 10 analysis, and visual indicators highlighting changes that may require attention.
Key Features
Automated monthly data consolidation • Dynamic current and previous-month reporting • KPI tracking • Category and store analysis • Top 10 reporting • Conditional formatting and performance indicators
Tools: Excel • Power Query • PivotTables • Advanced Excel Formulas
Want to see how it was built?
View the full project and technical details on GitHub → https://github.com/jamietran8818/business-data-analytics-portfolio/blob/main/automated-excel-reporting-system/README.md
Like this project
Posted Oct 1, 2026
Automated Monthly Reporting System Excel • Power Query • PivotTables • Reporting Automation Overview Built an automated Excel reporting system that transform...
Likes
0
Views
4