Nexus AI — SaaS Dashboard (Concept)

Shakil Hosen


Nexus AI – SaaS Analytics Dashboard
© February 2026
Nexus AI – SaaS Analytics Dashboard
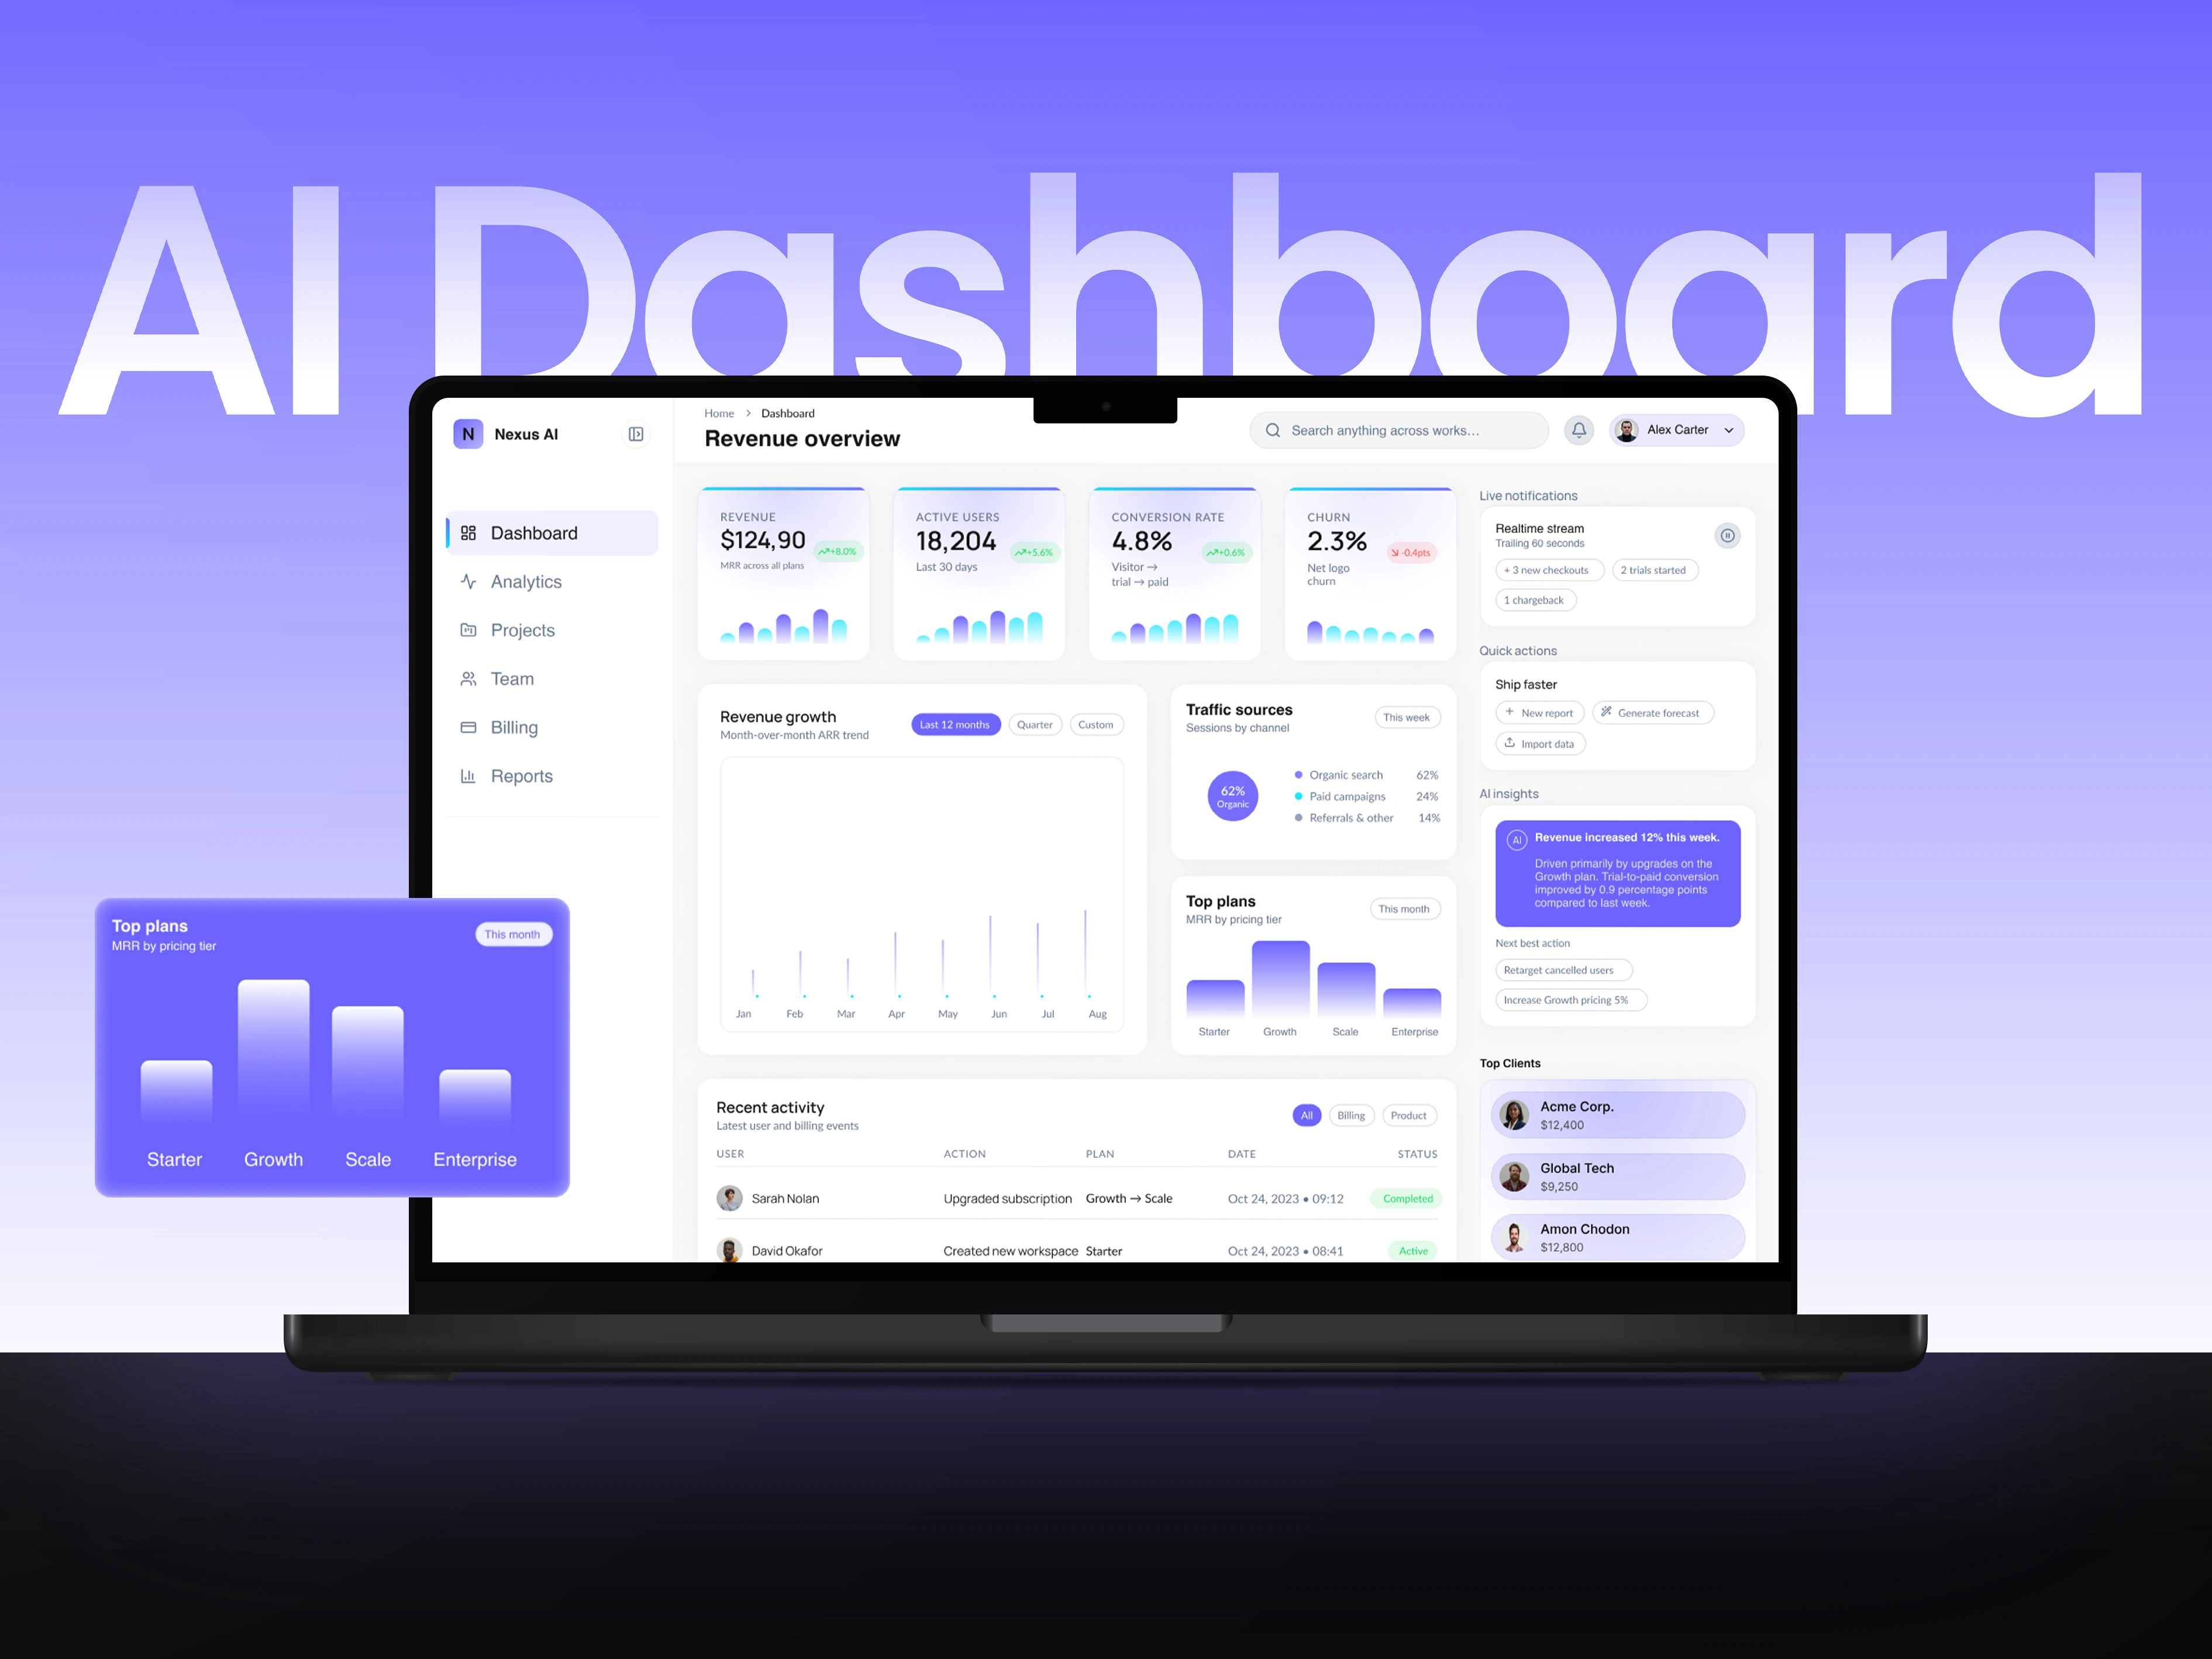
Nexus AI is a self-initiated SaaS analytics dashboard concept. The design challenge is not simply to fit more metrics on a screen, but to organise them so a viewer can distinguish the headline figures from supporting trends and operational detail.
INFORMATION IN LAYERS
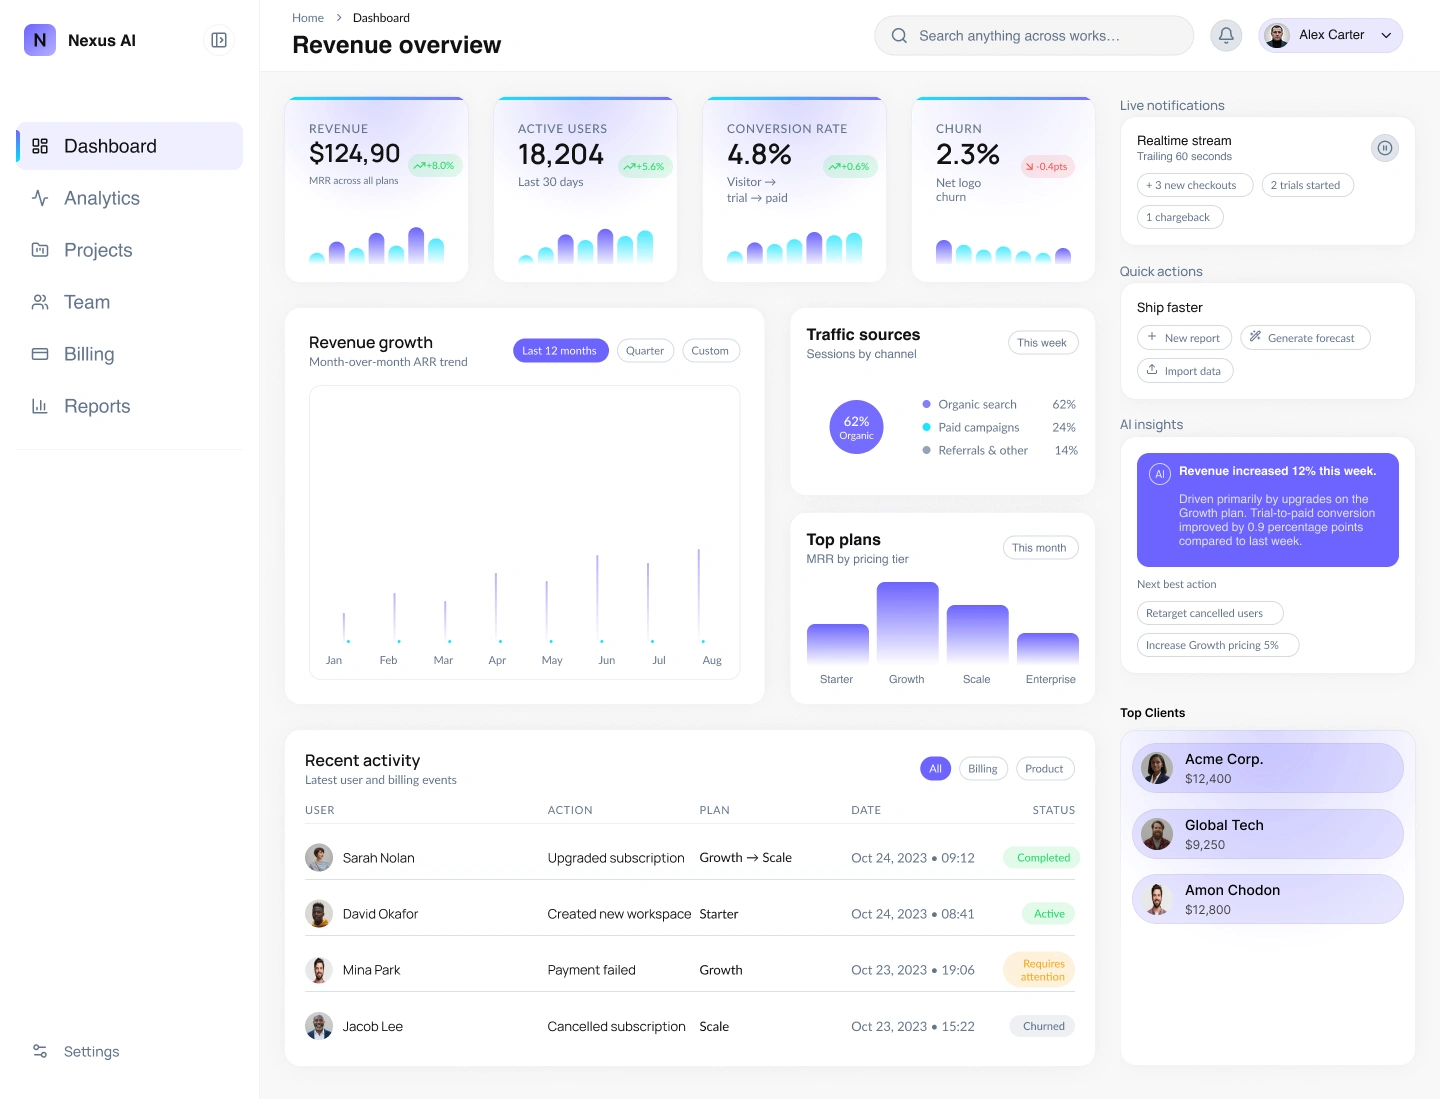
The top row gives MRR, active users, conversion and churn a shared card structure. Larger figures establish the reading priority; smaller labels and miniature charts supply context. Below, the broader revenue chart receives more space, while traffic sources, plans and recent activity occupy supporting panels.
NAVIGATION AND VISUAL RESTRAINT
A persistent left sidebar separates navigation from analytical content. Pale surfaces and subtle card boundaries organise the screen without turning every panel into a competing focal point. Purple accents connect the selected navigation state, chart treatments and highlighted information.
The layout highlights key KPIs such as MRR, active users, conversion rate, and churn, supported by intuitive charts and structured data visualization. Soft gradients and subtle shadows add depth while maintaining a calm, professional aesthetic suited for B2B environments.
The composition groups related metrics and gives different information types distinct areas. That hierarchy is intended to support scanning; it is a design proposal rather than a usability result established through testing.
The outcome is a dashboard concept that demonstrates prioritisation, grouping and a consistent component language. All displayed metrics are illustrative interface content.
Thank you for exploring the Nexus AI – SaaS Analytics Dashboard project.
The case study focuses on the presentation of analytical information, not a deployed AI product or verified business performance.
If you found this project insightful, feel free to appreciate, share, or leave your thoughts. Your feedback is always valued.
Like this project
Posted Oct 16, 2026
A SaaS dashboard concept organising headline KPIs, revenue trends and activity through layered hierarchy, grouped cards and restrained purple accents.
Likes
0
Views
4