Course Completion Dashboard
Alexander Nallin
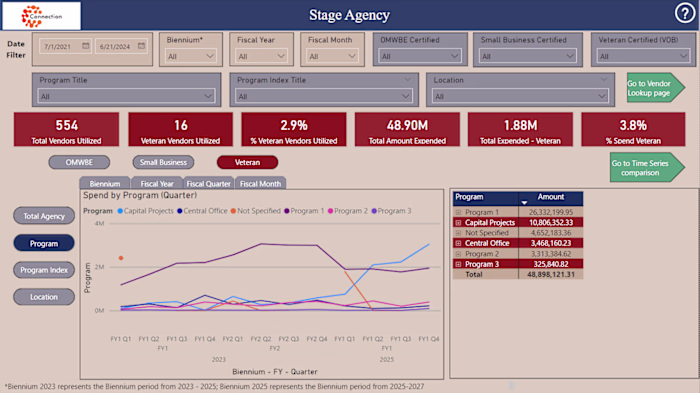
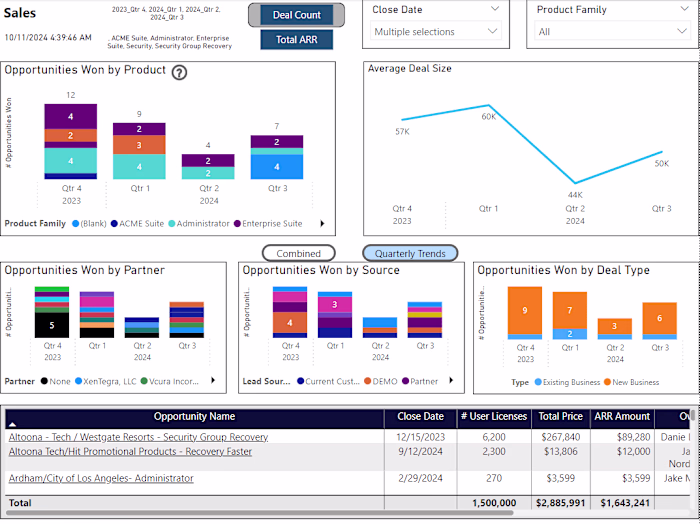
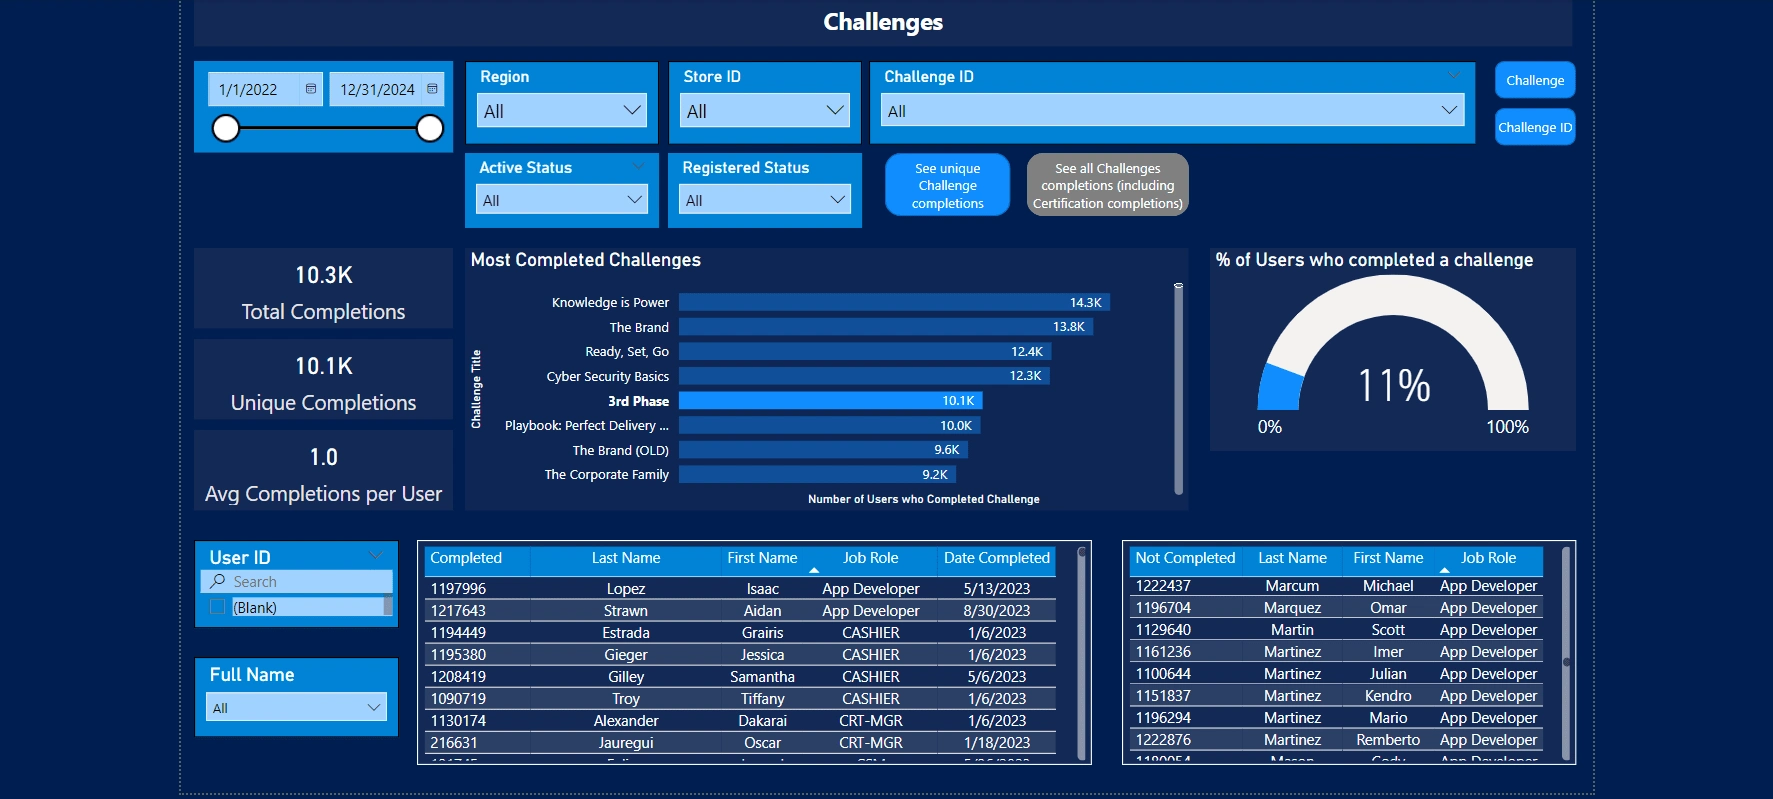
Project description. Project was completed for client to use in conjunction with an application which makes it easy for organizations to house their professional trainings. Data was stored in Amazon RDS and piped into Power BI, allowing for completion dashboards to be created and shared across the organization's leadership. Features allows users to set parameters using filters, and change the entire chart by selecting any one aspect of the visuals.
Like this project
Posted Oct 25, 2024
Created dashboard in partnership with a tech startup, allowing client to see how their employees have utilized the application and the trainings on it
Likes
0
Views
24