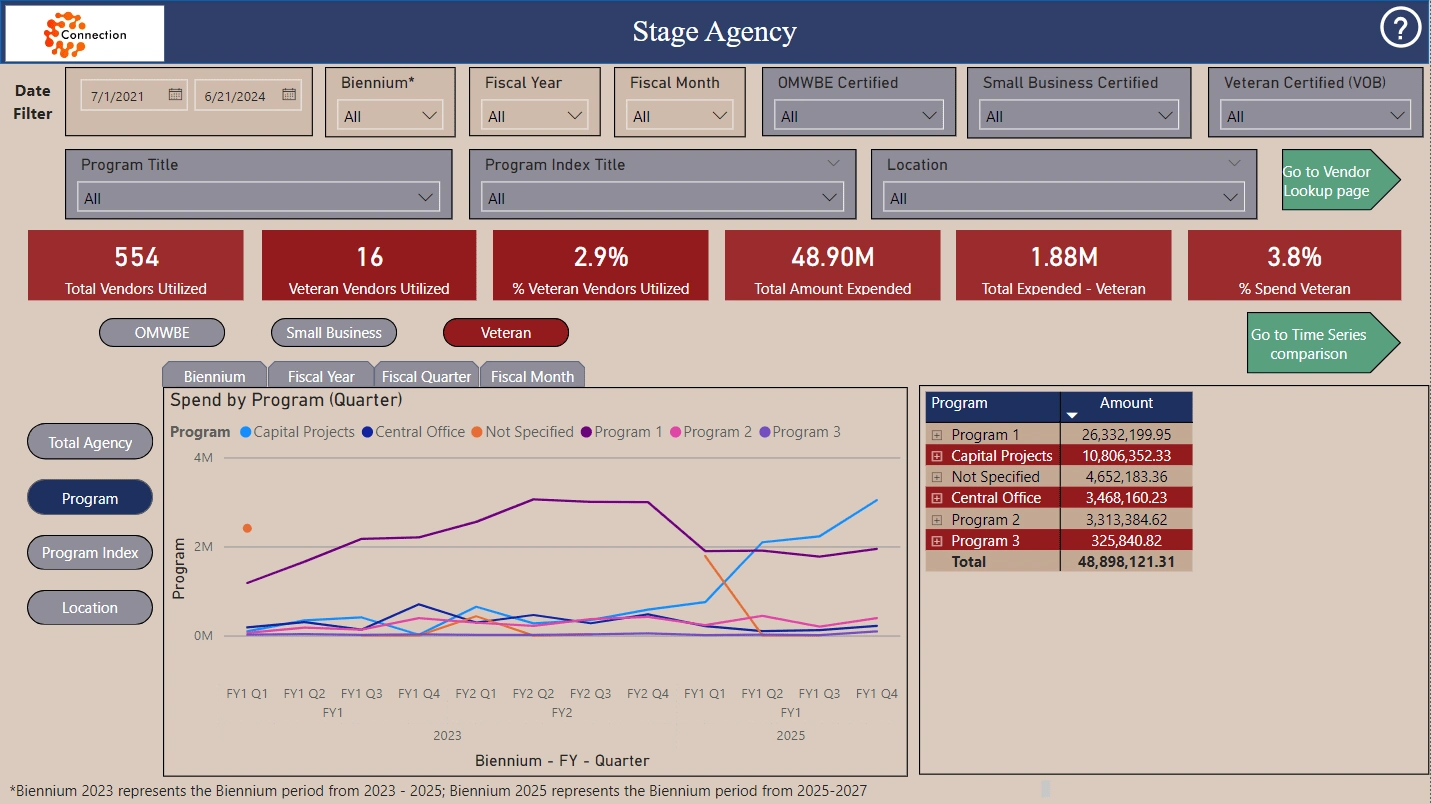
Diverse Spend Dashboard for State Agency
Alexander Nallin
Project description. In this dashboard, leadership from a state agency could quickly see the portion of their total spending that it going to small, minority, and veteran-owned businesses. By using the buttons, the user can change the type of certification they want to see from their vendors and view by total, program, program type, and location.
Like this project
Posted Oct 25, 2024
Dashboard was created for a state agency, allowing leadership to quickly view their diverse spending against overall spending.
Likes
0
Views
14