Business Development Dashboard
Alexander Nallin
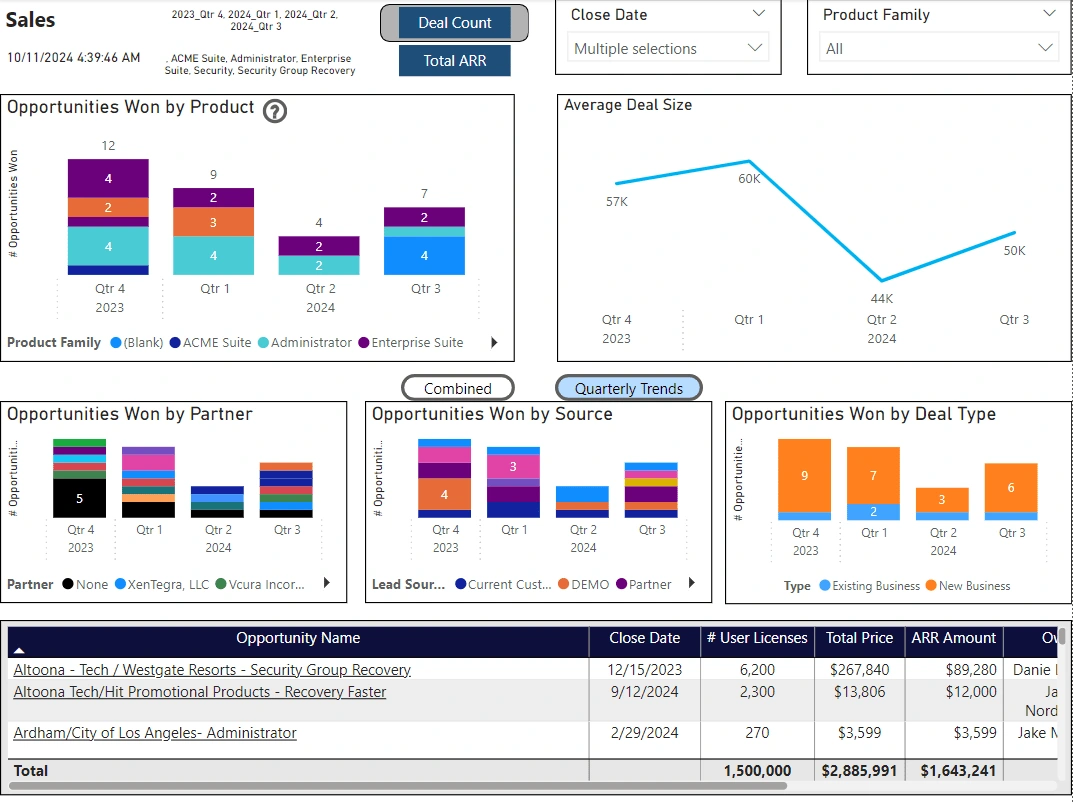
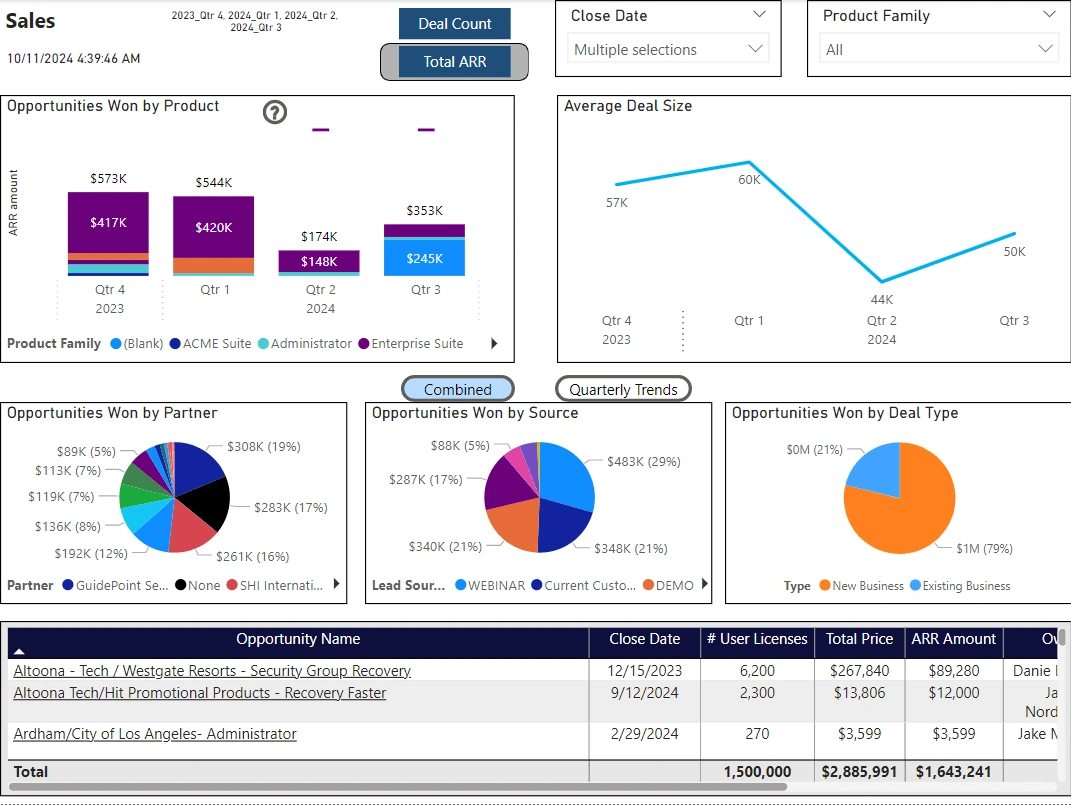
Project description. This dashboard depicts an organization’s business development efforts using data taken from Salesforce. The user can filter the information using the slicers at the top, and the buttons allow the user to seamlessly change the metric or time interval measured.
Like this project
Posted Oct 25, 2024
Dashboard was created for a software firm in order to analyze its Salesforce leads data and gain better understanding of their business development strategy.
Likes
0
Views
23