Enterprise Data Platform Revamp

Marcus Hernandez


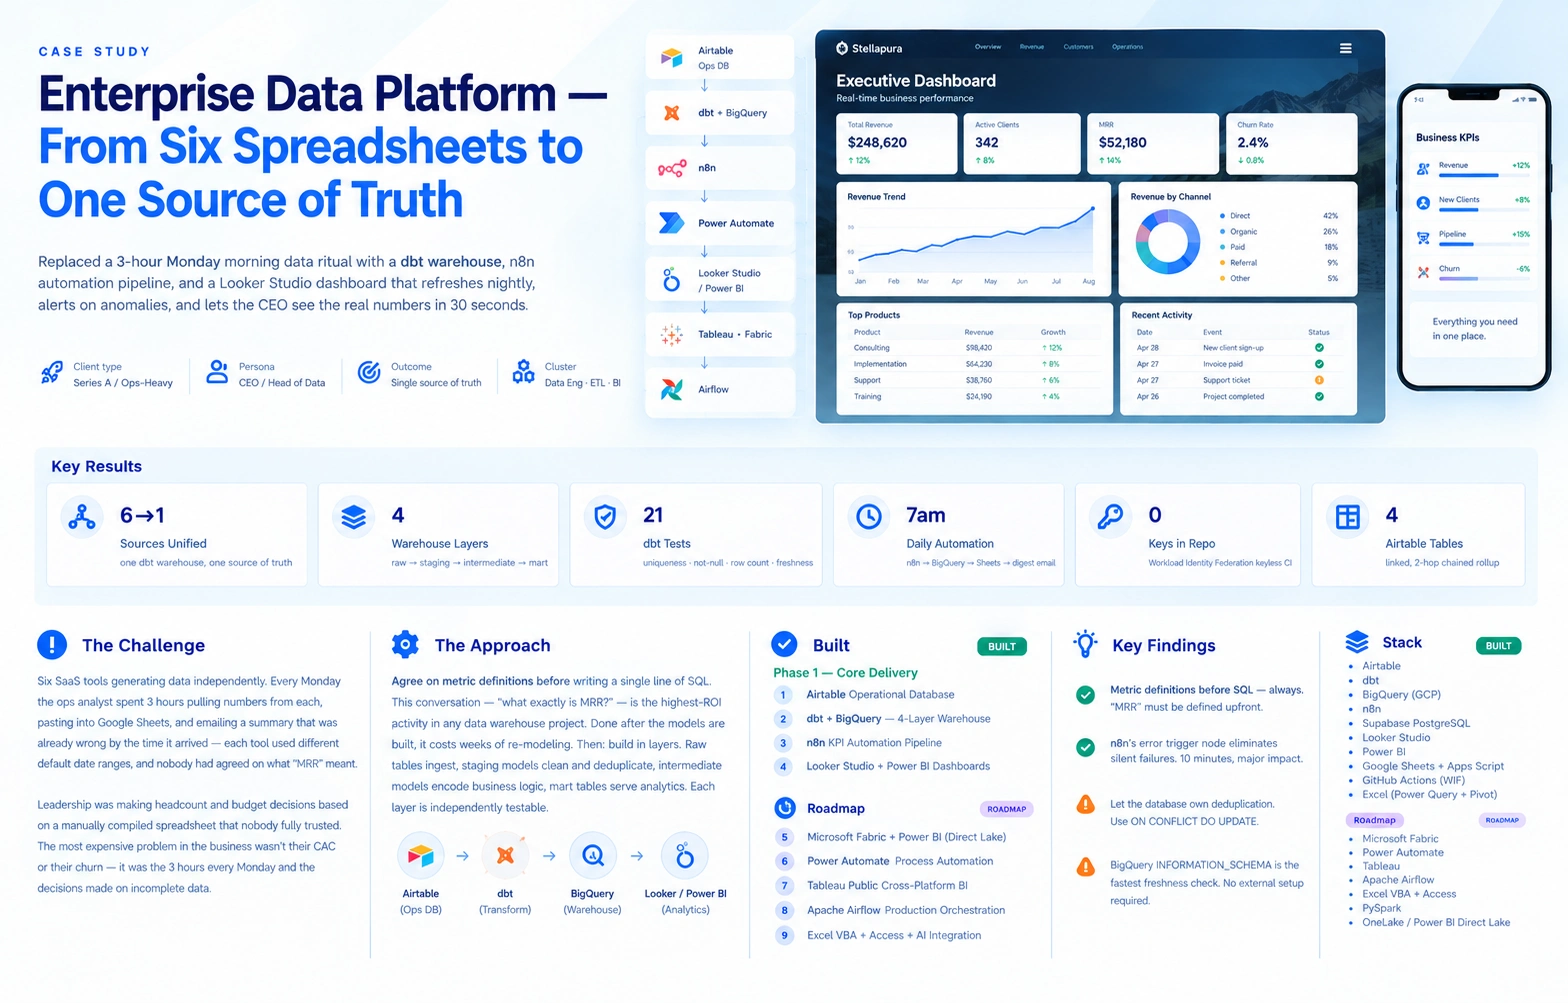
Enterprise Data Platform — From Six Spreadsheets to One Source of Truth
Replaced a 3-hour Monday morning data ritual with a dbt warehouse, n8n automation pipeline, and a Looker Studio dashboard that refreshes nightly, alerts on anomalies, and lets the CEO see the real numbers in 30 seconds.
THE CHALLENGE
Six SaaS tools generating data independently. Every Monday, the ops analyst spent 3 hours pulling numbers from each, pasting into Google Sheets, and emailing a summary that was already wrong by the time it arrived — each tool used different default date ranges, and nobody had agreed on what "MRR" meant. Did it include trials? Expansion? Refunds? The answer changed depending on who was presenting.
Leadership was making headcount and budget decisions based on a manually compiled spreadsheet that nobody fully trusted. The most expensive problem in the business wasn't their CAC or their churn — it was the 3 hours every Monday and the decisions made on incomplete data.
THE APPROACH
Agree on metric definitions before writing a single line of SQL. This conversation — "what exactly is MRR?" — is the highest-ROI activity in any data warehouse project. Done after the models are built, it costs weeks of re-modeling. Then: build in layers. Raw tables ingest, staging models clean and deduplicate, intermediate models encode business logic, mart tables serve analytics. Each layer is independently testable.
THE BUILD
1. Airtable Operational Database
4-table linked Airtable base: Clients, Projects, Deliverables, Team. 2-hop chained rollup (Deliverables → Projects → Clients) for client-level revenue and utilization aggregation. Chained lookup surfacing project manager name on every Deliverable record. 3 native automations: new Project → auto-create standard Deliverable set, Deliverable marked complete → update Project status, weekly summary email to team. Interface dashboard for non-technical team members: pipeline view, capacity heatmap, utilization rate. Priority Score formula: composite of deal value, stage, and days-to-deadline — no scripting required (Airtable gated Scripting behind paid plan mid-build; formula-chain approach fully equivalent).
2. dbt + BigQuery — 4-Layer Data Warehouse
Built on real Stellapura production BigQuery data — not synthetic. Staging models deduplicate raw event tables (upstream connector write bug discovered on first live run and fixed at source). Intermediate models: mrr_by_month, churn_cohort, lead_to_close_days, sessions_attributed. Mart tables: fct_revenue, fct_pipeline, dim_customer. dbt tests: row count assertions, uniqueness checks, not-null guards, accepted values. Data freshness check via INFORMATION_SCHEMA.TABLES — alerts if source table hasn't updated in 24 hours. Keyless CI via Workload Identity Federation — no service account keys in the repo, ever. Full dbt docs site live on GitHub Pages.
3. n8n KPI Automation Pipeline
Self-hosted n8n (daily 7am scheduled trigger). Four sequential nodes: (1) HTTP request to BigQuery REST API — KPI snapshots from mart tables; (2) JS transform: WoW and MoM deltas calculated, flags KPIs outside acceptable range; (3) Google Sheets append — daily row with ON CONFLICT DO UPDATE deduplication logic via unique date key; (4) Gmail formatted HTML digest — traffic-light indicators (green/yellow/red vs targets) sent to leadership. Error trigger node on every path: any node failure → immediate Slack alert. Also built: GraphQL API integration using GitHub's public API as a model for Jobber/ServiceTitan-style field-service API patterns — OAuth token auth, paginated cursor queries, normalized rows written to Supabase PostgreSQL with ON CONFLICT DO UPDATE.
4. Looker Studio + Power BI Executive Dashboards
Looker Studio: 3-page dashboard (Revenue, Pipeline, Operations). Calculated fields: MoM delta, cohort retention rate, ROAS, CPL. Data control lets CEO swap date ranges without breaking any field — verified by swapping to the GA4 Demo Account. Power BI: Stellapura Payroll dashboard (3 pages: payroll summary, timesheet drill-down, labor cost vs revenue). Power Query data model, 4 pivot-table relationships, DAX measures, direct table relationships. Exported to PDF for board-ready reporting.
5. Microsoft Fabric + Power BI Direct Lake
Microsoft Fabric Lakehouse on OneLake — ingesting the same sources currently flowing into BigQuery, demonstrating cross-cloud warehouse portability. Dataflow Gen2 for ingestion, Pipeline orchestration (Fabric equivalent of Airflow), PySpark Notebook for data quality transforms. Fabric Warehouse + SQL views for downstream analytics. Power BI Direct Lake semantic model — queries OneLake directly without import, enabling real-time BI at scale. Positions Marcus as multi-cloud data platform capable: GCP (BigQuery + dbt) and Microsoft (Fabric + Power BI) in the same portfolio.
6. Power Automate Process Automation Suite
M365 Developer Program tenant. Three-part automation suite: (1) contract approval workflow (Forms → SharePoint → multi-stage approval chain → Teams notification on completion), (2) employee onboarding automation (parallel branches: Planner task creation, calendar blocking, SharePoint folder setup, welcome email), (3) error handling + run history documentation for ops team. Nintex bridge notes in case study for clients on legacy Nintex workflows migrating to Power Automate.
7. Tableau Public — Cross-Platform BI Portfolio
Port the Stellapura Payroll dashboard from Power BI to Tableau Public (free, live URL). Calculated fields + parameters for dynamic drill-down. Side-by-side comparison: same dataset, Power BI vs Tableau — demonstrates cross-platform BI fluency to clients who are locked into either ecosystem. Tableau Public page as a live portfolio link.
8. Apache Airflow — Production Pipeline Orchestration
Port the Stellapura payroll ETL into a real Airflow DAG via Astro CLI. Retry logic, XCom for inter-task data passing, BranchPythonOperator for conditional paths, BigQueryOperator for warehouse writes, data quality check task (row count + null assertion) before any downstream model runs. Alert on failure via email + Slack. Cloud deployment documentation. Bridges the n8n orchestration (this CS) to production-grade pipeline tooling for data engineering roles.
9. Excel VBA + Access + AI API Integration
Excel VBA data import tool (CSV → financial model, column mapping dictionary, validation loop, error logging). 5-year solar project finance model (assumptions, cash flow, NPV/IRR/DSCR, sensitivity table). Access relational database: multi-table schema, parameterized queries, VBA-driven reports. MSXML2 HTTP call to Claude/OpenAI API from within VBA — AI-generated variance commentary on financial model outputs. Covers the M365 engineering stack for clients who live in Office and haven't migrated to cloud-native tools.
KEY FINDINGS
✓ Metric definitions before SQL — always. Agreeing on the exact meaning of "MRR" before writing models saved weeks of re-modeling. This is the highest-ROI conversation in any data warehouse engagement, and it belongs at kickoff, not after the first data review.
✓ n8n's error trigger node eliminates silent failures. Most pipelines fail without anyone noticing for days. Adding an error trigger routing failures to Slack took 10 minutes and turned invisible data outages into immediate alerts.
⚠ Let the database own deduplication. ON CONFLICT DO UPDATE in Supabase/PostgreSQL is faster and more reliable than pre-checking for duplicates in the orchestrator. The database was built for this; the pipeline was not.
⚠ BigQuery INFORMATION_SCHEMA is the fastest freshness check. A dbt test querying INFORMATION_SCHEMA.TABLES for last_modified_time will catch stale source tables before any downstream model processes outdated data — without requiring any external monitoring setup.
STACK
Airtable
dbt
BigQuery (GCP)
n8n
Supabase
PostgreSQL
Looker Studio
Power BI
Google Sheets + Apps Script
GitHub Actions (WIF)
Excel (Power Query + Pivot)
Microsoft Fabric
Power Automate
Tableau
Apache Airflow
Excel VBA + Access
PySpark
OneLake / Power BI Direct Lake
Like this project
Posted Oct 21, 2026
Transformed data workflows from spreadsheets to a centralized, automated warehouse and dashboard system.