
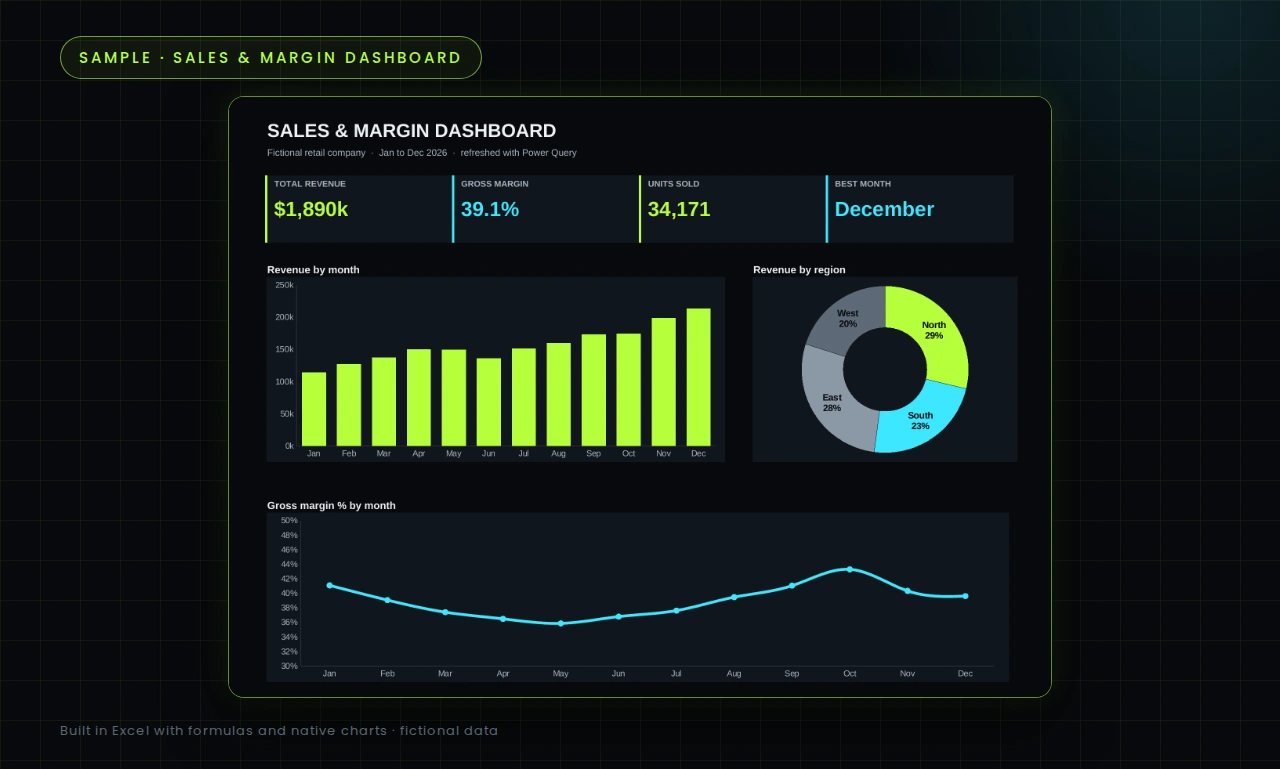
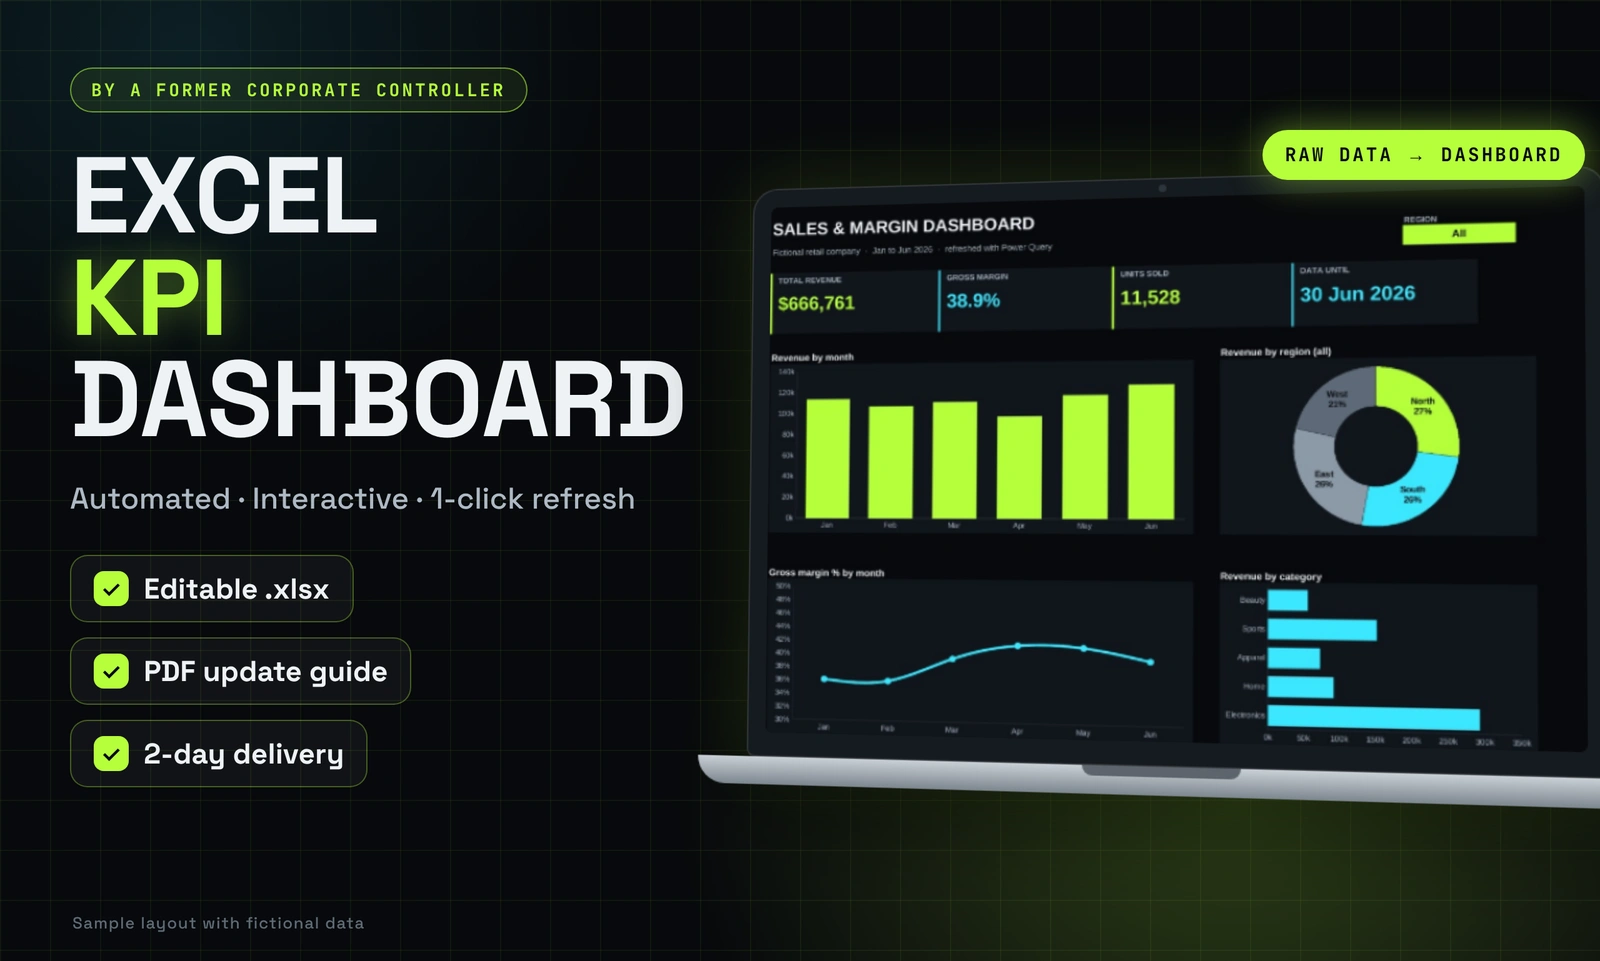
Sample project with fictional data, built to show how I turn raw exports into a dashboard that managers actually use.
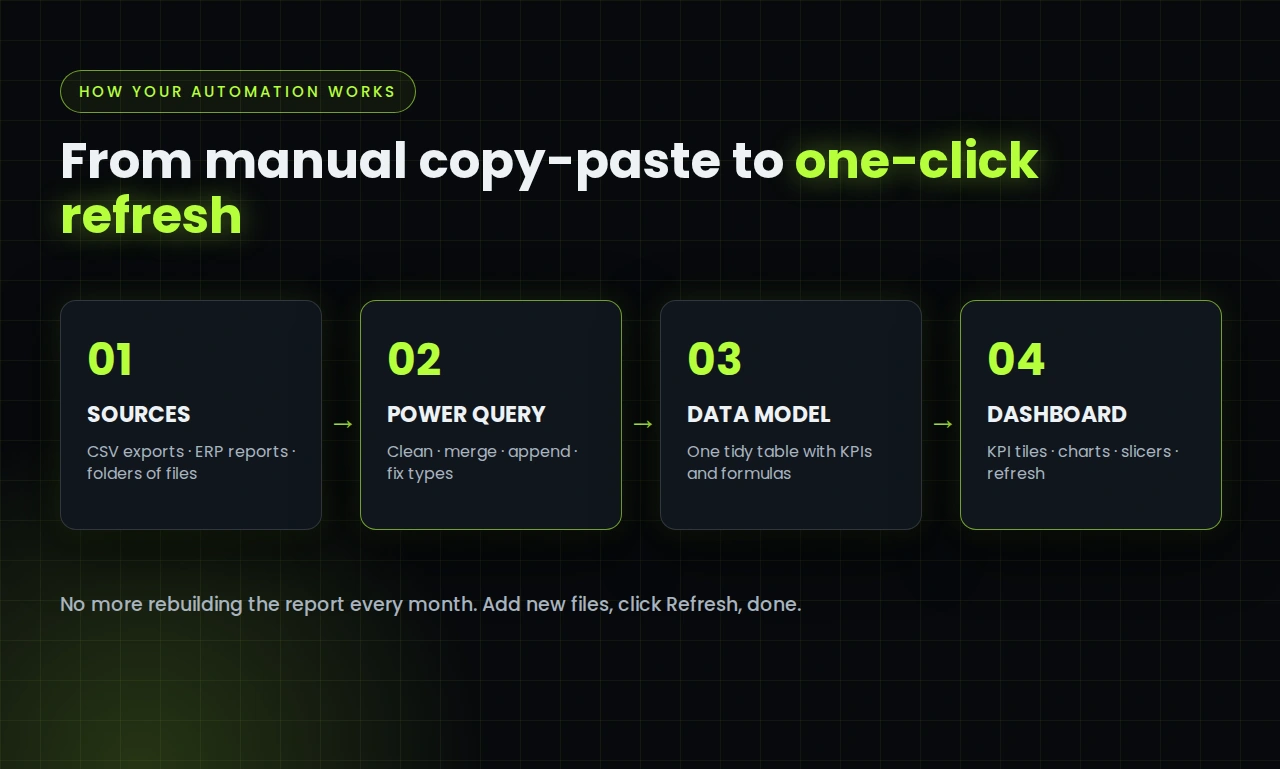
What it does: merges and cleans monthly sales exports with Power Query; KPI cards for revenue, gross margin and units sold; revenue by month, region and category with slicers; 1-click refresh when new data arrives.
Delivered as an editable .xlsx file with a short PDF guide to update the data. Built by a former corporate controller who knows which numbers managers check.
0 likes · 1 view · Nov 13, 2026
Sample Excel dashboard built with Power Query: raw sales exports turned into an interactive KPI view that refreshes in one click. Fictional data.
