
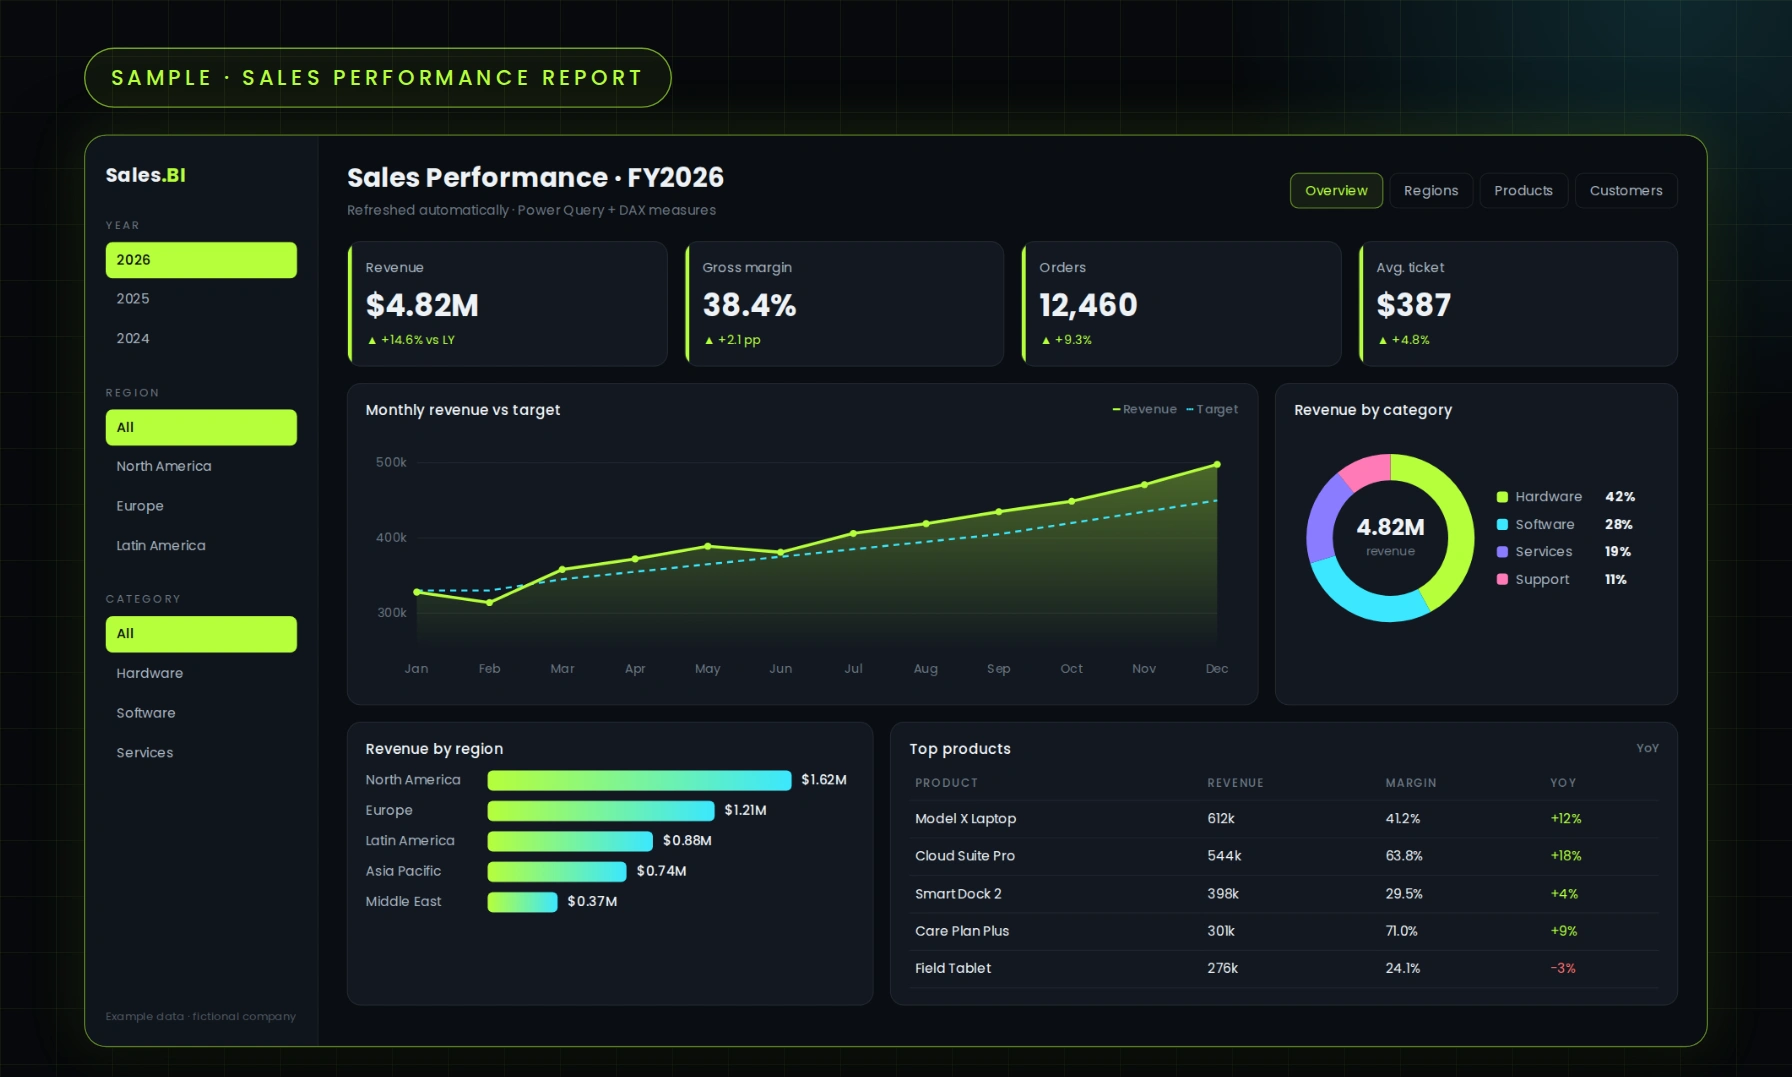
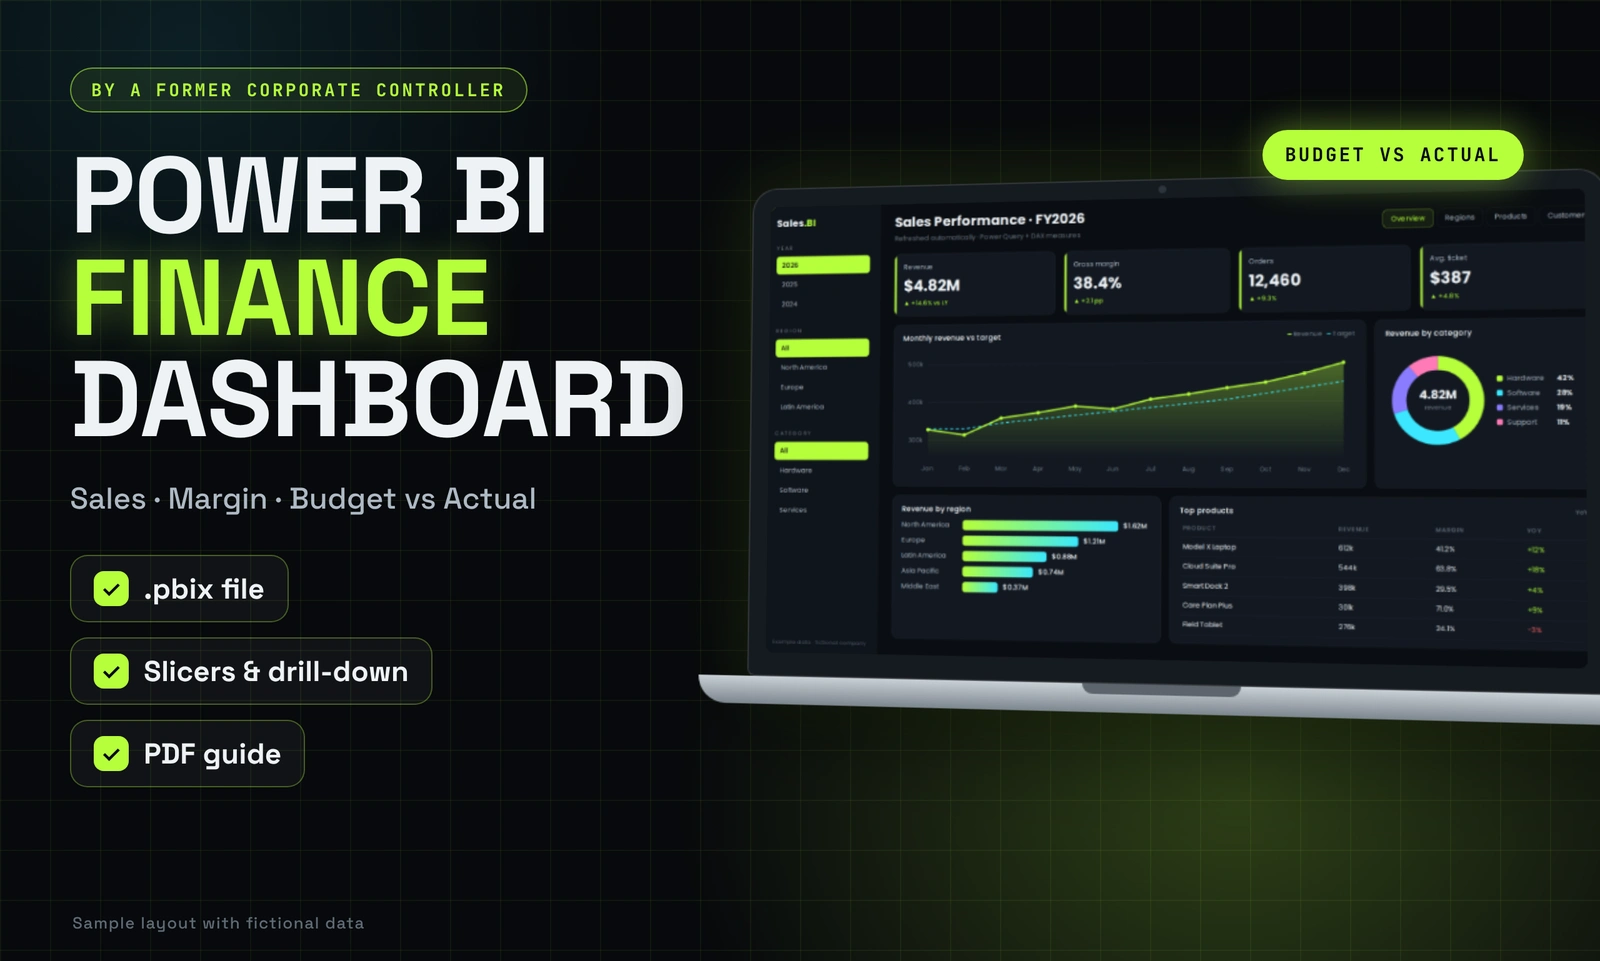
Sample Power BI report with fictional data, designed around the questions management asks after month-end.
What it shows: revenue, gross margin, orders and average ticket on one screen; monthly revenue vs target; revenue by region and category; top products with margin and year-over-year change; slicers by year, region and category.
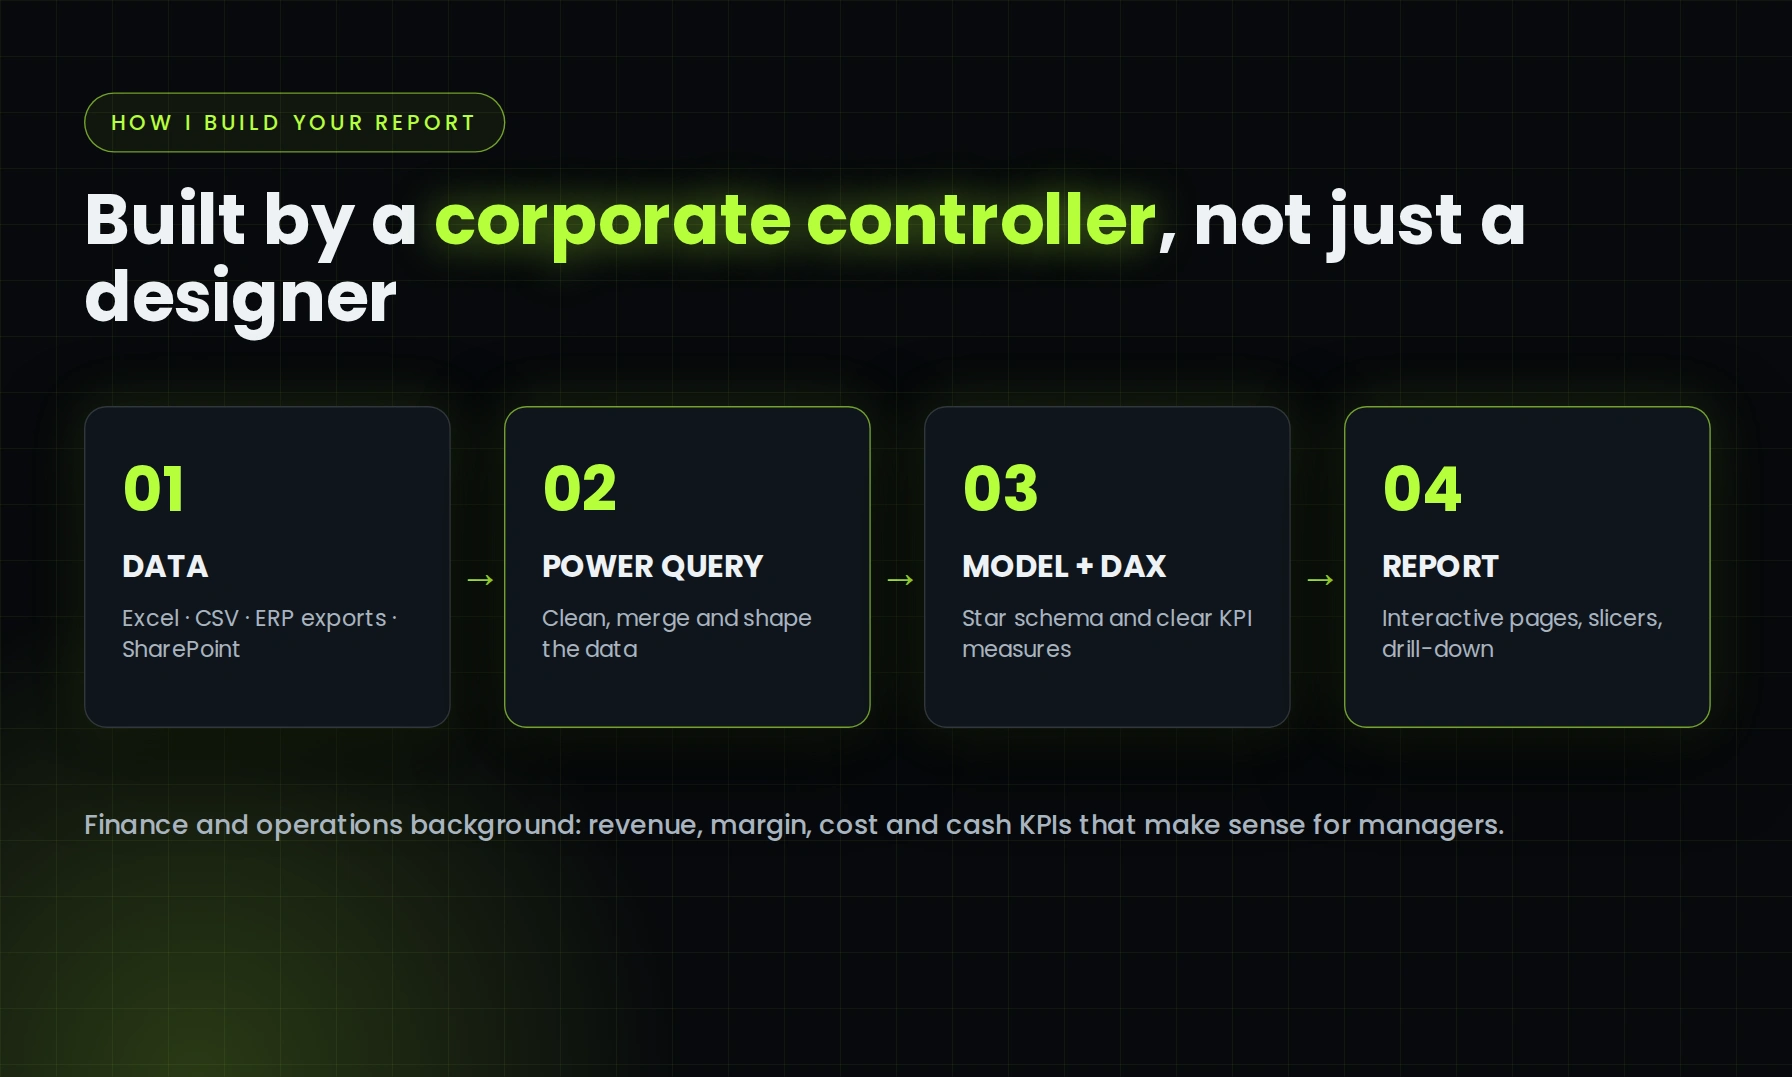
Built with Power Query and DAX measures checked against the source totals. Delivered as an editable .pbix file with a PDF snapshot of every page.
0 likes · 1 view · Nov 13, 2026
Sample Power BI report: sales, margin and target tracking on one screen, with drill-down by region, category and product. Fictional data.
