Information Technology | Infographic & Layout Design
Haneef Bakare
✨ Introduction
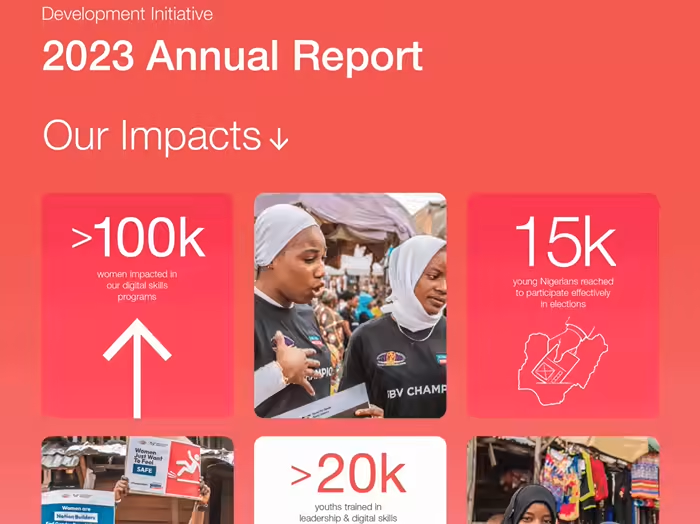
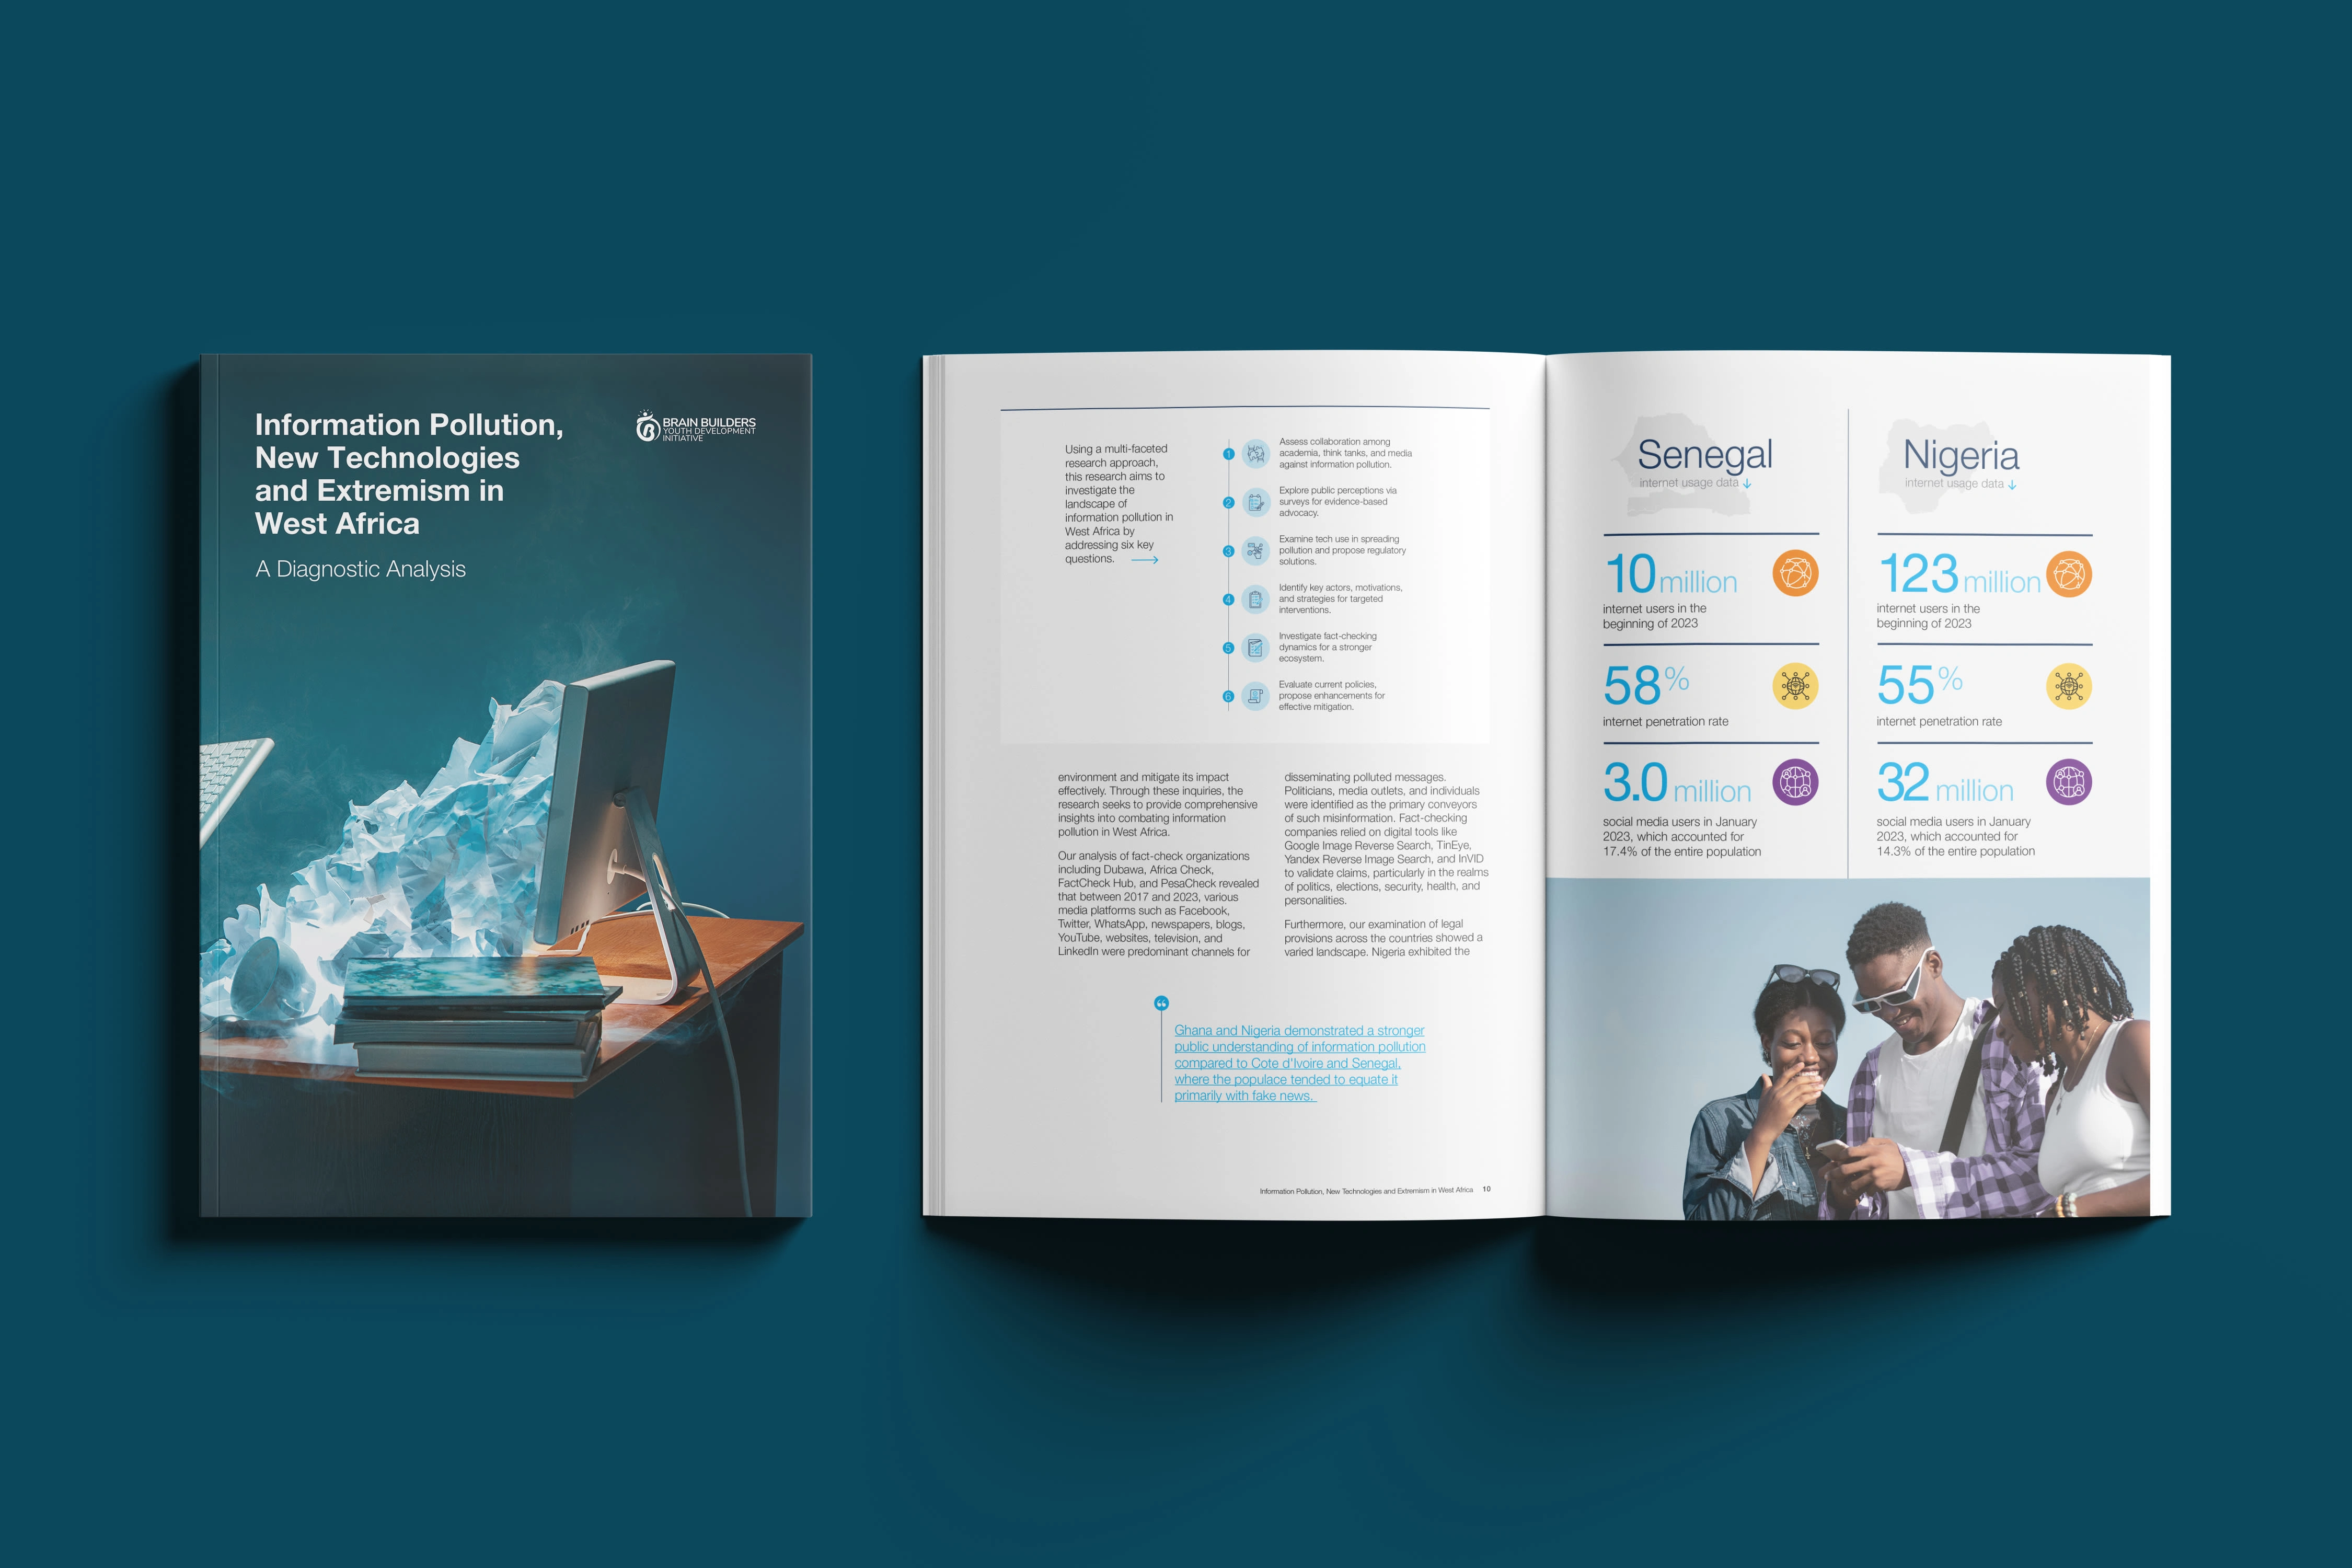
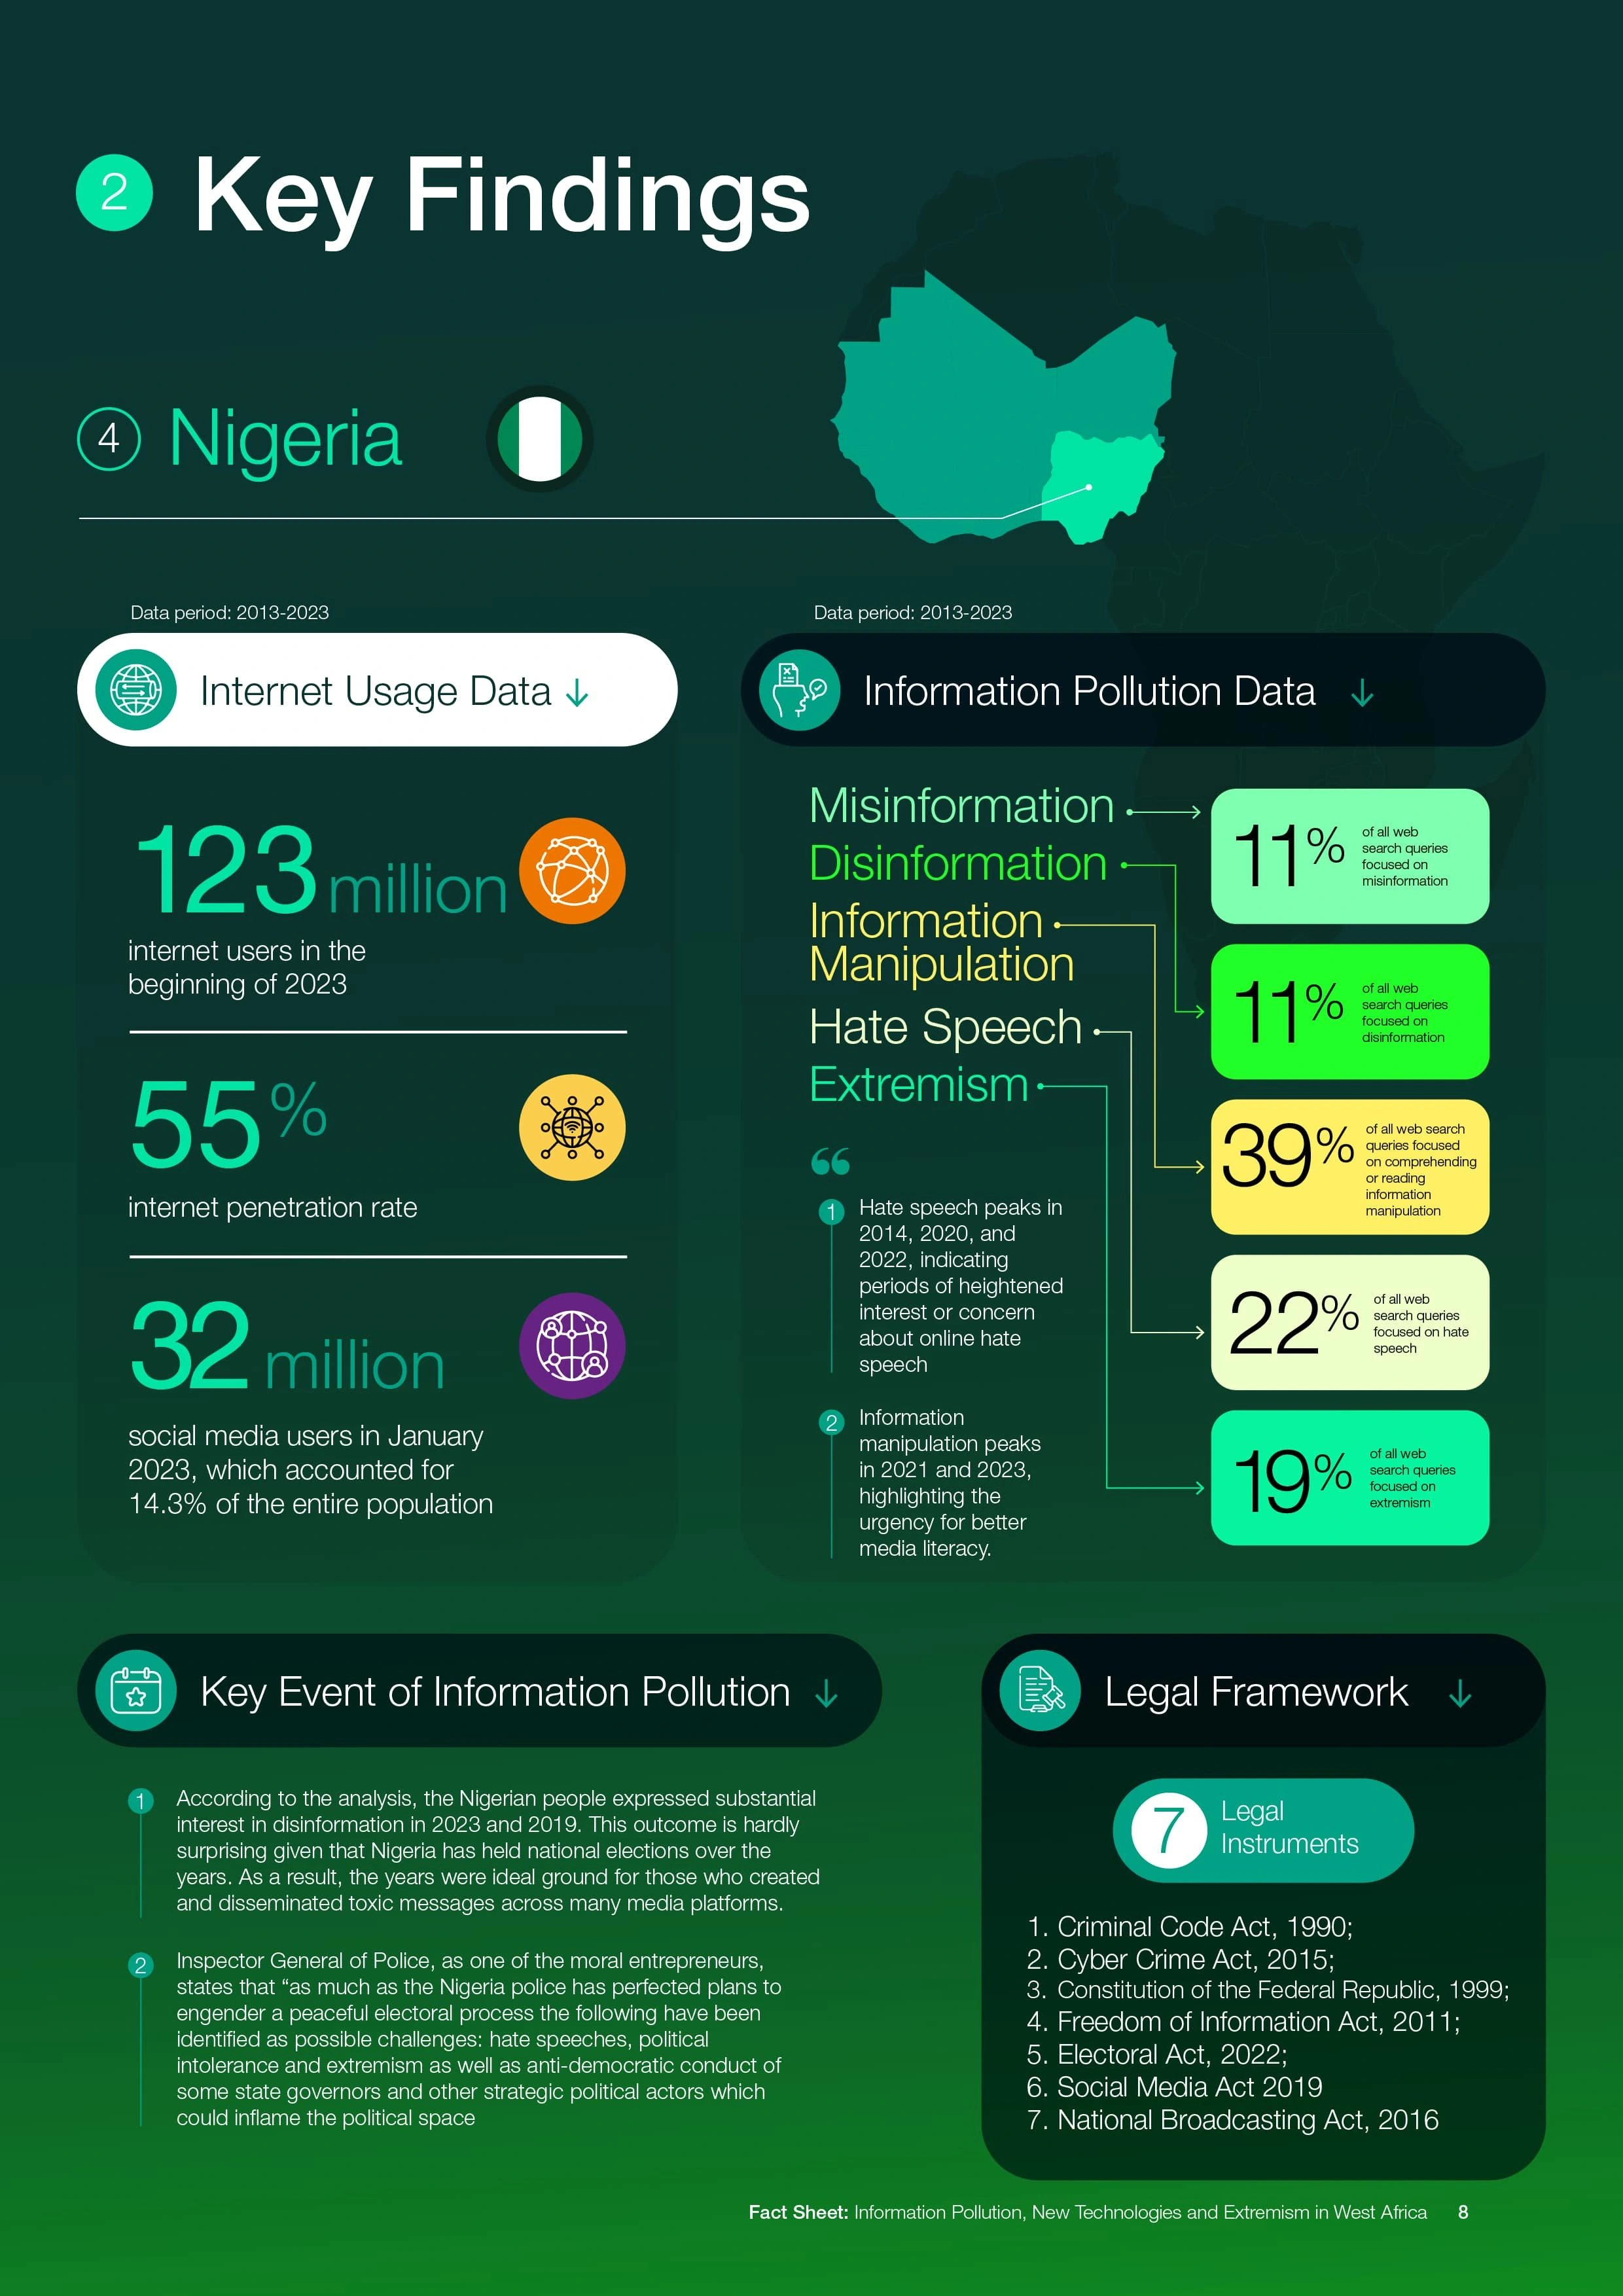
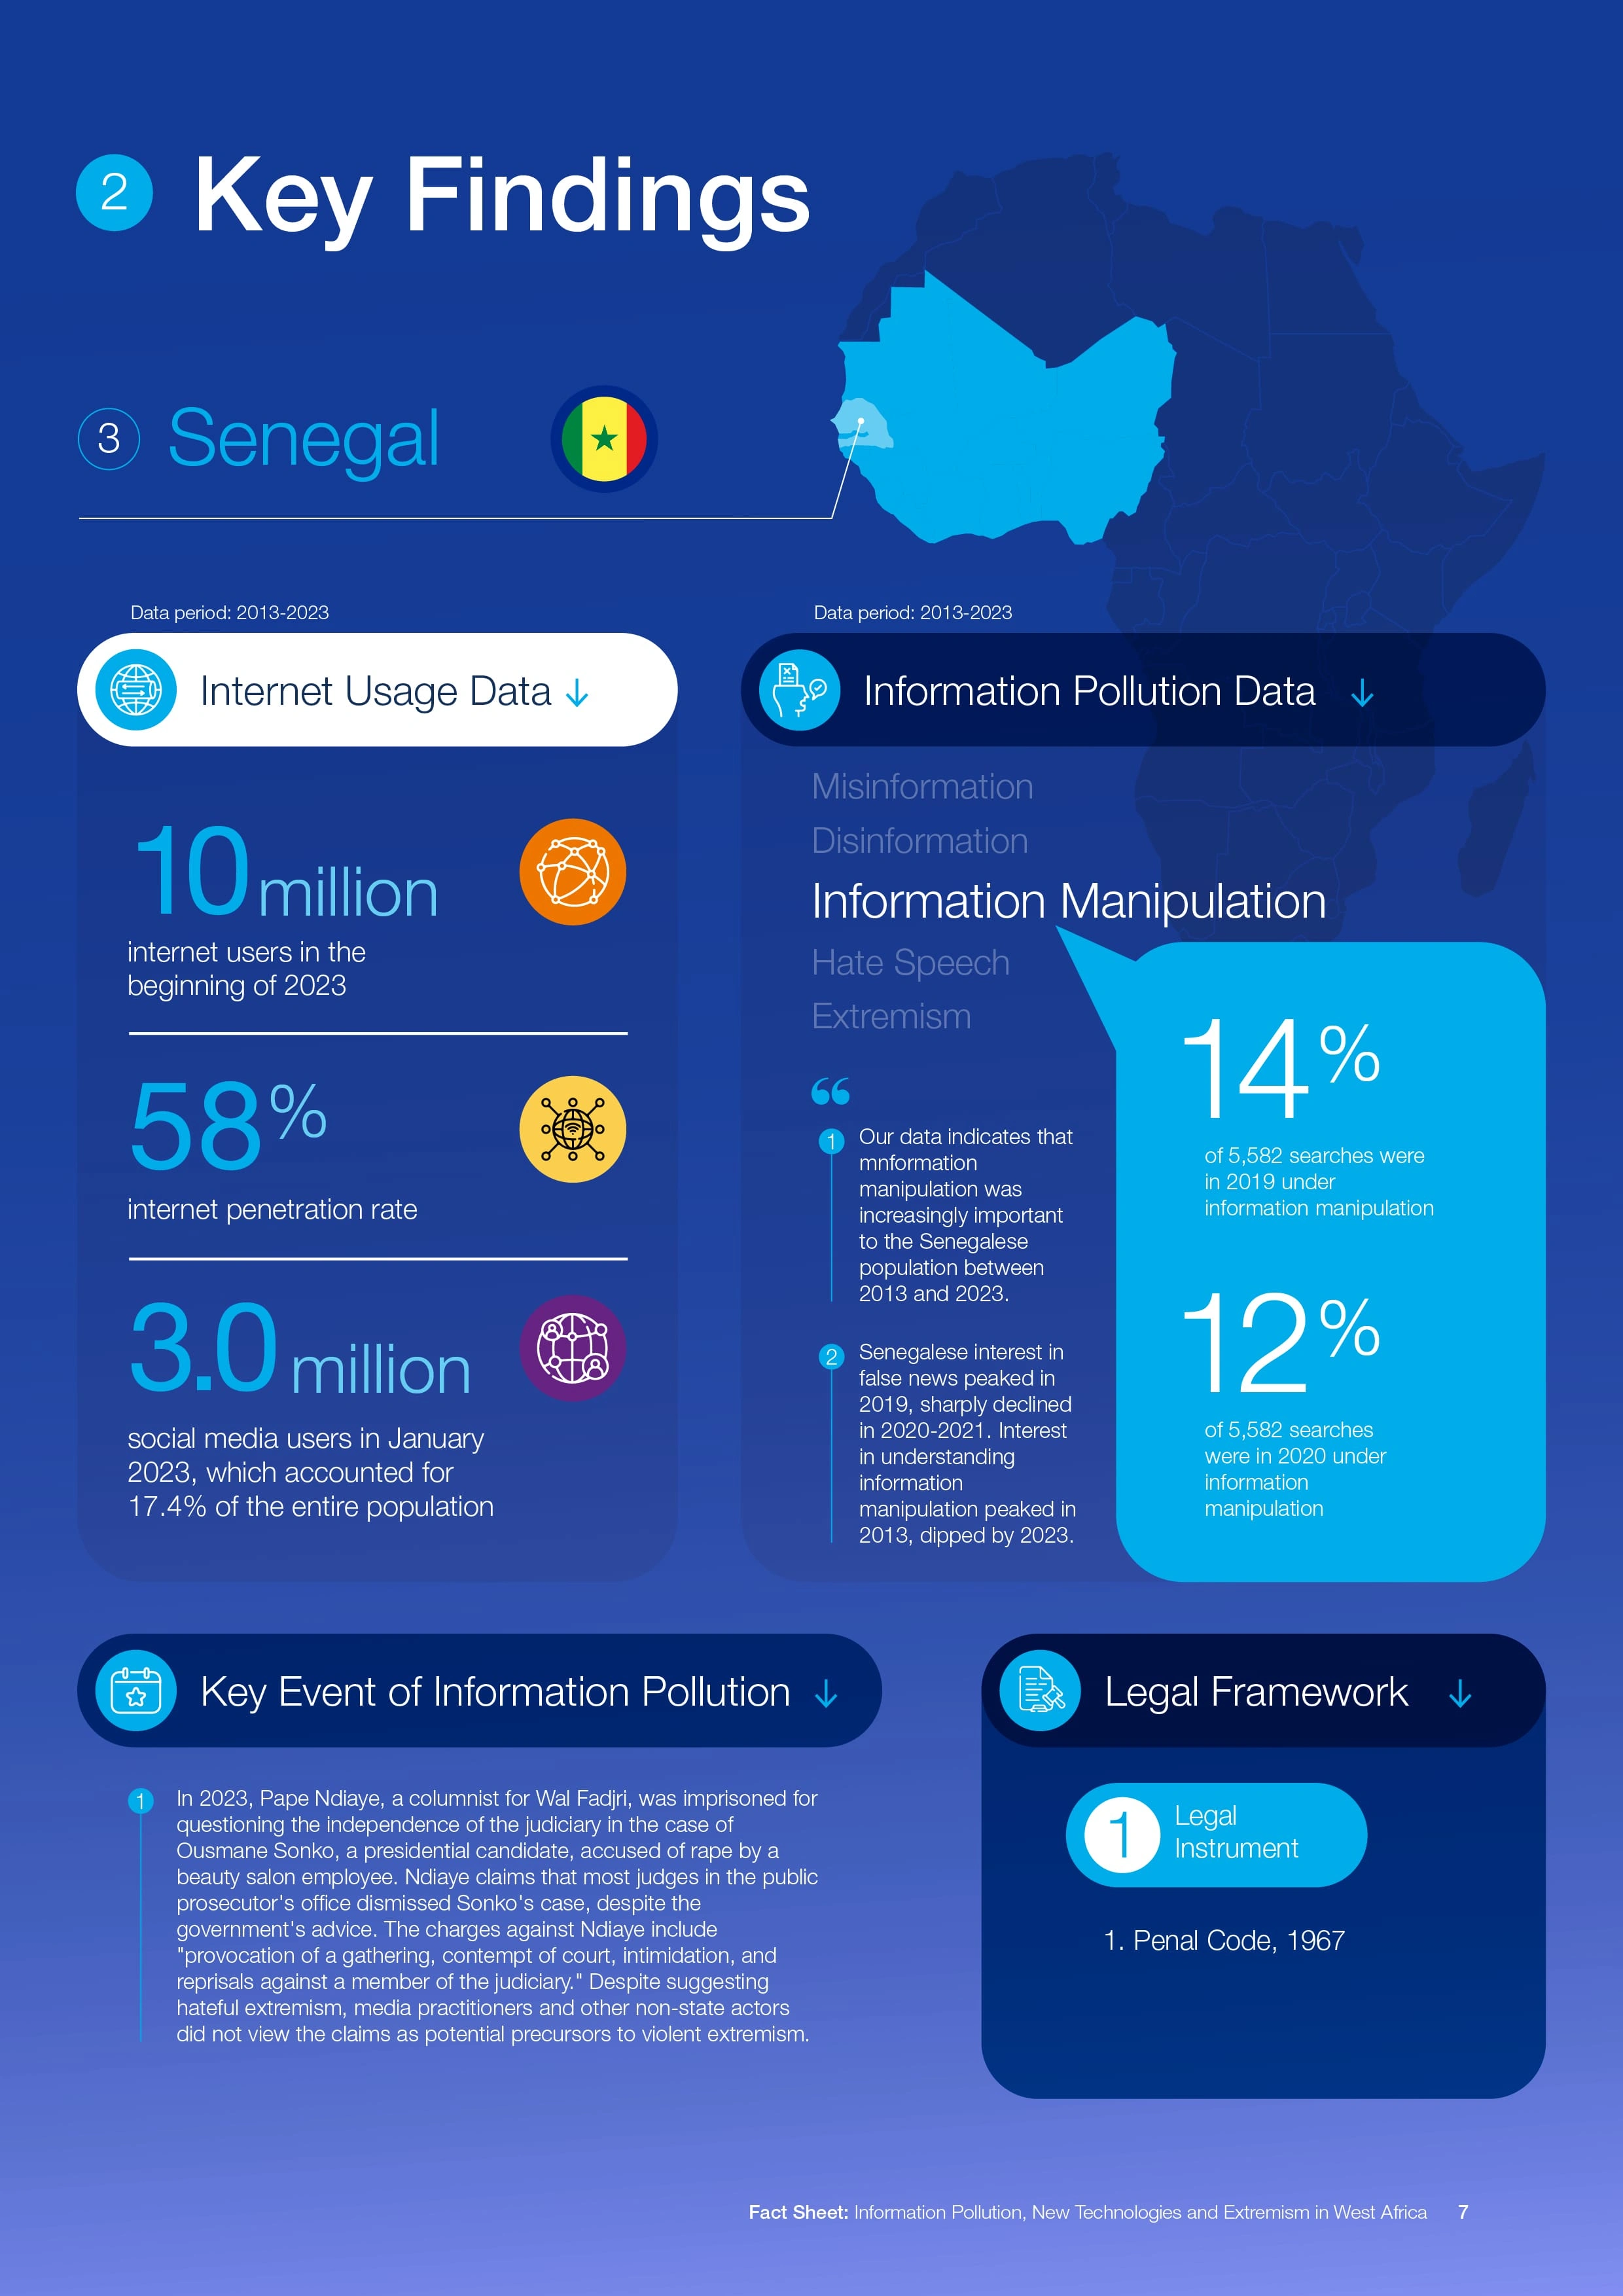
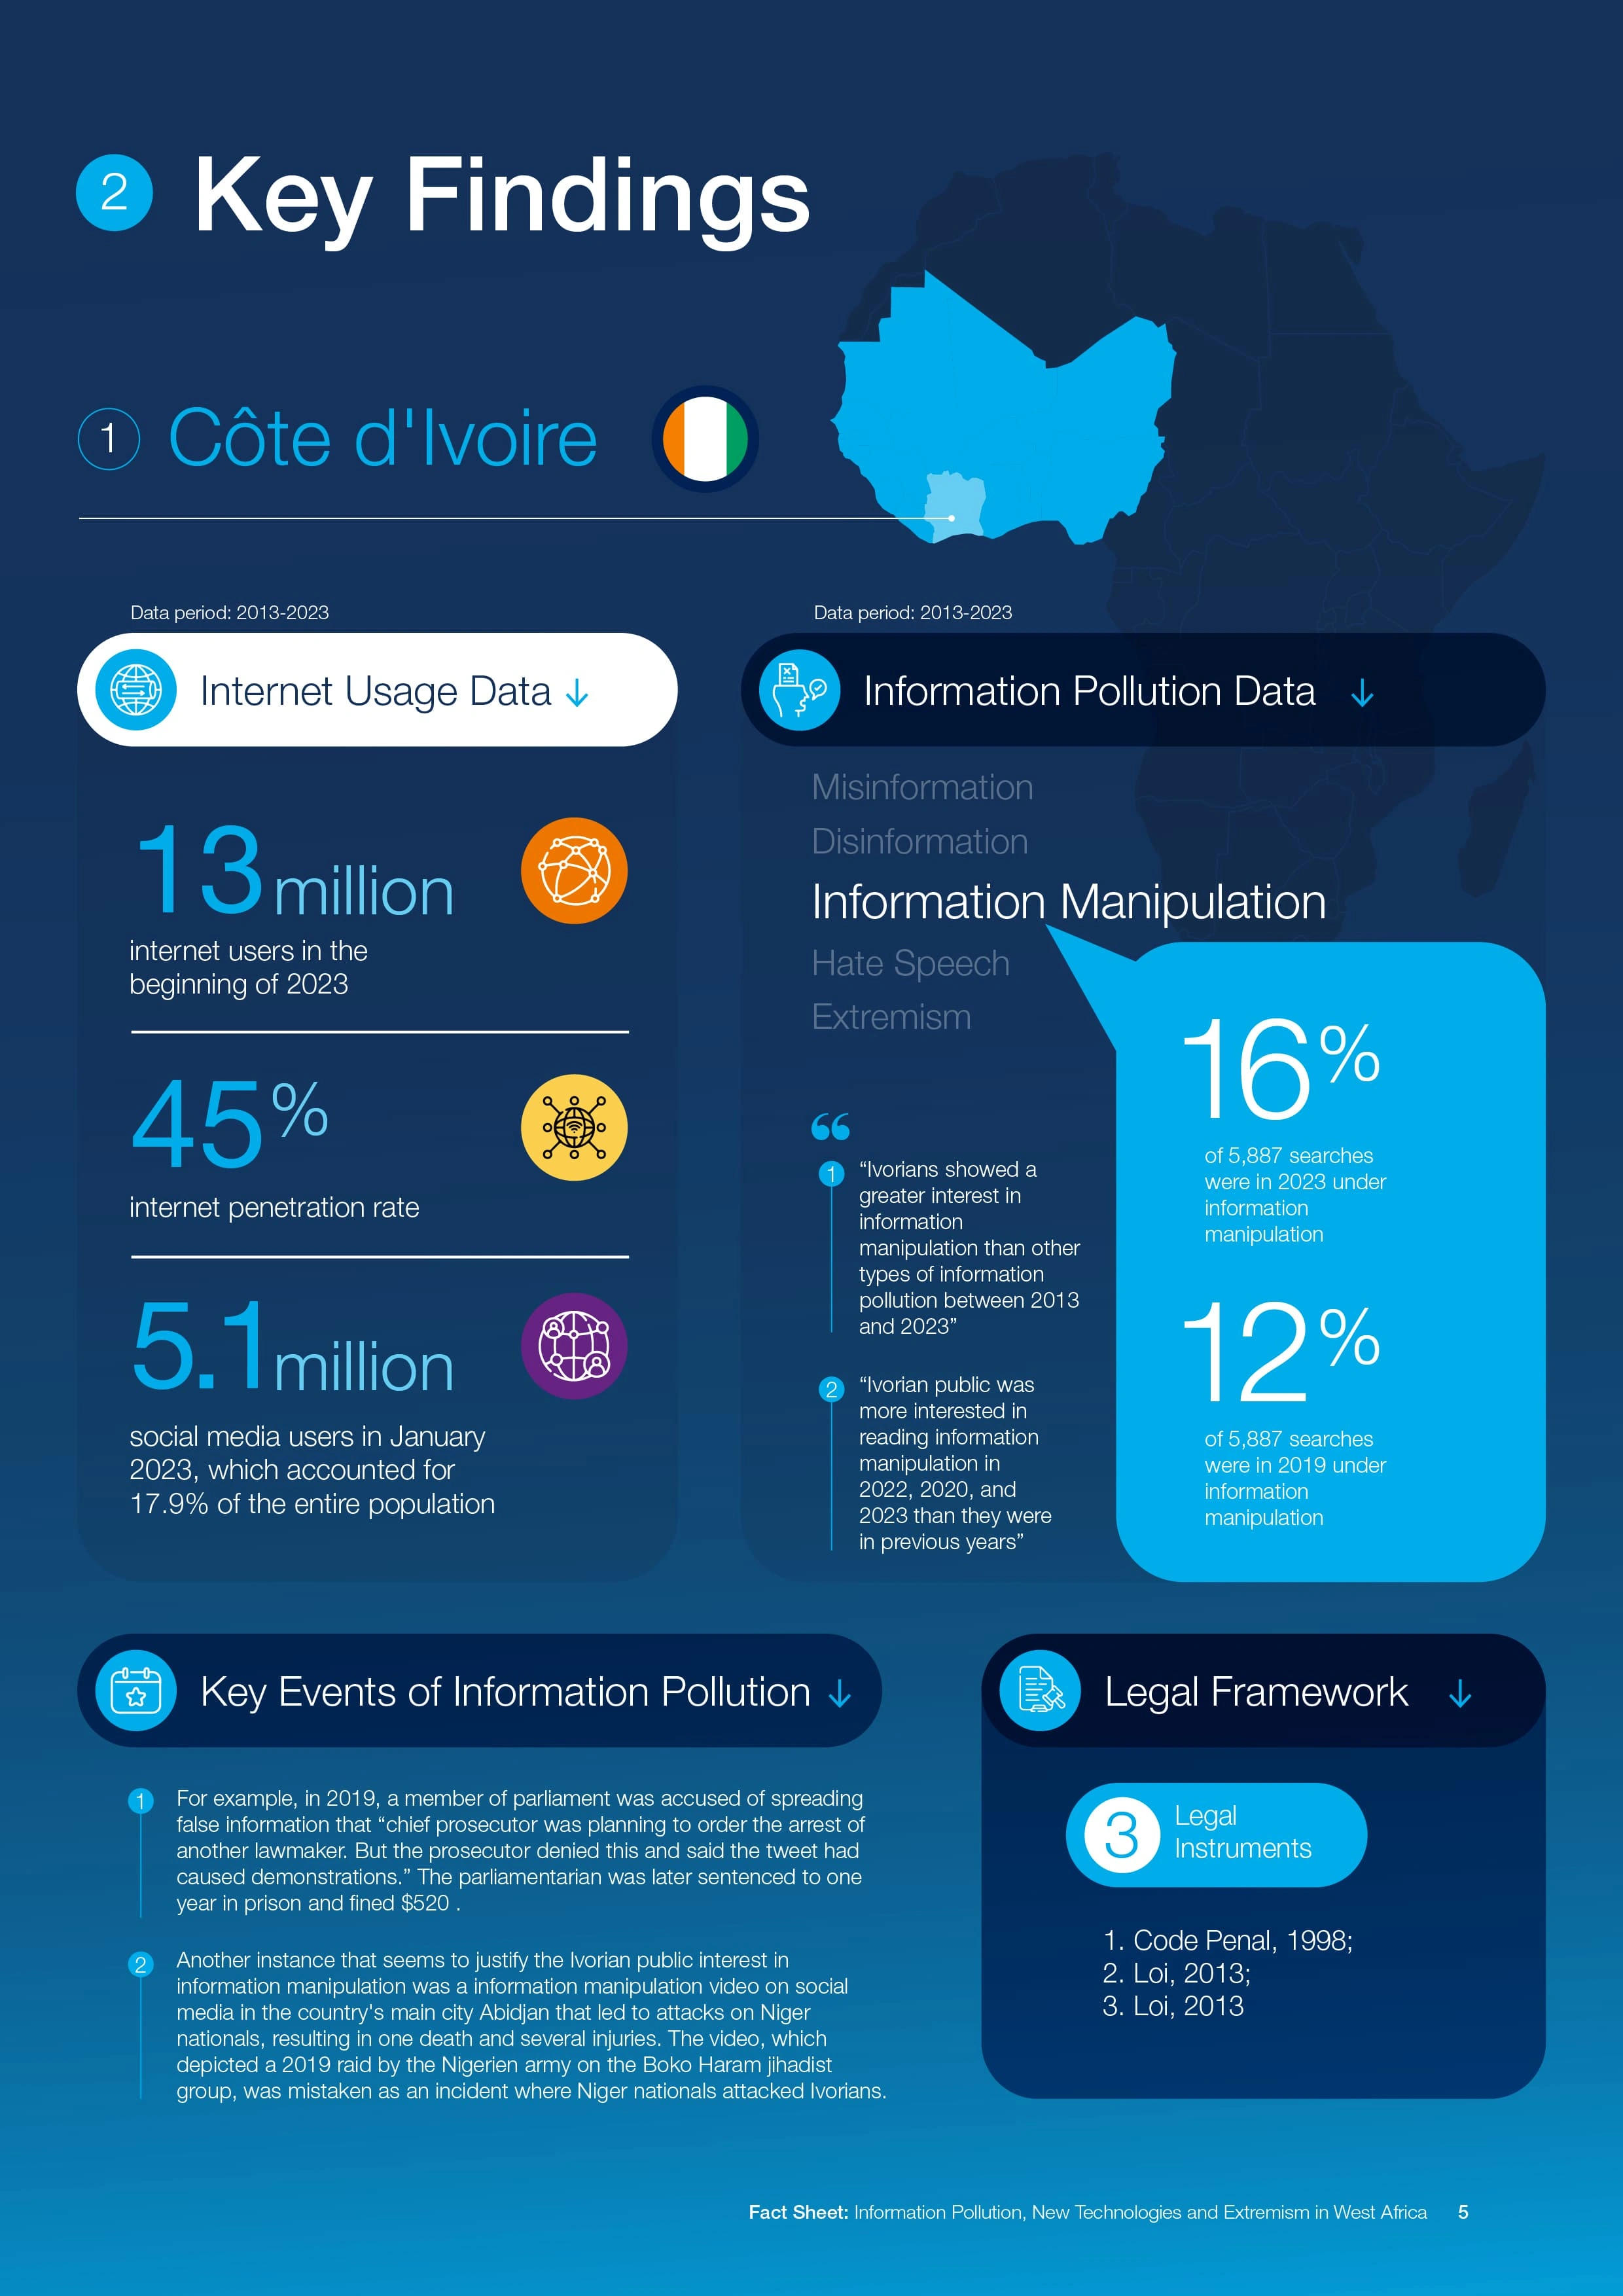
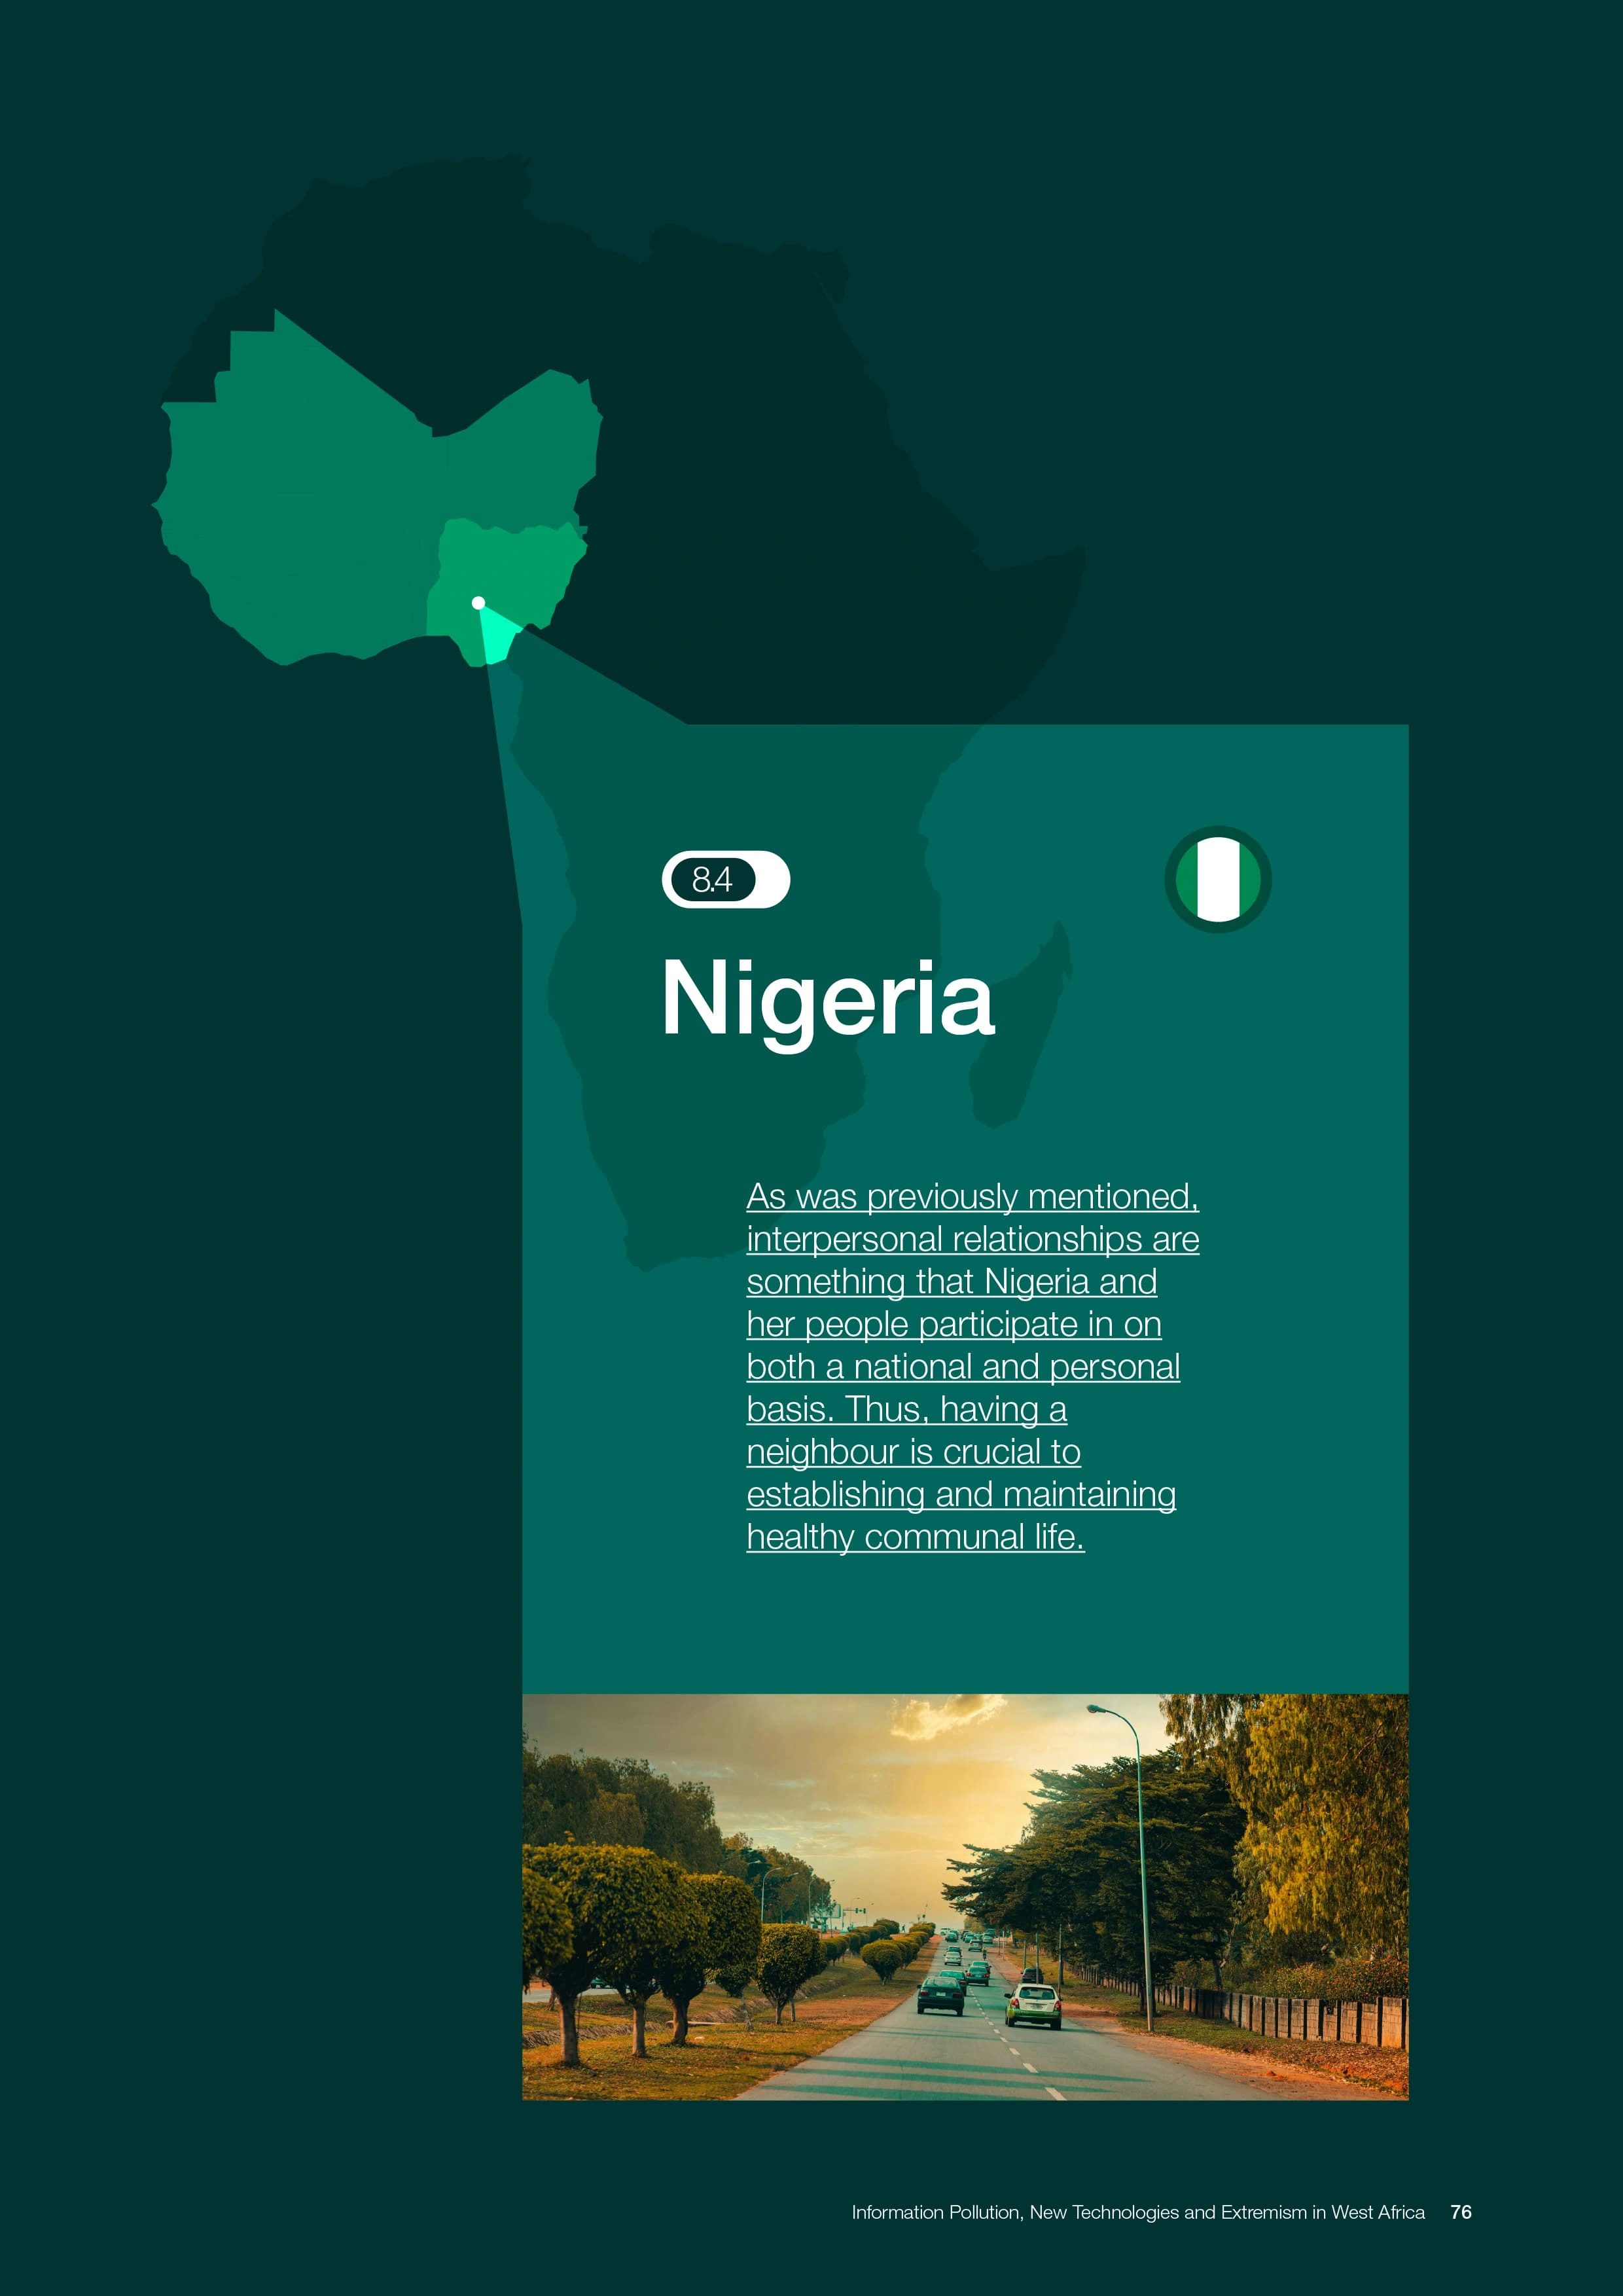
I was contracted to design a comprehensive report addressing the critical issue of information pollution in West Africa. The report examines how misinformation, disinformation, malinformation, and fake news contribute to complex challenges in the Lake Chad region, impacting public health, security, and democratic processes. With the rise of social media and AI-driven technologies, the spread of harmful content has become easier, leading to increased hate speech, violent extremism, and insecurity across borders.
Mockup of Final Report

✨ My Role
In collaboration with the Department of State, BECERA, and Brain Builders Youth Development Initiatives, I took on a pivotal role in designing a visually compelling report that effectively communicates the findings and recommendations to diverse audiences. I focused on creating infographics, charts, and visual elements that highlight key insights from the research, aimed at strengthening responses to information pollution in the region. Additionally, I developed policy briefs and fact sheets to provide concise, actionable insights for policymakers and stakeholders.
✨ My Work
Over the course of this project, I delivered a suite of digital and print materials that brought complex research findings to life. Through a blend of data visualization and strategic design, my work equipped clients with impactful tools for advocacy, awareness, and policy development. The designed assets facilitated evidence-based dialogues among academic institutions, media, and think tanks, and guided stakeholders in crafting targeted intervention strategies against information pollution in West Africa. The report’s success in sparking conversations and aligning stakeholders underscored the effectiveness of my design in amplifying critical messages across the region.
Like this project
Posted Sep 22, 2024
Crafted a cohesive 50-page publication for META, blending editorial finesse with stunning graphics and custom infographics. Delivered in both print and digital.