Customer Retention & Revenue Stability Analysis

Taofeek Salami

Customer Retention & Revenue Stability Analysis
Executive Summary
This project analyses customer retention patterns and revenue stability for a UK-based e-commerce retailer using transactional data from 2010 to 2011. The cleaned dataset comprises 166,381 transactions across 2,997 unique customers spanning 33 countries. While revenue increased approximately 8x year-over-year, growth was primarily acquisition-driven and accompanied by substantial volatility. Key structural risks identified include a 78.60% coefficient of variation in monthly revenue and an 84.42% revenue concentration in the United Kingdom, indicating limited geographic diversification.
Performance Snapshot
Metric Value Total Revenue £3,865,463.08 Total Customers 2,997 Total Transactions 166,381 Avg Monthly Revenue £175,702.87 Avg Retention Rate 21.27% Revenue Volatility (Coefficient of Variation) 78.60% UK Revenue Share 84.42% Analysis Period Jan 2010 — Dec 2011 (22 active months)
The business experienced rapid growth but exhibited high volatility, low retention, and significant geographic concentration risk.
Objective
To analyse customer retention dynamics, revenue stability, and geographic concentration exposure for a UK-based e-commerce retailer over a 22-month period. The objective is to assess whether observed growth was structurally sustainable or primarily acquisition-driven, identify key operational and market risks, and translate findings into data-backed strategic recommendations using a structured Excel-based analytical workflow.
Business Context
E-commerce businesses heavily concentrated in a single dominant market face elevated structural risk, particularly when revenue growth is driven primarily by new customer acquisition rather than repeat purchasing. For a retailer generating £3.86M across 166,381 transactions, assessing revenue stability and customer concentration is essential for sustainable scaling. This analysis equips business owners, commercial leaders, and investors with quantitative insight to inform retention strategy, geographic diversification, and revenue forecasting decisions.
Business Questions
This analysis was structured around five core business questions:
Is observed revenue growth structurally sustainable, or primarily driven by continuous new customer acquisition?
How stable is monthly revenue performance, and what does observed volatility imply for forecasting reliability?
Is the customer base demonstrating strengthening loyalty, or does churn remain the dominant behavioural pattern?
How concentrated is revenue across geographic markets, and what systemic exposure does this create?
Are there data anomalies or outliers that materially distort retention or revenue metrics?
Analysis Approach
The analysis was conducted entirely in Microsoft Excel using a structured 10-phase workflow. Raw transactional data was imported and transformed via Power Query, followed by systematic cleaning to remove duplicates, null values, returns, and date inconsistencies.
Ten core KPIs were defined across three analytical pillars: Customer, Revenue, and Risk. Metrics were computed using PivotTables, structured table formulas, and helper columns to ensure traceability and reproducibility.
Retention was calculated using a month-over-month methodology based on active customer counts. Revenue stability was evaluated through growth rate tracking, standard deviation, and coefficient of variation analysis. Geographic concentration exposure was quantified by segmenting revenue and customer distribution by country and applying a structured risk classification.
All results were consolidated into an executive dashboard and synthesised into five structured business insights addressing growth sustainability, retention dynamics, customer composition, market concentration, and anomaly detection.
Key Findings
Revenue grew approximately 8x year-over-year — from an average of £36K per month in 2010 to £292K in 2011 — but a coefficient of variation of 78.60% confirms the growth was highly unstable, with monthly revenue fluctuating between £17K and £421K.
Average retention rate of 21.27% (excluding the January 2011 anomaly) indicates growth was largely acquisition-driven. The implied churn rate of approximately 78.73% suggests most customers did not return after their initial purchase.
Returning customers grew 40–50x — from 1–3 per month in early 2010 to 88–108 per month by late 2011 — representing approximately 45% of active customers by November 2011, indicating early signs of loyalty development.
84.42% of total revenue and 90.52% of customers are concentrated in the United Kingdom. The second-largest market, EIRE, contributes only 2.52%, confirming extreme single-market dependency with no meaningful secondary market presence.
January 2011 recorded an anomalous retention rate of 186.29% — a mathematical impossibility driven by a sudden customer surge from 19 to 221 active customers. This outlier was excluded from all retention calculations to preserve analytical accuracy.
Business Implications
High revenue volatility limits forecasting reliability and complicates cash flow planning, inventory management, and staffing allocation. Historical monthly performance alone cannot support predictable operational decision-making.
An acquisition-driven growth model is financially demanding. Replacing churned customers through continuous acquisition increases marketing expenditure without compounding lifetime value from a loyal customer base.
The rapid increase in returning customers during 2011 indicates emerging product-market resonance. However, without deliberate retention investment, this momentum may not translate into sustainable long-term revenue stability.
Heavy dependence on the UK market introduces systemic exposure. Adverse regulatory, economic, or competitive shifts within the UK could materially impact overall performance, given the absence of meaningful geographic diversification.
The January 2011 anomaly underscores the importance of robust data validation processes. Undetected metric distortions could result in flawed strategic decisions, particularly in areas such as retention budgeting and loyalty programme investment.
Recommendations
Prioritise retention infrastructure investment.
Implement structured post-purchase follow-ups, loyalty programmes, and personalised re-engagement campaigns to convert first-time buyers into repeat customers. Strengthening retention reduces reliance on continuous acquisition and improves revenue predictability.
Validate seasonality patterns.
Investigate the September 2011 £421K revenue peak to determine whether it reflects recurring seasonality, promotional activity, or one-off external factors. If repeatable patterns are confirmed, align inventory planning and marketing allocation accordingly.
Consolidate retention momentum.
Returning customers accounted for approximately 45% of active customers by November 2011. This upward trajectory should be reinforced through deliberate loyalty investment before growth normalises or reverses.
Gradually diversify geographic exposure.
Increase strategic focus on existing secondary markets such as Germany, the Netherlands, and France, which collectively contribute approximately 7% of revenue. Controlled expansion within known markets offers a lower-risk pathway toward diversification.
Strengthen reporting governance.
Implement automated anomaly detection and validation checks within reporting workflows to prevent metric distortion, ensuring that strategic decisions are based on reliable data.
Strategic Outlook
The business enters 2012 with strong headline growth but notable structural vulnerabilities. Revenue volatility, acquisition dependency, and geographic concentration create compounded exposure that may constrain long-term scalability if left unaddressed.
The improving retention trajectory observed throughout 2011 is a positive signal, but early loyalty momentum remains fragile. The opportunity to transition from acquisition-led expansion to a retention-driven revenue model is present, yet requires deliberate and sustained investment in customer experience, post-purchase engagement, and retention analytics.
Geographic diversification represents a medium-term strategic priority. Heavy reliance on the UK market exposes the business to single-market shocks without a meaningful revenue buffer. Incremental expansion within established secondary markets provides a structured path toward greater resilience.
From a data governance perspective, the January 2011 anomaly underscores the importance of scalable reporting infrastructure. As retention and revenue metrics become central to strategic planning, decision-making must be supported by validated and systematically monitored data processes.
Process
I followed a structured 10-phase analytical workflow to ensure data integrity and reproducibility.
Phase 1 — Data Import & Transformation (Power Query)
Action: Imported CSV via Power Query. Deleted auto-generated Changed Type step and manually set data types — InvoiceNo, StockCode, Description, CustomerID and Country as Text, Quantity as Whole Number, InvoiceDate as Date/Time, UnitPrice as Decimal Number.
Columns Renamed: Invoice_No, Stock_Code, Unit_Price, Invoice_Date, Customer_ID for consistency.
Calculated Columns Added: Year, Month and YearMonth from Invoice_Date. Revenue as Quantity × Unit_Price.
Result: Closed and loaded into Excel as a table named Raw_Data with a clean, refreshable Power Query connection.
Phase 2 — Data Cleaning & Validation
Setup: Copied Raw_Data to Cleaned_Data sheet (table: tbl_Cleaned).
Duplicates: Identified and removed 5,269 duplicate rows.
Revenue Validation: Used
=ROUND([@[Quantity]]*[@[Unit_Price]],2)=[@[Revenue]] — FALSE rows identified as return/cancellation entries and floating point rounding differences (0.001), not real errors.Missing Data: COUNTBLANK checks found 135,037 blank Customer_IDs and 305,984 blank Invoice_Dates — all deleted.
Returns Removed: Flagged and deleted 4,111 negative Quantity rows using
=IF([@[Quantity]]<0,"Return","Sale").Customer_Type Flag: Added First_Purchase_Date using
TEXT(MINIFS()) with INT() to strip time component, converted via DATEVALUE, pasted as values. Customer_Type derived as =IF(INT([@[Invoice_Date]])=[@[First_Purchase_Date]],"New","Returning").Final Count: 166,381 clean, validated rows.
Phase 3 — KPI Design & PivotTable Setup
KPIs Defined: 10 core KPIs across three pillars — Customer, Revenue and Risk.
PivotTables Built:
PT_Active_Customers — Active Customers per Month using Customer_Count SUM, Grand Total renamed to Unique Customers.
PT_New_vs_Returning — New vs Returning Customers per Month with Customer_Type as column, Grand Totals removed.
PT_Monthly_Revenue — Monthly Revenue SUM formatted as £ currency, Grand Total renamed to Total Revenue (£).
Mac Excel Workaround: Distinct Count unavailable — resolved using a Customer_Count helper column (
1/COUNTIF) in tbl_Cleaned.Result: Total unique customers: 2,997. Total Revenue: £3,865,463.08.
Phase 4 — Retention Calculation
Setup: Created Retention_Calc sheet with a structured table (tbl_Retention) referencing PT_Active_Customers and PT_New_vs_Returning directly — links kept live for auto-refresh.
Columns: Month, Active_Customers, New_Customers, Returning_Customers, Retention_Rate (Returning Month n / Active Month n-1), Churn_Rate (1 − Retention_Rate).
Anomaly Handling: January 2011 produced a 186.29% retention rate due to a customer jump from 19 (Dec 2010) to 221 (Jan 2011) — excluded from averages using
AVERAGEIF(tbl_Retention[Retention_Rate],"<1").Result: Average Retention Rate = 21.27% across 21 valid months. Anomaly flagged for Phase 8 insight.
Phase 5 — Revenue Stability Analysis
Setup: Created Revenue_Stability sheet with table tbl_Revenue_Stability.
Columns: Month, Monthly_Revenue, Prev_Monthly_Revenue, Revenue_Growth_Pct as (Current − Previous) / Previous, Cumulative_Revenue as running total using
SUM($B$2:B2).Customer Revenue: New_Customers and Returning_Customers pulled via
ROUND(IFERROR(XLOOKUP())) from tbl_Retention. Rev_Per_New_Customer and Rev_Per_Returning_Customer calculated — N/A returned for months with zero returning customers.Summary Statistics: Mean Monthly Revenue = £175,702.87. Revenue Volatility (Std Dev) = £138,095.97. Coefficient of Variation (CV) = 78.60% — indicating extremely high revenue volatility.
Year Comparison: 2010 average monthly revenue £36,124.71 vs 2011 average £292,017.99 — confirming approximately 8x year-over-year growth.
Phase 6 — Segment & Geographic Risk Analysis
Setup: Created Segment_Risk sheet with table tbl_Segment_Risk. Country used as segment — Description column had 4,070 unique values, too granular for meaningful risk classification.
Data Sources: PT_Revenue_By_Country and PT_Customer_By_Country PivotTables built in Pivot_Tables sheet.
Columns: Country, Revenue, Revenue_Contribution_Pct, Customer_Count, Customer_Contribution_Pct, Risk_Flag using IFS formula — High (≥50%), Medium (10–49%), Low (<10%).
Key Finding: UK = 84.42% revenue and 90.52% customers — only High risk flag. No Medium range countries — concentration drops directly from 84.42% (UK) to 2.52% (EIRE). Extreme single-market dependency confirmed.
Dashboard Prep: tbl_Top5_Countries created — Top 5 countries by revenue plus All Others row (£236,141.88 / 6.11%) — used as data source for Dashboard country chart to replace cluttered 33-country visual.
Phase 7 — Dashboard Development
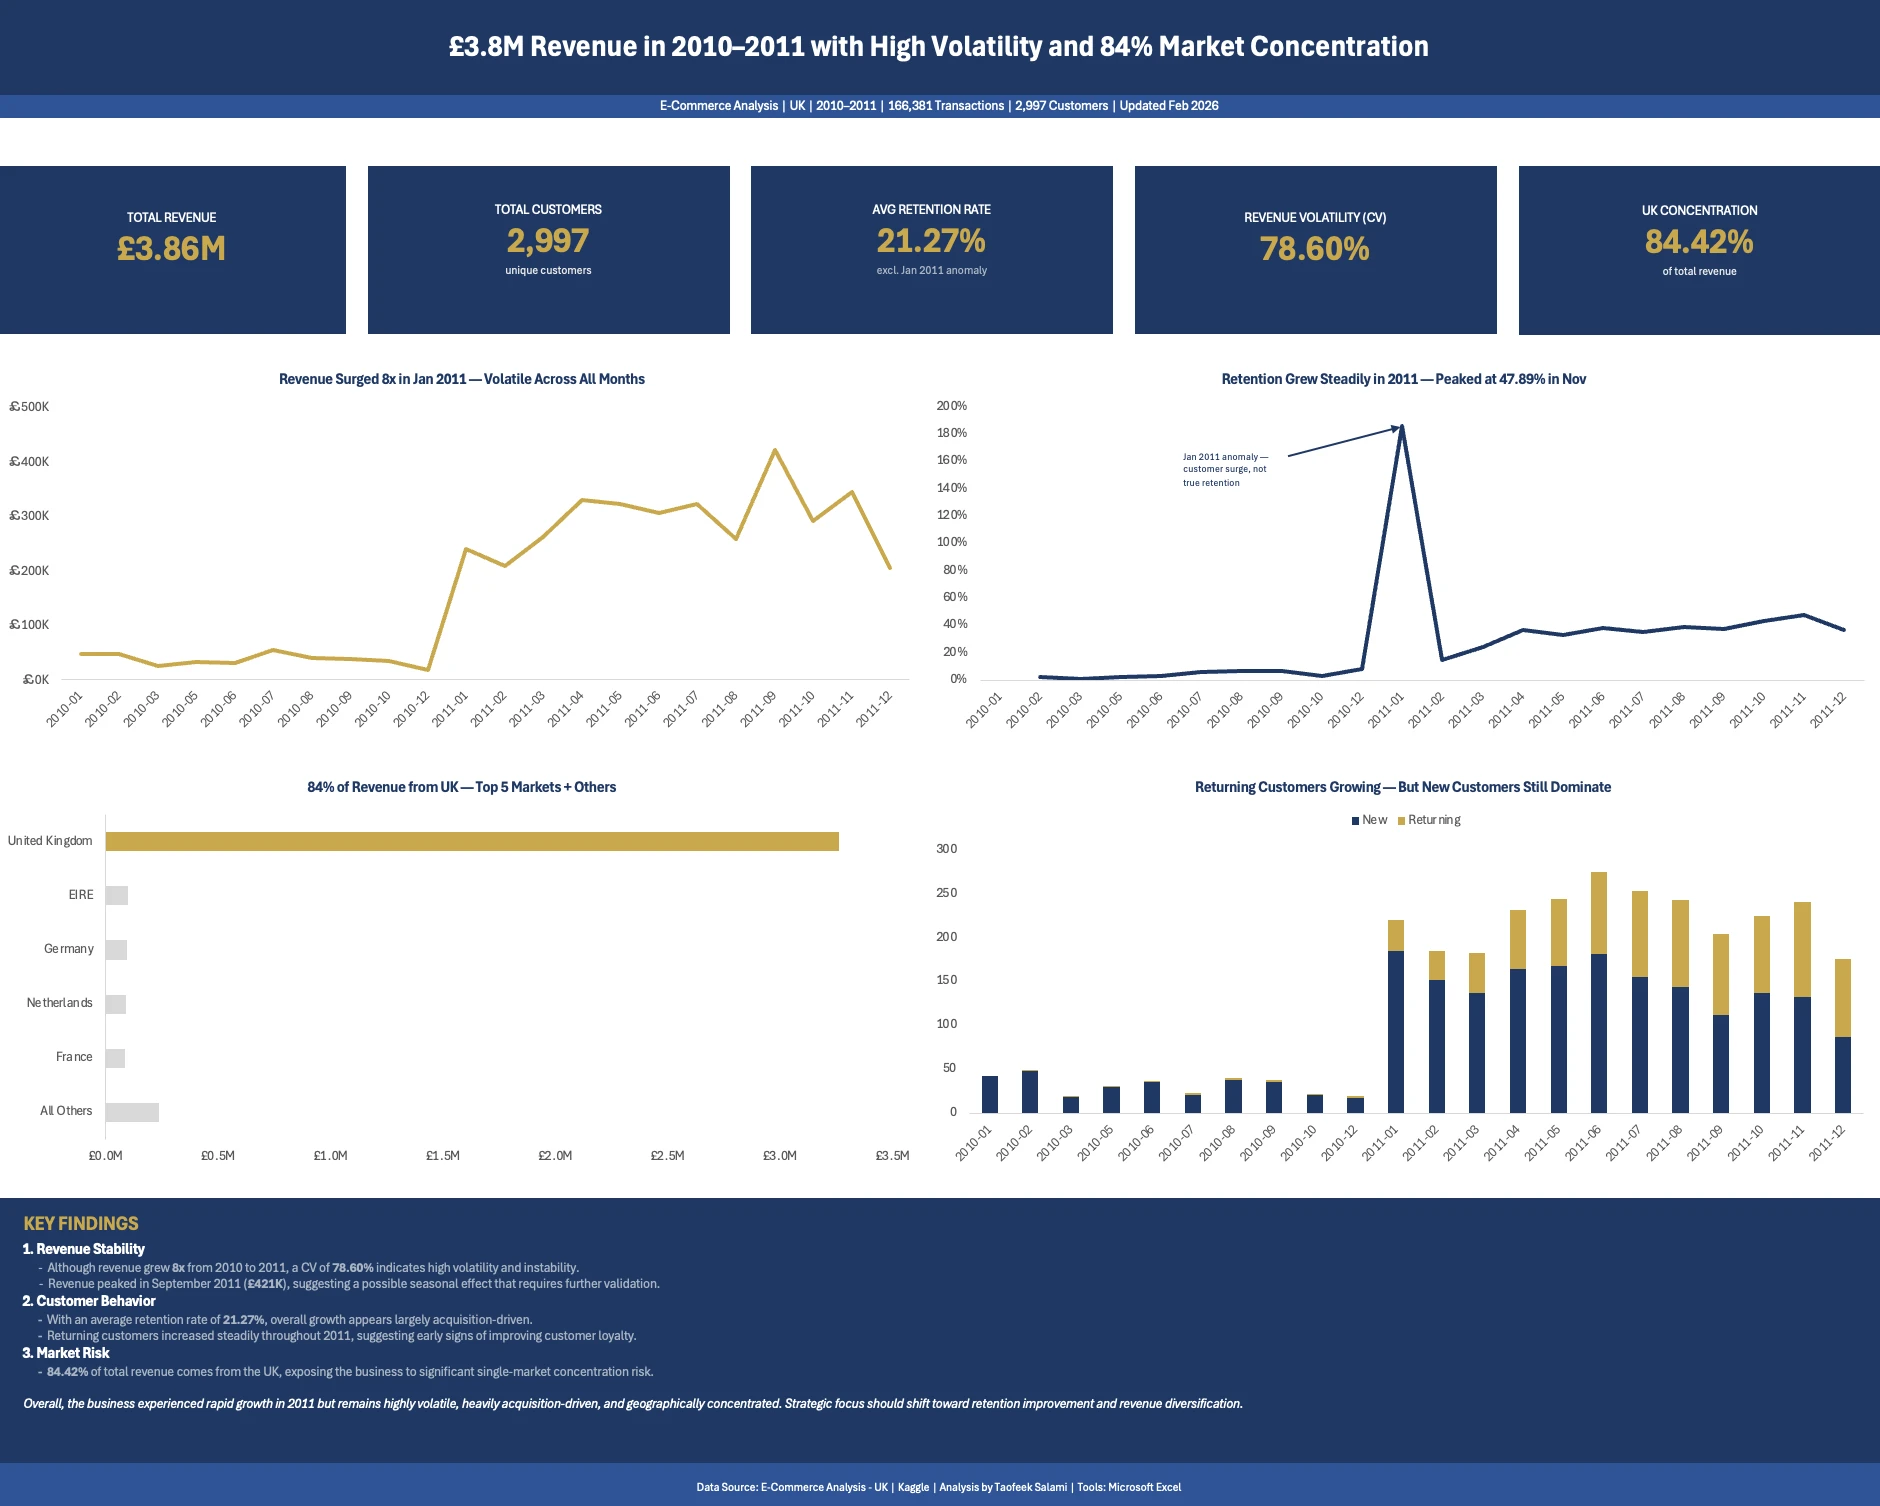
Header: Title shape (Dark Navy, 20pt Bold White) — "£3.8M Revenue in 2010–2011 with High Volatility and 84% Market Concentration". Subtitle shape (Medium Navy, 9pt) — dataset context and updated date.
KPI Cards (×5): Dark Navy background, Gold numbers, Muted Blue-Grey context labels — Total Revenue £3.86M, Total Customers 2,997, Avg Retention Rate 21.27%, Revenue Volatility CV 78.60%, UK Concentration 84.42%.
Charts (×4):
Monthly Revenue Line Chart — Gold, columns A–H.
Retention Rate Line Chart — Navy, columns I–P, with Jan 2011 anomaly annotation.
Revenue by Country Horizontal Bar — Top 5 + All Others, UK bar Gold, others Light Grey, columns A–H.
New vs Returning Stacked Column — Navy/Gold, columns I–P.
Summary Insight Box: Three-section structured findings with Gold title, White headers, Muted Blue-Grey bullets and White italic conclusion. Footer directly below.
Design System: Gold = Revenue metrics. Navy = Customer/Retention metrics. Gridlines removed throughout.
Phase 8 — Business Insights & Recommendations
Five structured insights written, each covering observation, business implication and strategic recommendation:
Revenue Growth & Volatility — 8x growth confirmed but CV of 78.60% signals structural instability.
Customer Retention — 21.27% average retention rate and 78.73% churn rate confirm acquisition-driven growth model.
New vs Returning Behaviour — Returning customers grew 40–50x through 2011, signalling early loyalty momentum.
Market Concentration Risk — 84.42% UK revenue dependency confirmed as extreme single-market exposure.
January 2011 Anomaly — 186.29% retention outlier identified, isolated and excluded from all average calculations.
Analytical Note: Rev_Per_Customer calculation limitation documented — divides total monthly revenue by customer count and does not isolate revenue by customer type at transaction level.
Phase 9 — README & Documentation
README Written: Full project documentation covering Executive Summary, Performance Snapshot, Objective, Business Context, Business Questions, Analysis Approach, Key Findings, Business Implications, Recommendations, Strategic Outlook, Process table, Methodology & Tools and Data Source.
Phase Docs: Individual markdown files created for each phase and uploaded to the
docs/ folder on GitHub.Assets: Color palette documented in
assets/color_palette.md.Phase 10 — Polish & Export
Dashboard Polish: Gridlines removed, chart titles verified, KPI cards checked, summary box and footer confirmed visible.
Workbook Polish: Sheet1 deleted, all tabs correctly named, Raw_Data and Cleaned_Data sheets hidden, Dashboard set as active sheet on open.
Screenshots: dashboard_full_view.png (75% zoom), dashboard_top.png and dashboard_bottom.png (100% zoom).
Export: Excel file (45MB) hosted on Google Drive due to GitHub 25MB upload limit — link added to README. All phase documentation uploaded to
docs/ folder, screenshots to dashboard/ folder, color palette to assets/ folder on GitHub.Download
File Link Excel Workbook Customer_Retention_Revenue_Analysis.xlsx
Methodology & Tools
Tool: Microsoft Excel (Power Query, Pivot Tables, Charts)
Techniques: Retention rate calculation, cohort logic, revenue trend analysis, segment risk analysis
Currency Note: Currency values in the dataset are in GBP (£) — British Pounds, as the majority of transactions are from the United Kingdom. No currency symbol is displayed in the raw data columns.
Data Source
Dataset: E-Commerce Analysis - UK
License: Community Data License Agreement – Sharing, Version 1.0
Attribution: Dataset sourced from Kaggle. All credit for the original data goes to the dataset publisher.
Like this project
Posted Jul 20, 2026
Analyzed customer retention and revenue stability for an e-commerce retailer using Excel.
Likes
0
Views
3
Timeline
Jan 1, 2010 - Dec 31, 2011