Airbnb Business Dashboard Development

Pisacha S

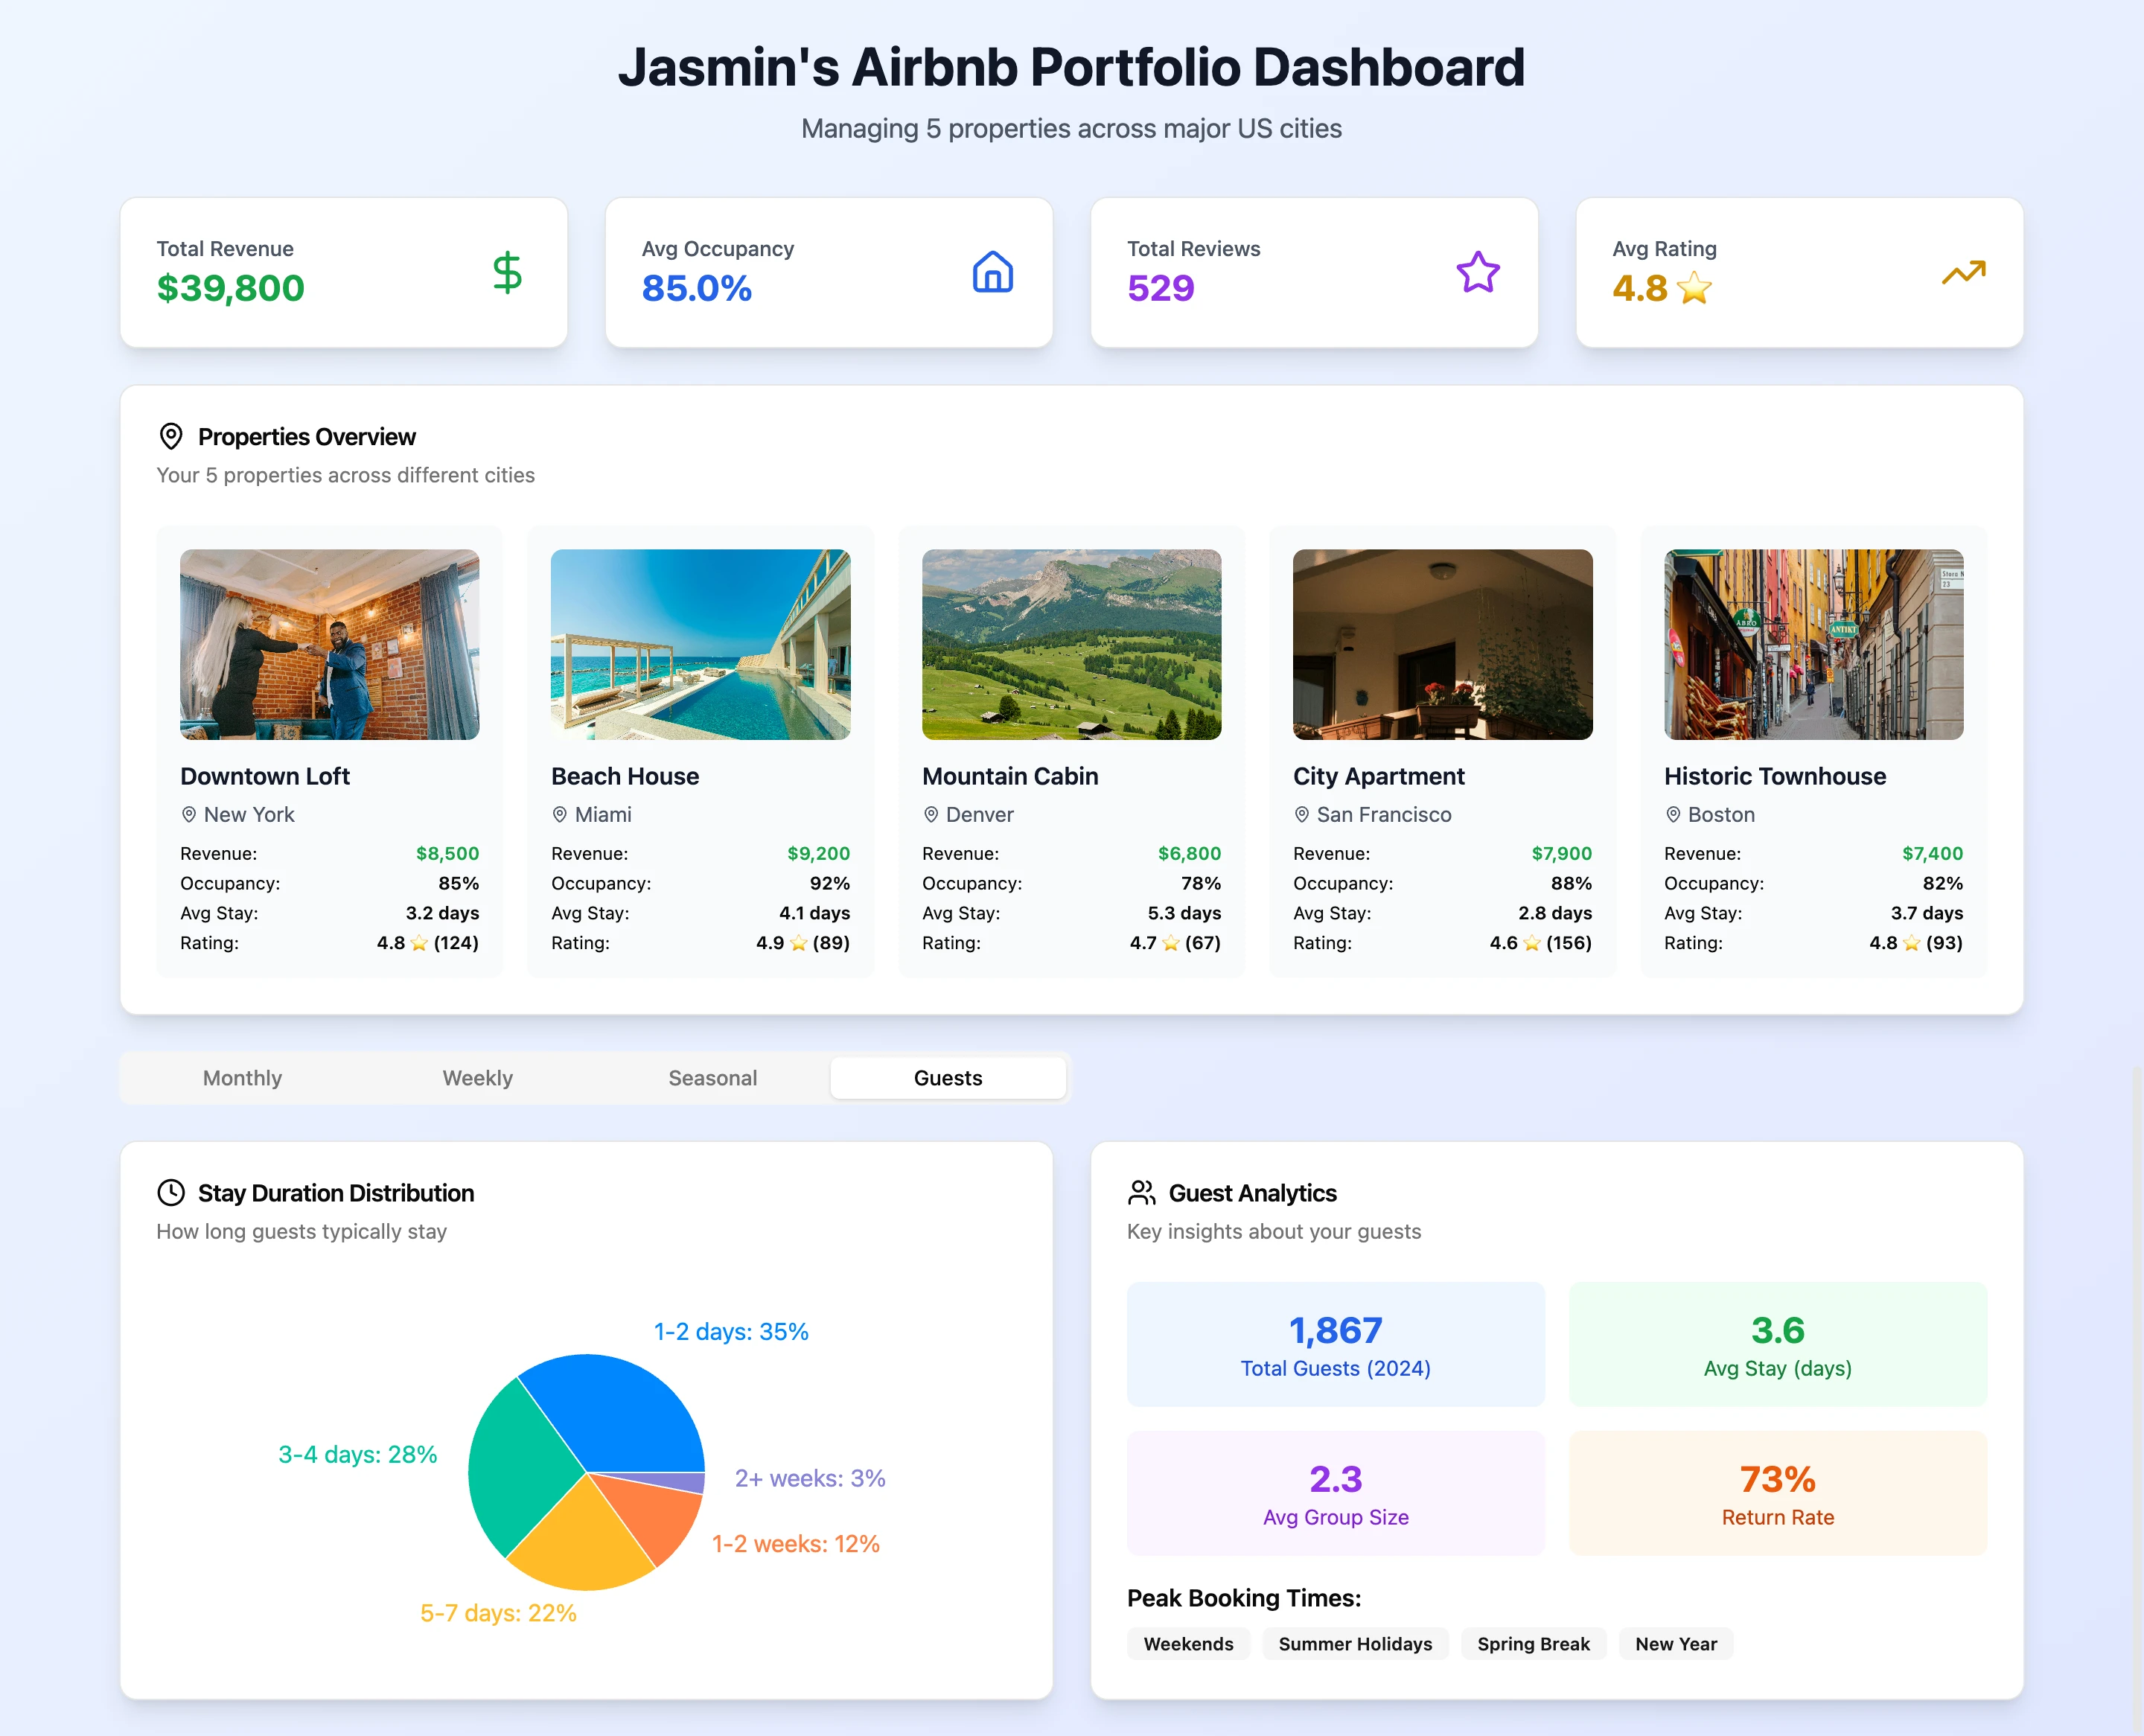
Dashboard Interface for an Airbnb business that shows properties across several cities. Based on the requirements, I need to create:
A dashboard showing properties in multiple cities (total of 5 properties)
Charts showing monthly and weekly data
Summary with holiday and seasonal information
Statistics about number of people and stay duration
Key features of the dashboard:
��🏠 Property Overview: Visual cards showing each property with images, location, ratings, revenue, and occupancy rates
📊 Multiple Chart Views:
Monthly: Revenue trends throughout the year with seasonal peaks
Weekly: Day-of-week performance showing weekend strength
Seasonal: Performance across Spring, Summer, Fall, Winter with holiday insights
Guest Analytics: Stay duration distribution and guest behavior metrics
💰 Key Metrics: Total revenue ($39,800), average occupancy (85%), ratings, and review counts
🎯 Holiday & Seasonal Insights:
Summer peak season with highest revenue
Weekend booking patterns
Seasonal trends and opportunities
👥 Guest Analytics:
Average stay duration (3.6 days)
Group size patterns (2.3 people average)
Return guest rate (73%)
Peak booking periods
Like this project
Posted Jul 1, 2025
Developed a dashboard for an Airbnb business showing properties, charts, and guest analytics.
Likes
0
Views
0


Art Space and Cafe
MyFriend - Pet's App

DANDY

Kao Naka-Web design