ISeeChange Insights Dashboard
Roberto Salodini
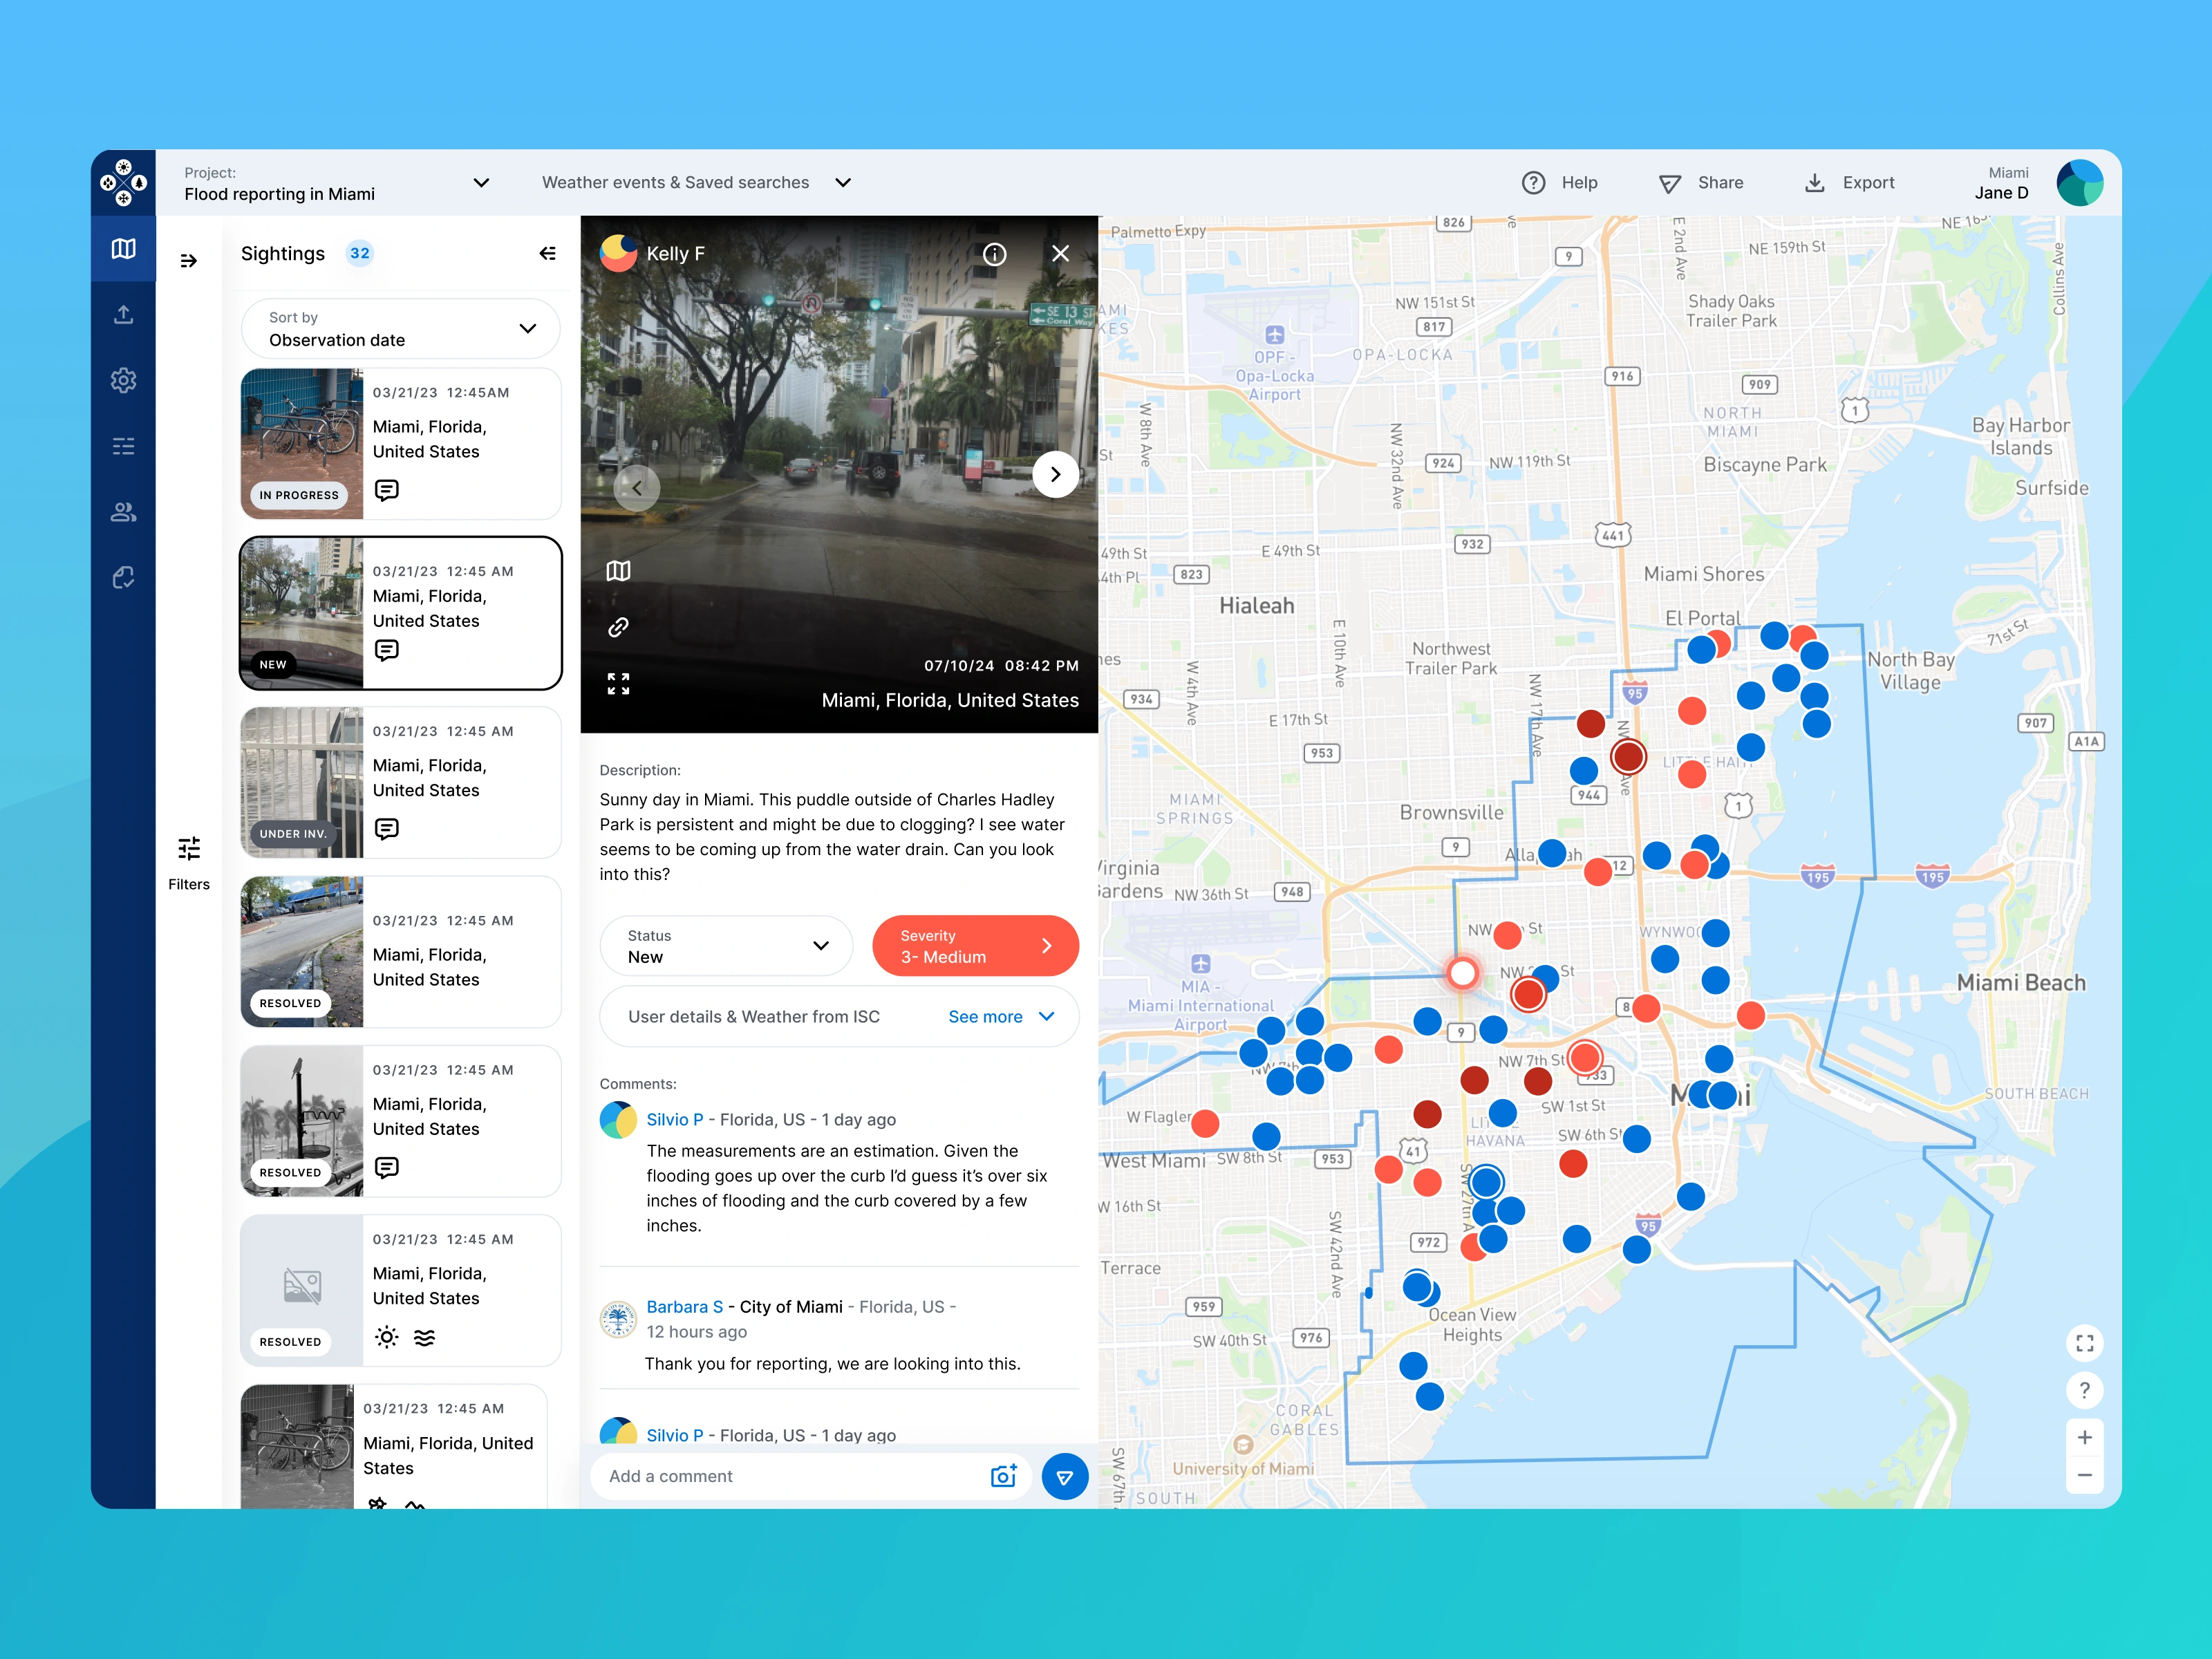
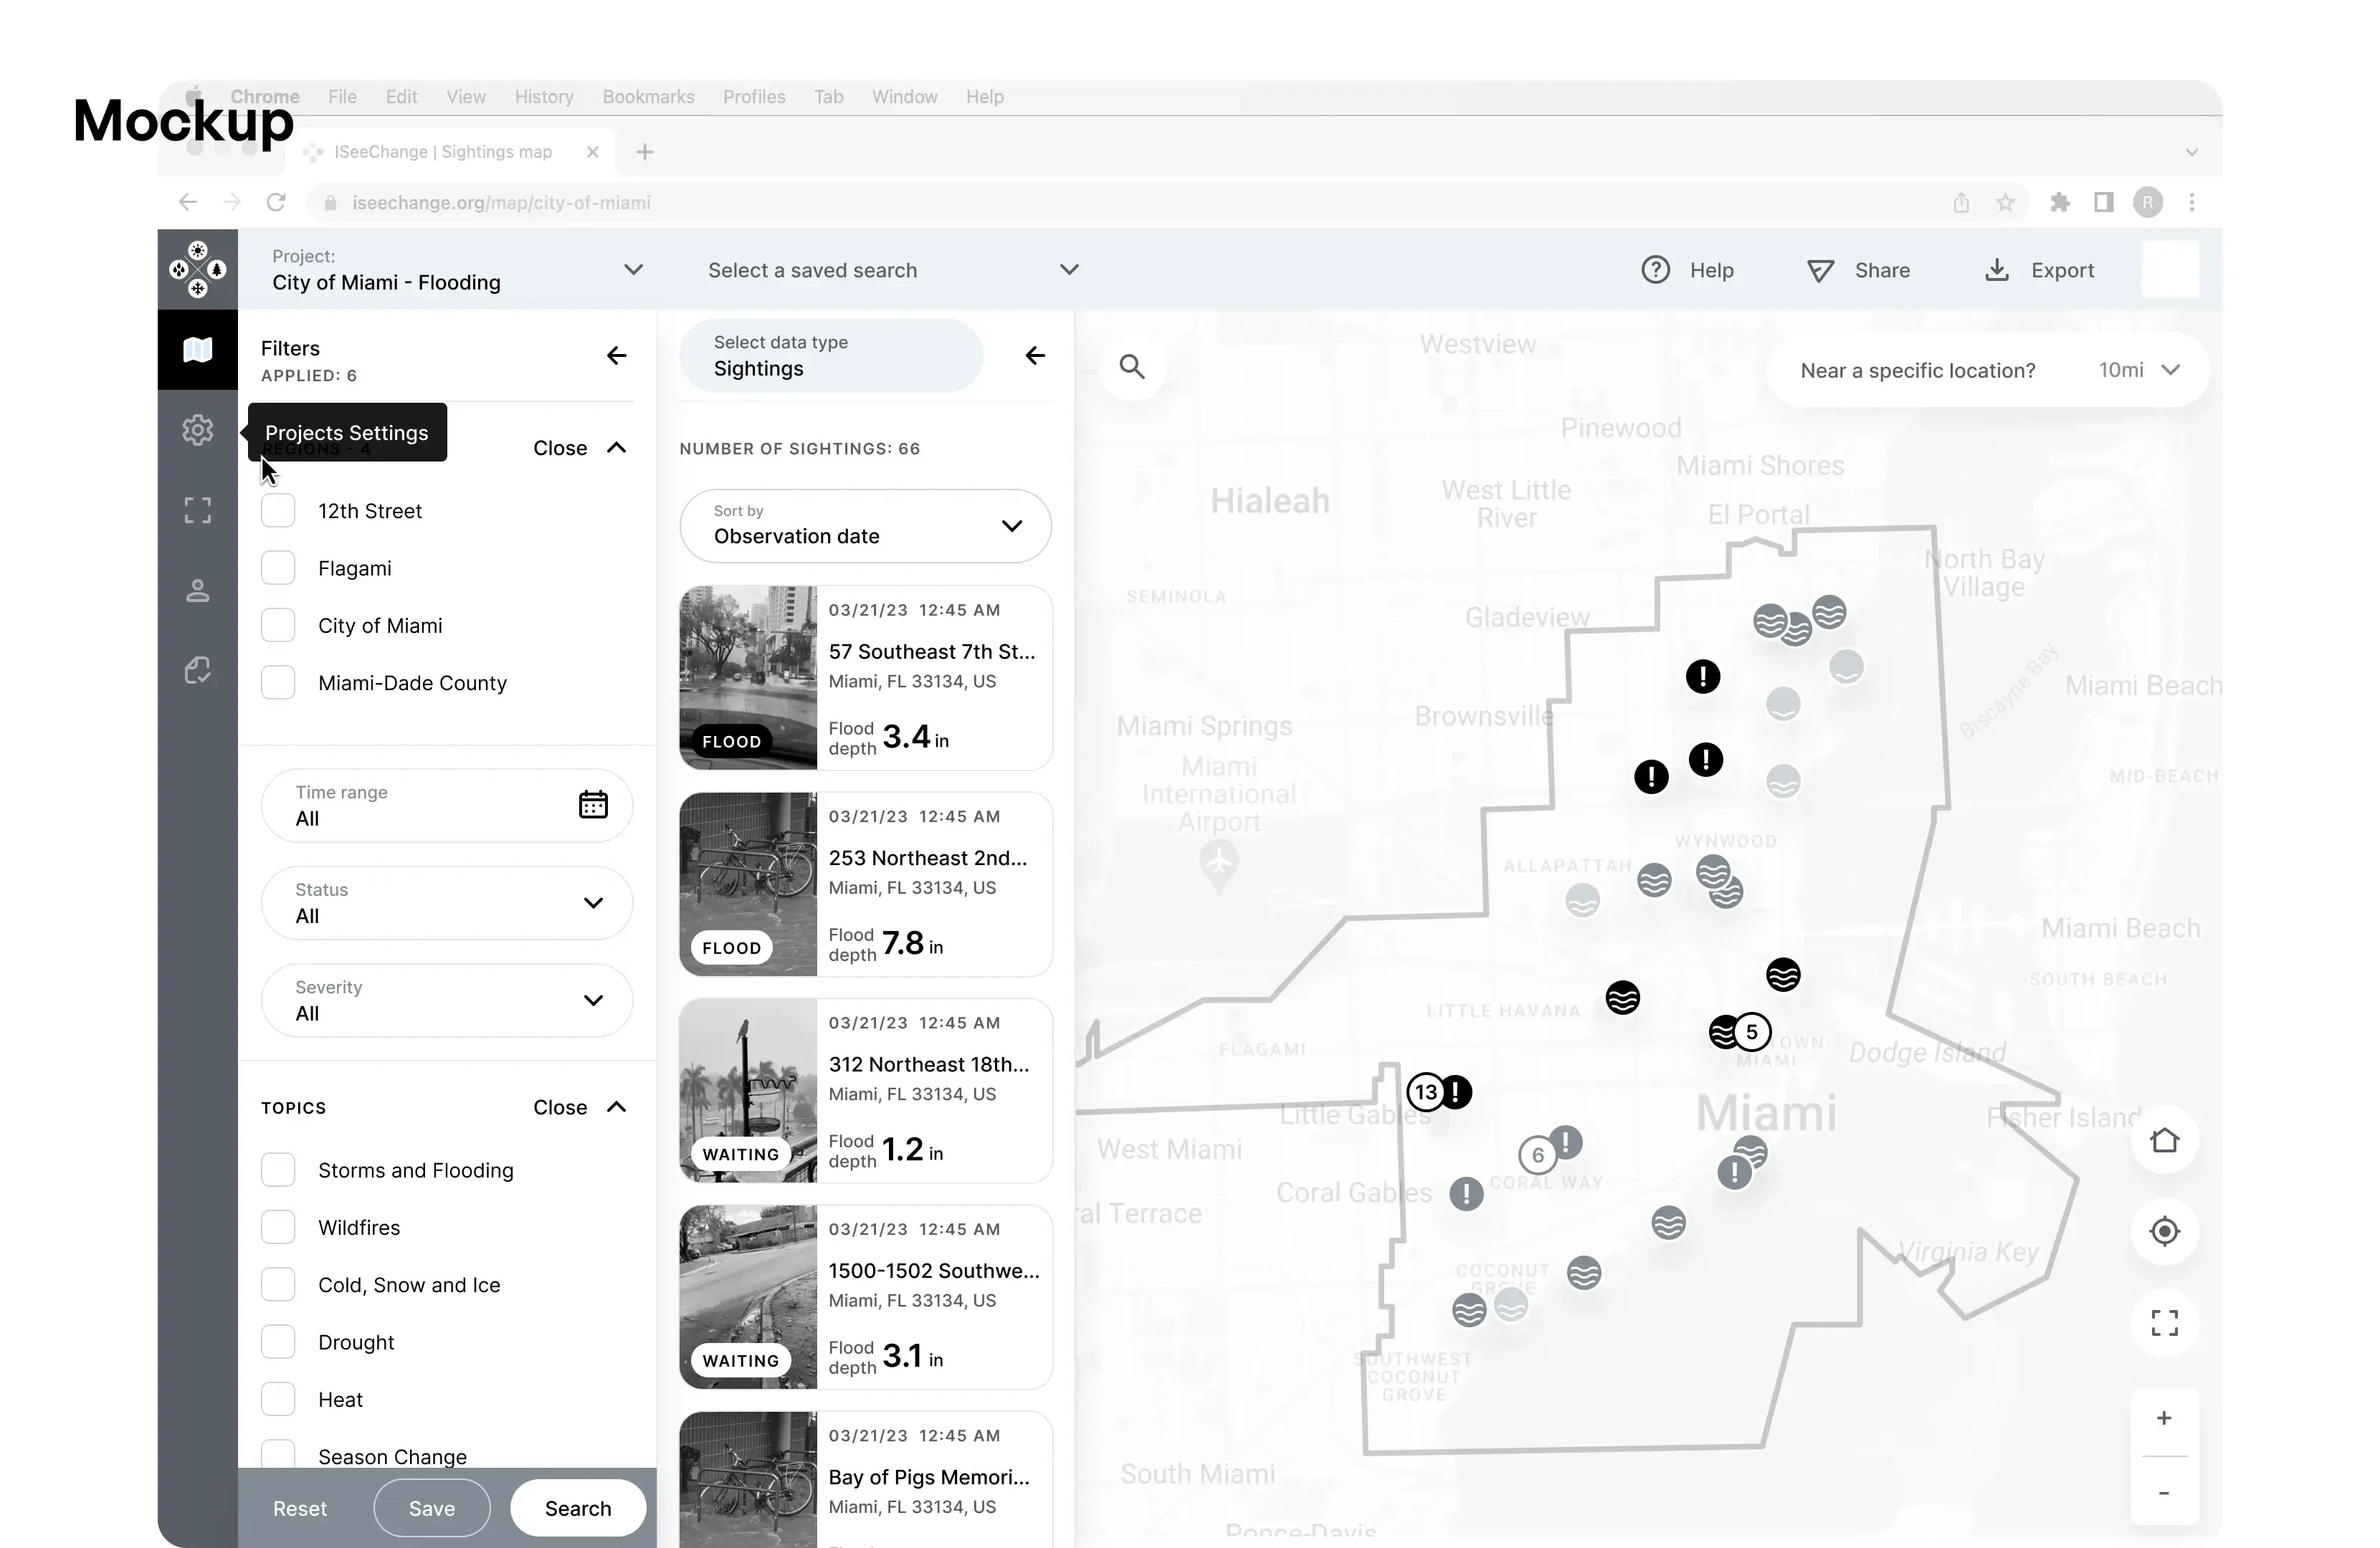
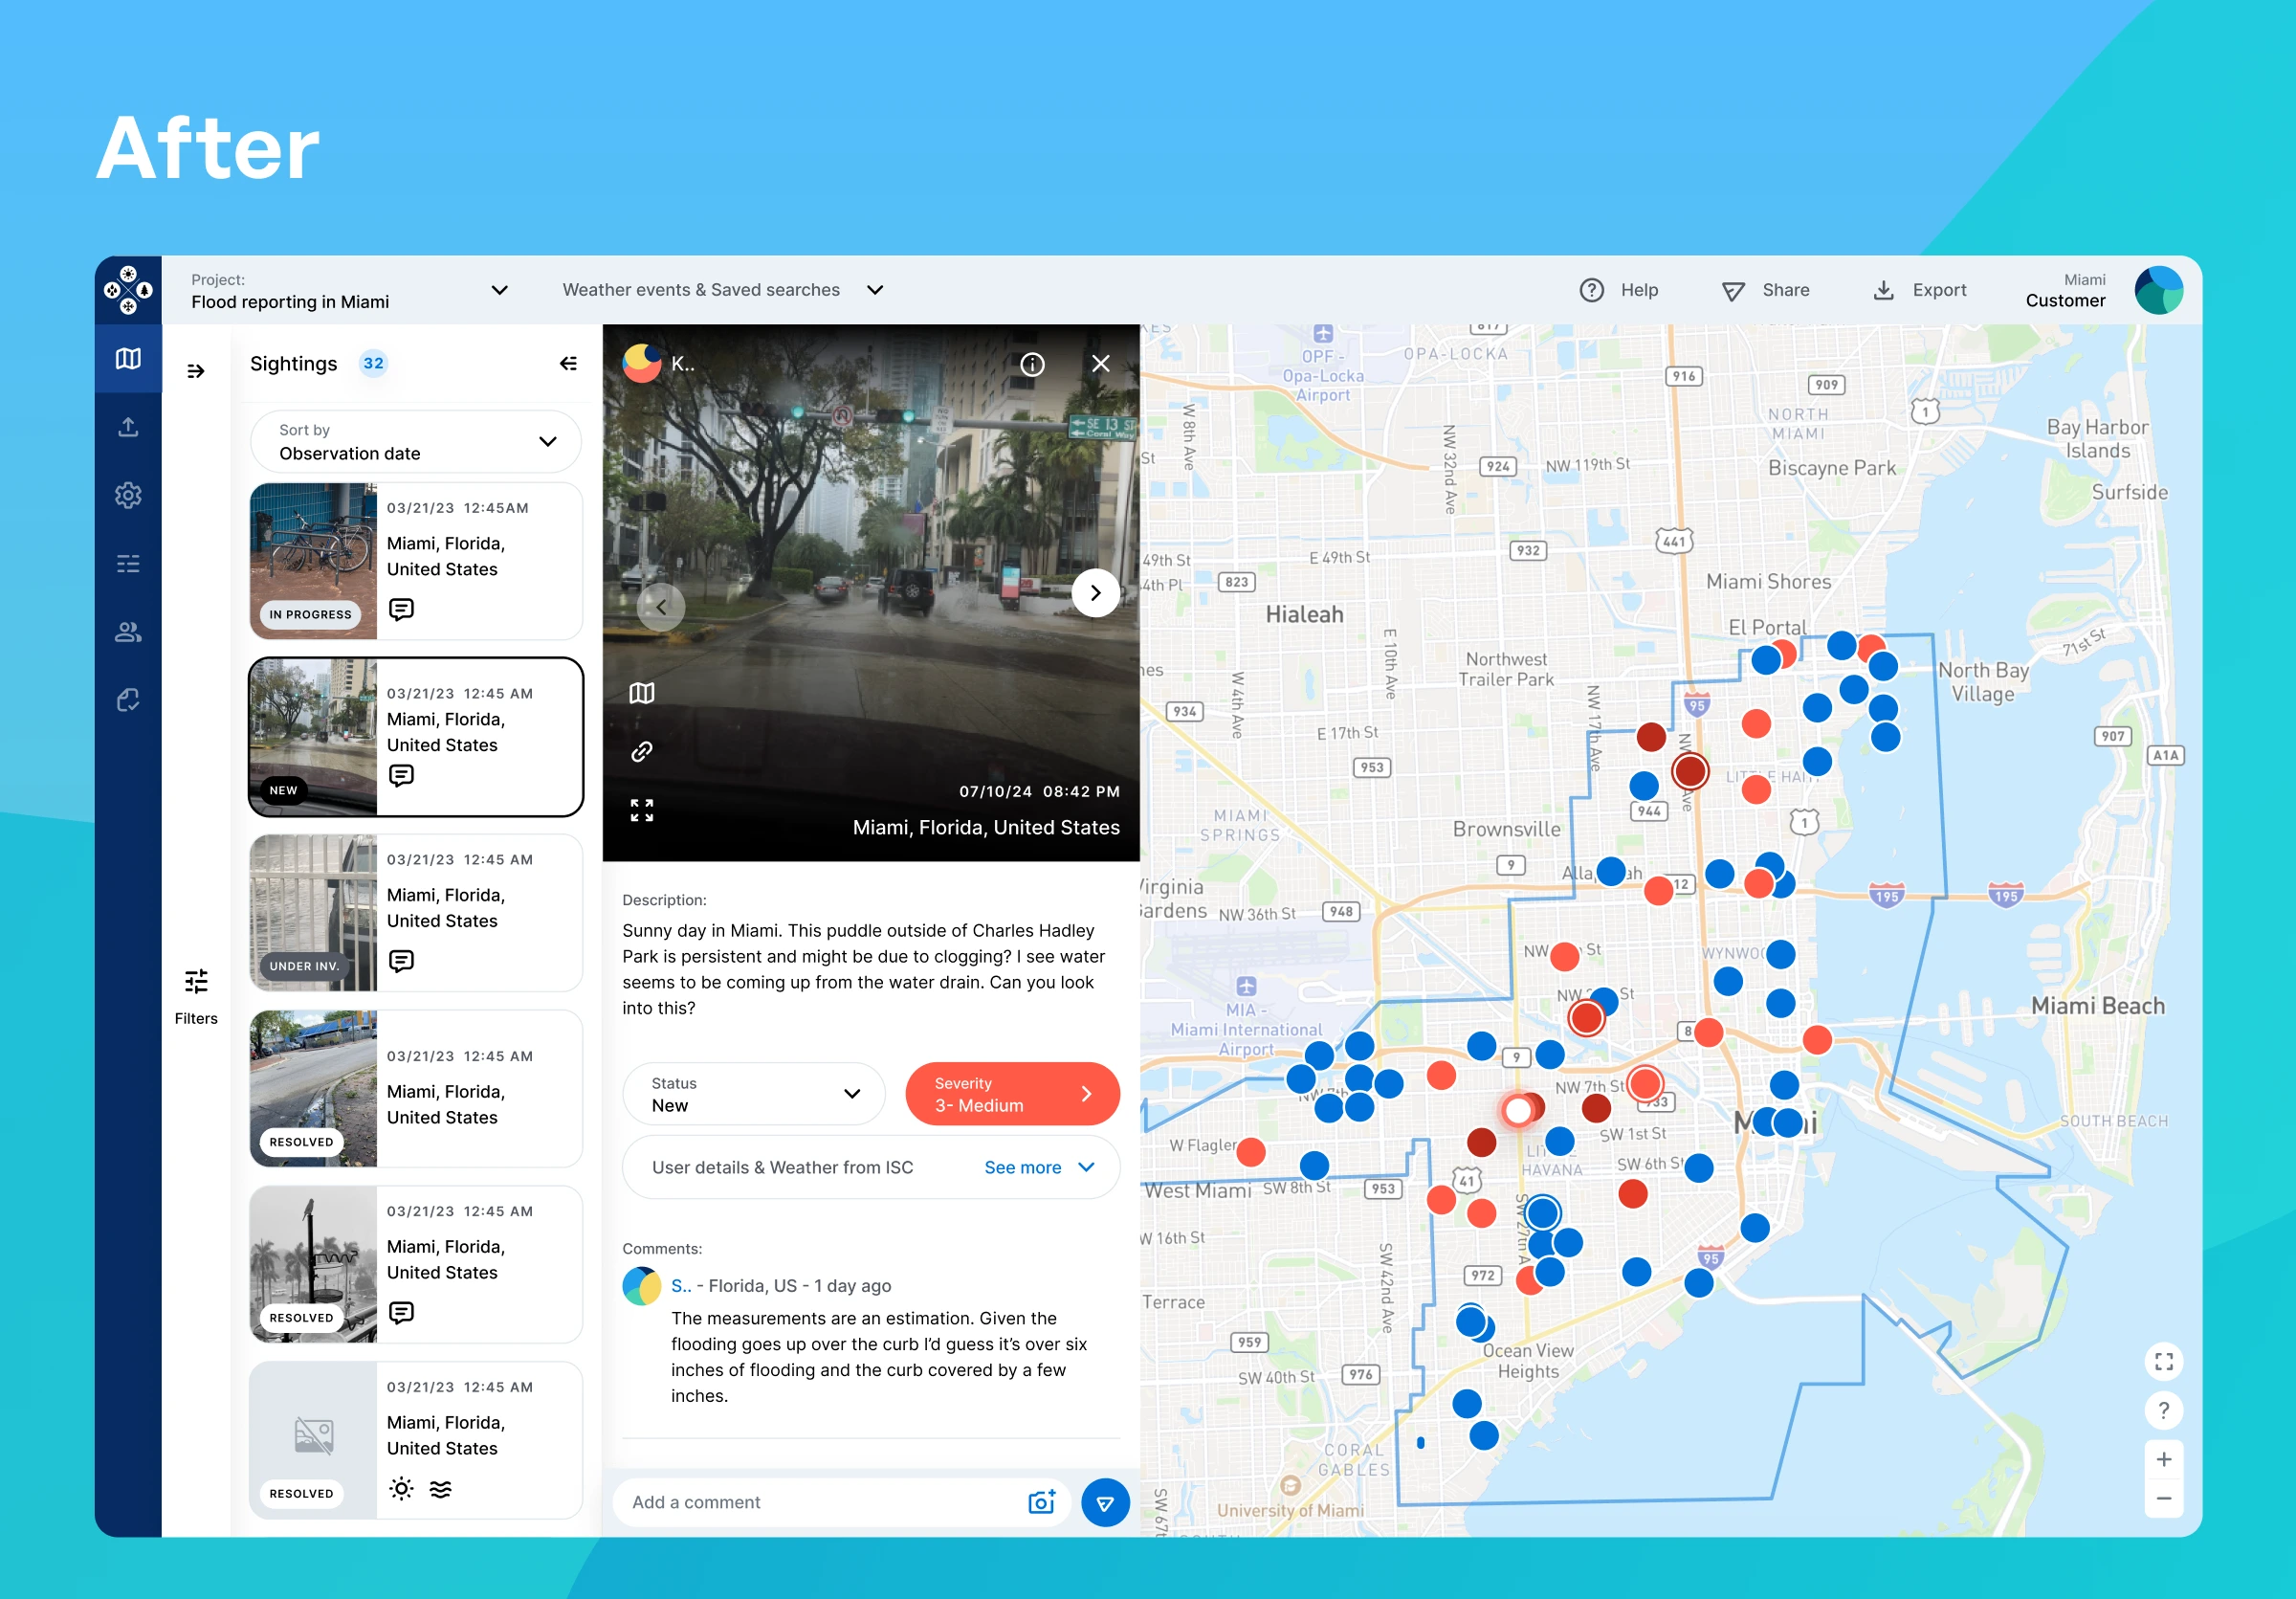
The customer dashboard was the first and most complex project I led at ISeeChange.
It’s a map-based platform designed for city partners to filter and analyze citizen posts using various metrics.
It supports incident response, infrastructure planning, and climate adaptation strategies.
Navigation
The platform includes three levels of navigation, each designed to help users manage complex climate data with ease:
Main menu
core sections: Projects map, Settings, User Groups, and Surveys.
Filter panel
lets users narrow data by region, time, status, severity, topics, attributes, and groups.
View controls
switch between sightings, sensors, and user data in list or map views.
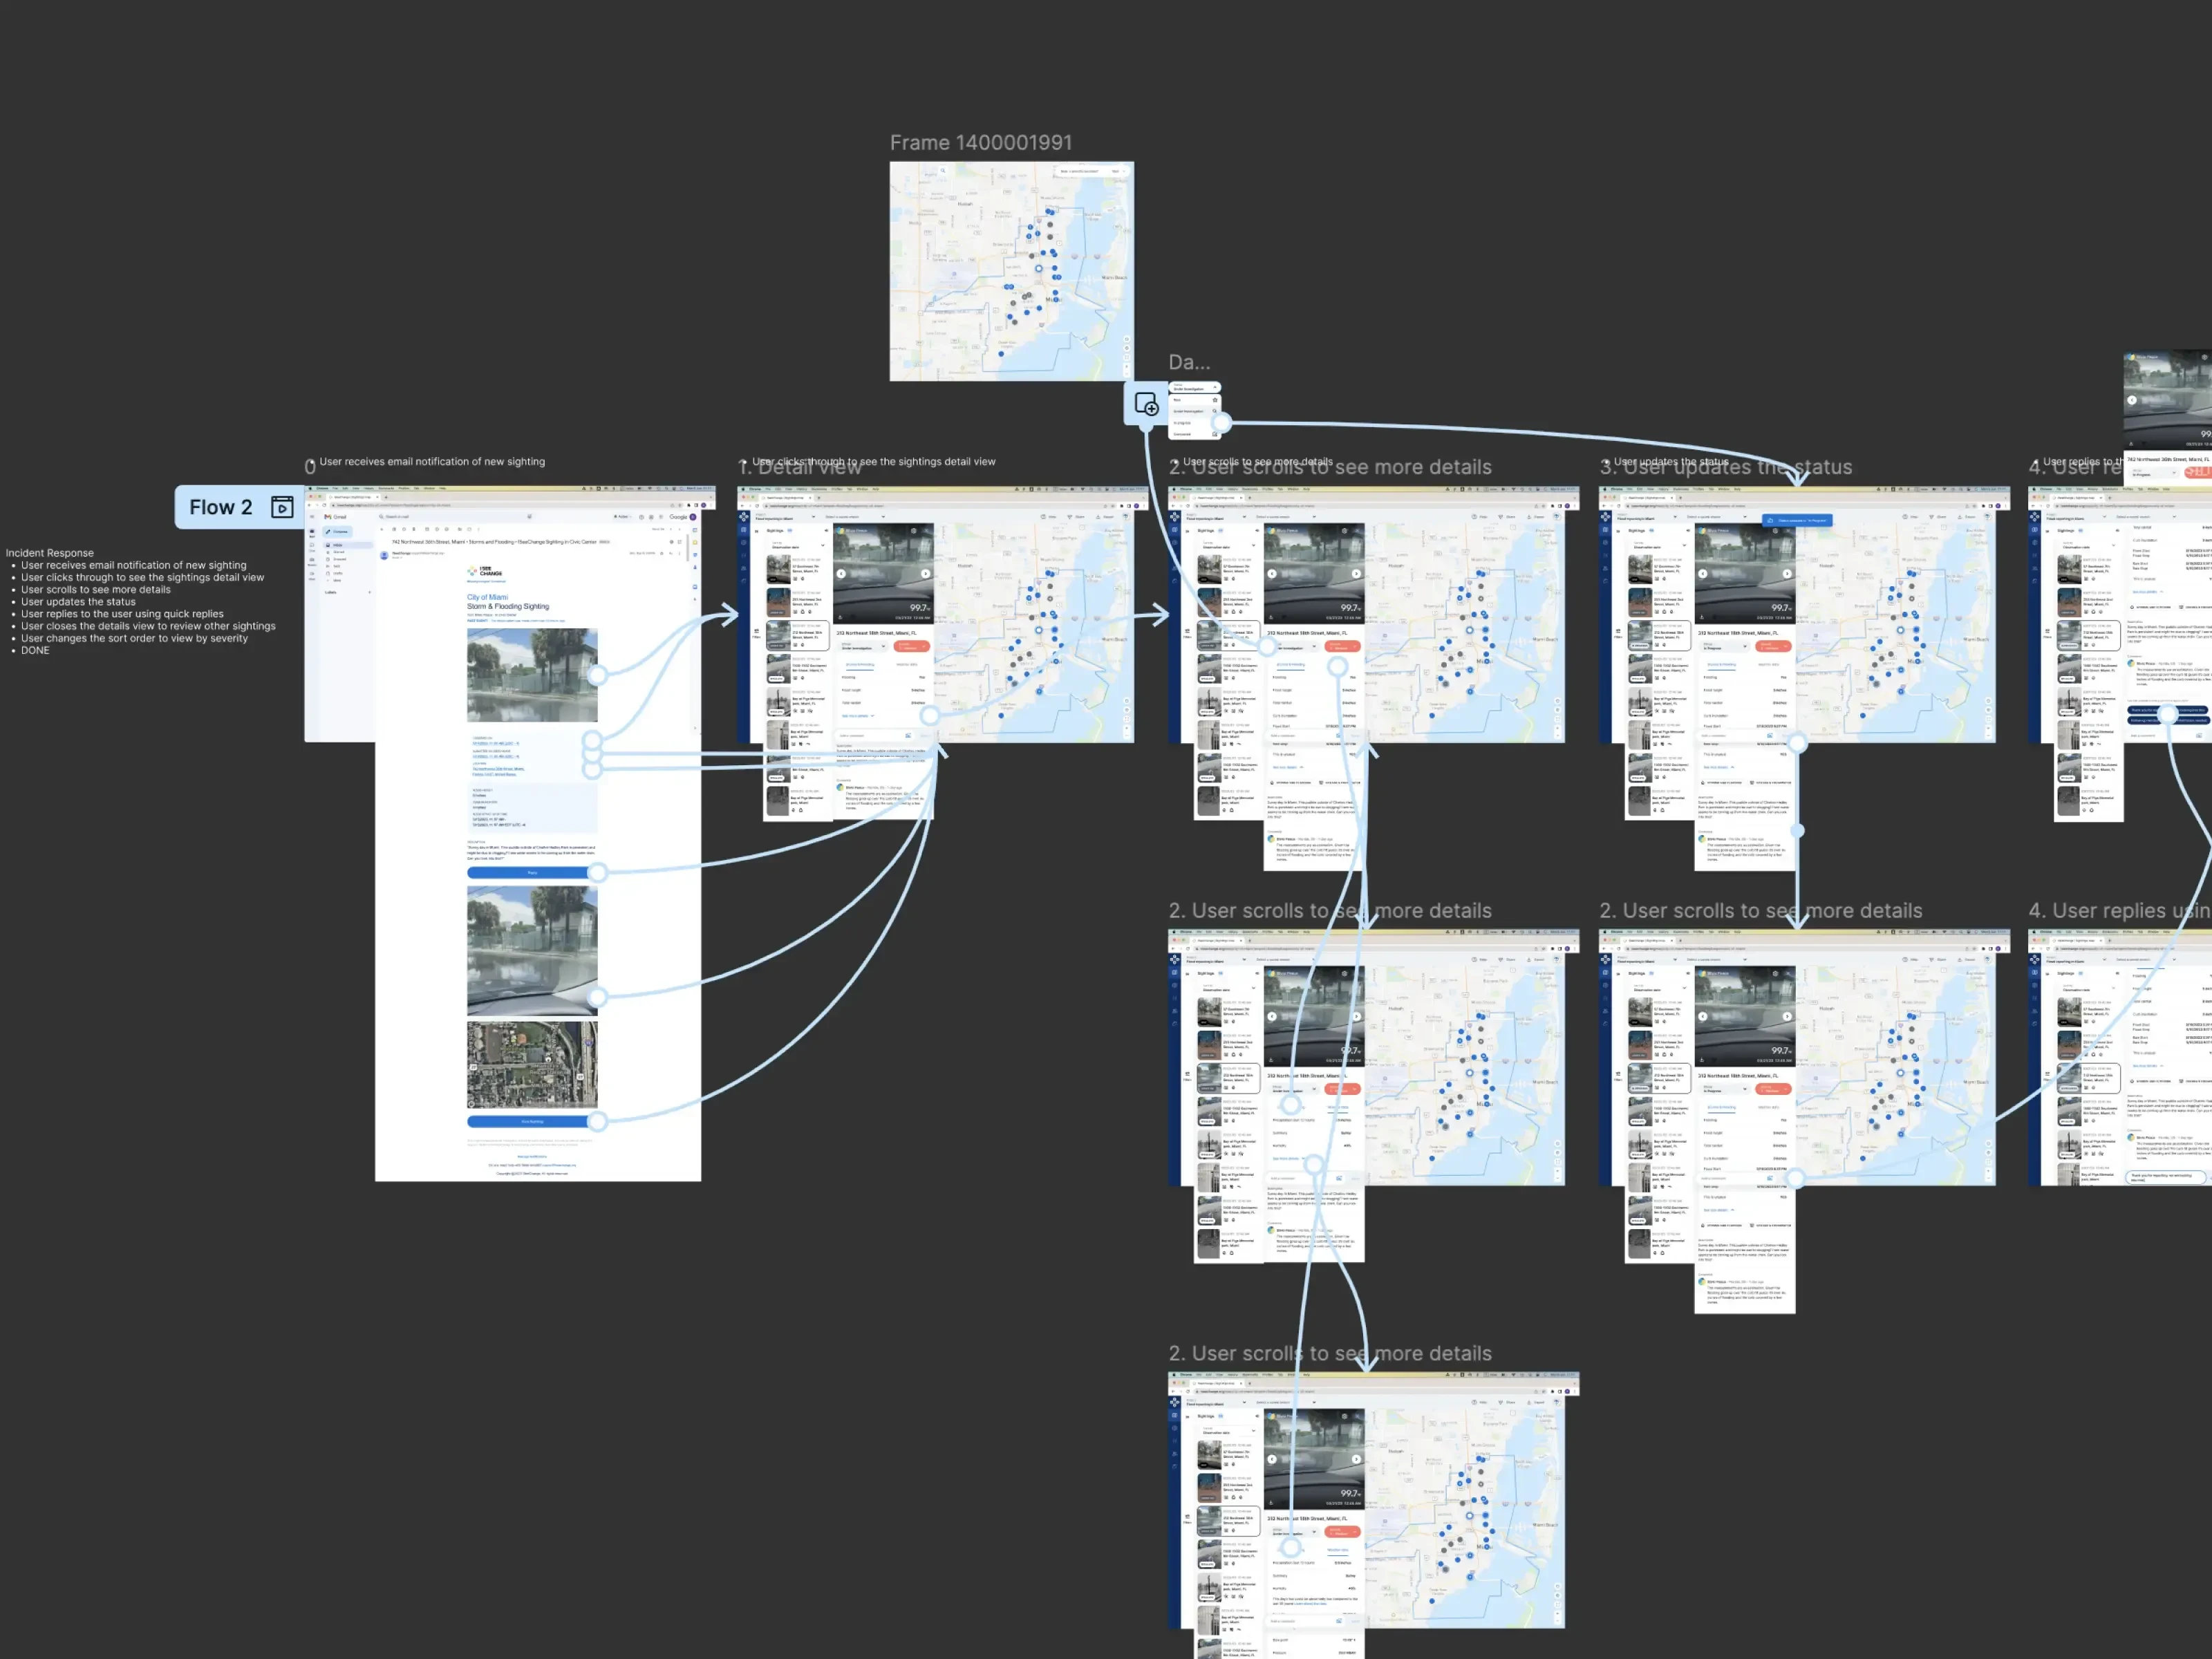
Prototyping
The prototypes, developed from the initial mockups, were designed to support incident response and infrastructure planning.
We tested them with cities and utilities to assess usability and understand which features and workflows were most effective in real-world scenarios.
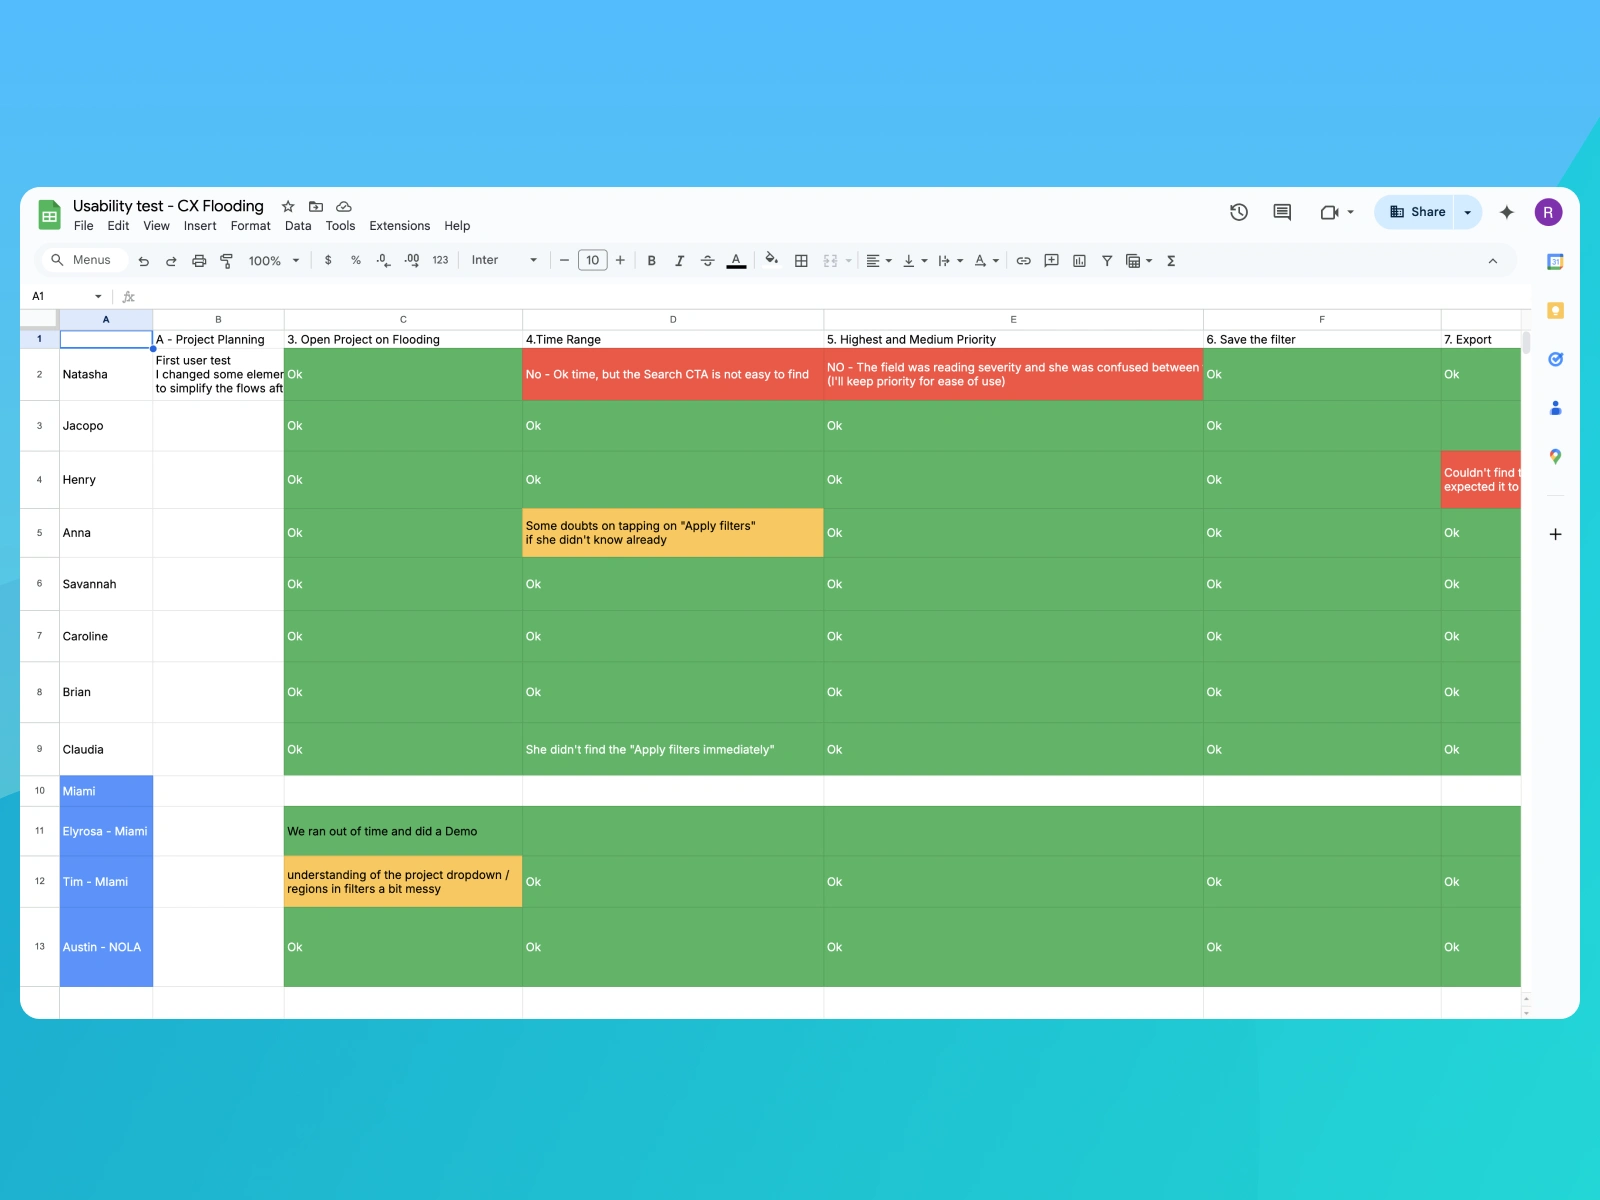
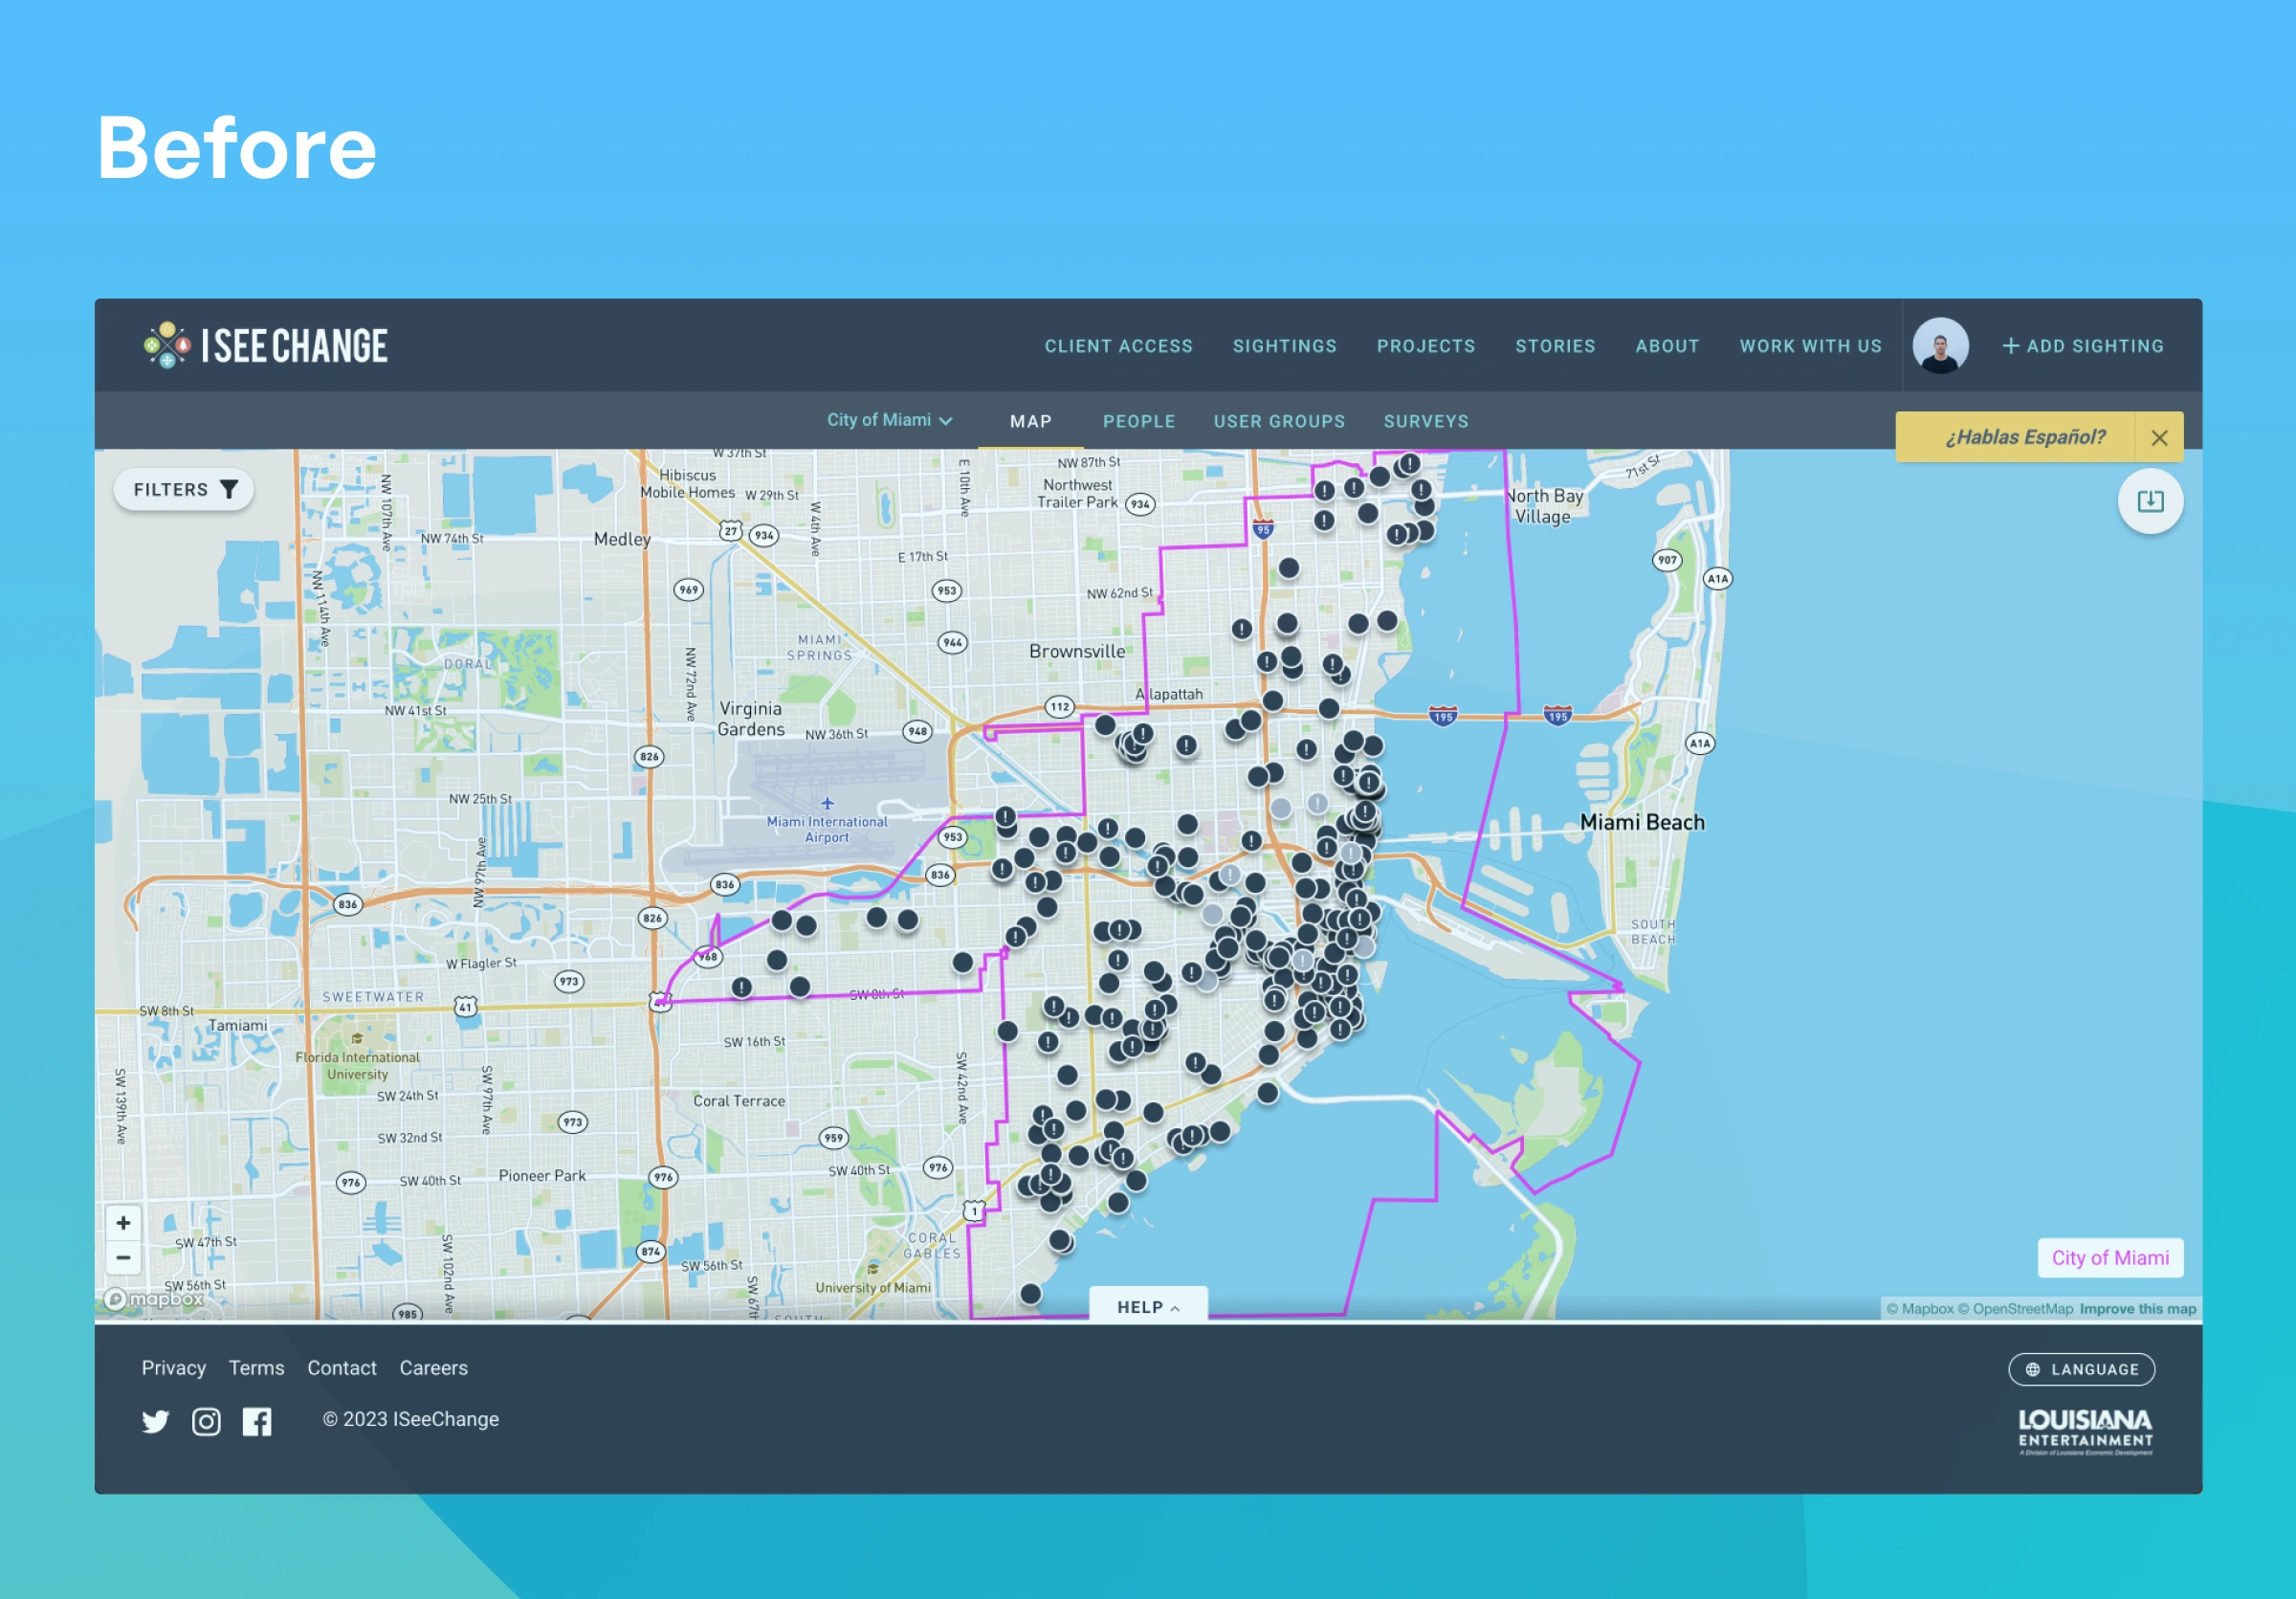
Usability and Final Designs
We ran usability tests with officials from the City of Miami, Miami-Dade County, and New Orleans.
These sessions helped us understand how easily users could navigate the platform, and shaped which features mattered most based on workflows and priorities.
The final interface combined all tested elements into a clean, responsive design. It was tailored for city officials and utility teams, with a focus on clarity, speed, and confident decision-making.
Like this project
Posted Jun 27, 2025
The customer dashboard was the most complex project I led at ISeeChange. It ’s a platform designed for city partners to filter and analyze citizen posts.