
📊 Sales Performance Analytics Dashboard (Power BI)
This Power BI dashboard was developed as part of a technical case study to demonstrate a business‑first approach to performance analytics.
The report is designed to support both executive‑level decision‑making and operational sales management by focusing on:
Revenue performance tracking
Key performance drivers (Orders & Average Order Value)
Team‑level performance monitoring
Individual agent insights
Data quality validation and exception handling
🔎 Key Functional Areas
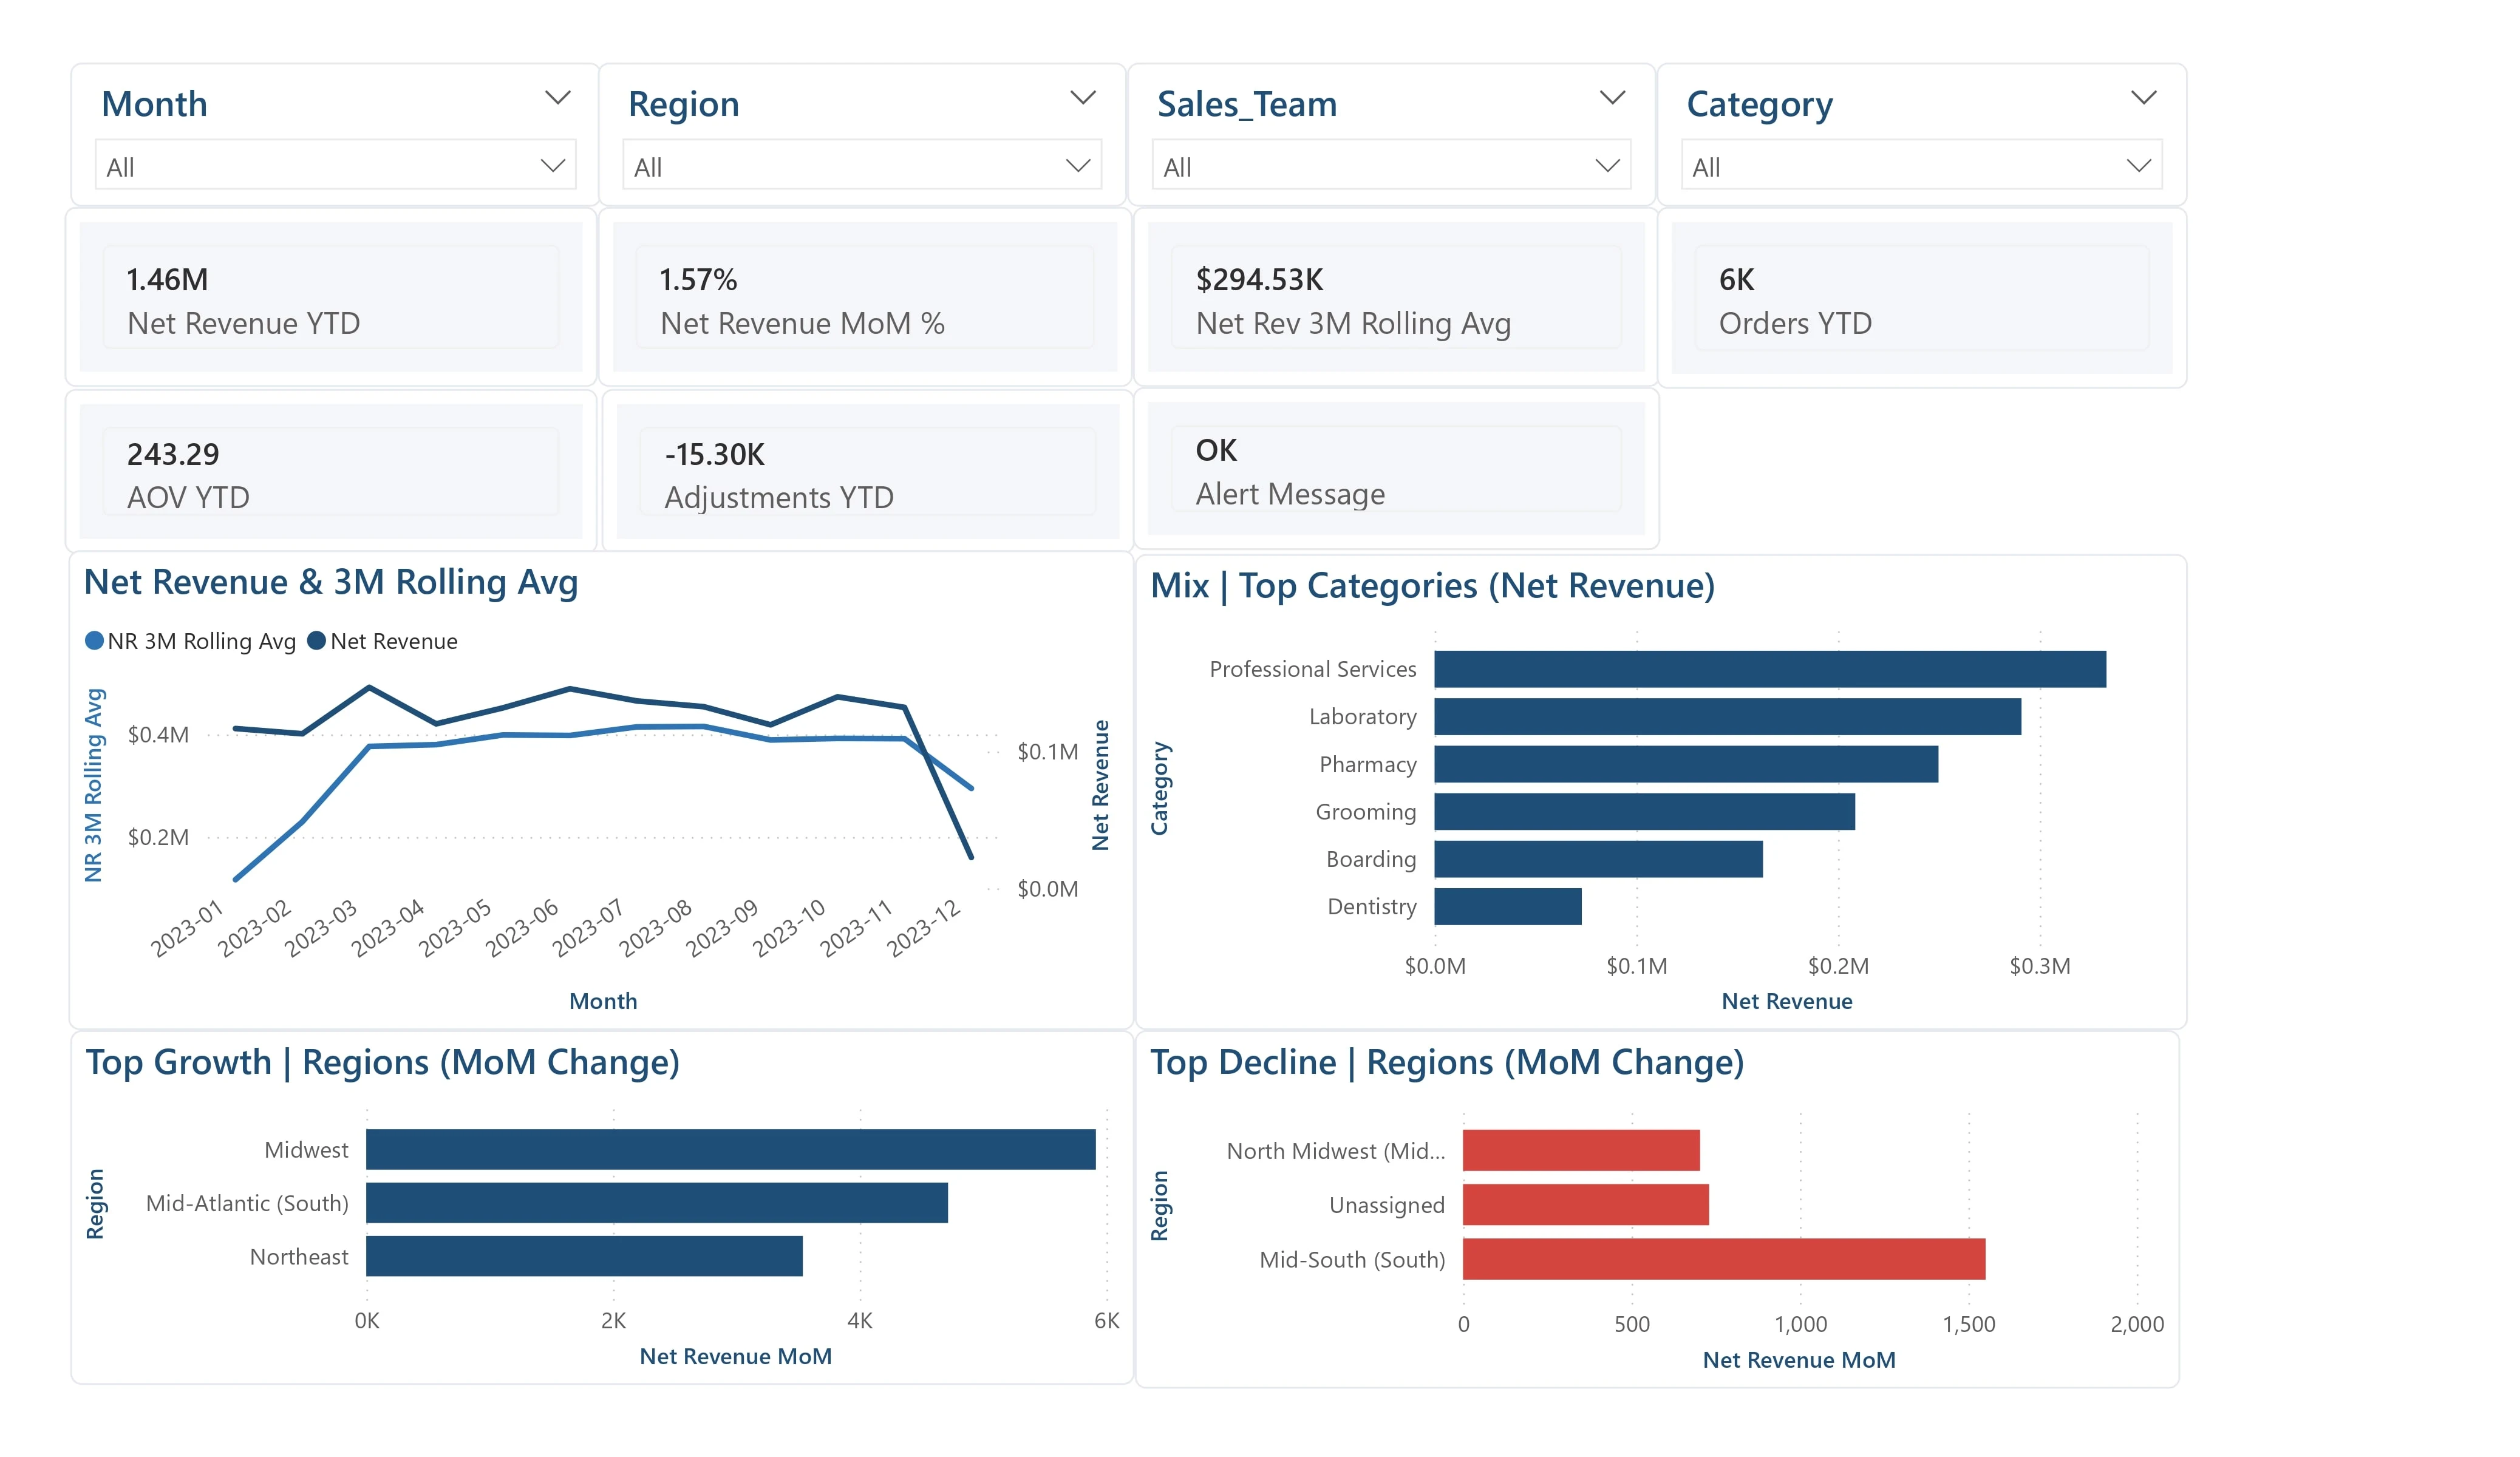
Executive Overview
Provides a high‑level summary of Net Revenue and its primary drivers, supported by a monthly trend and rolling average to identify emerging performance patterns and reduce short‑term volatility.
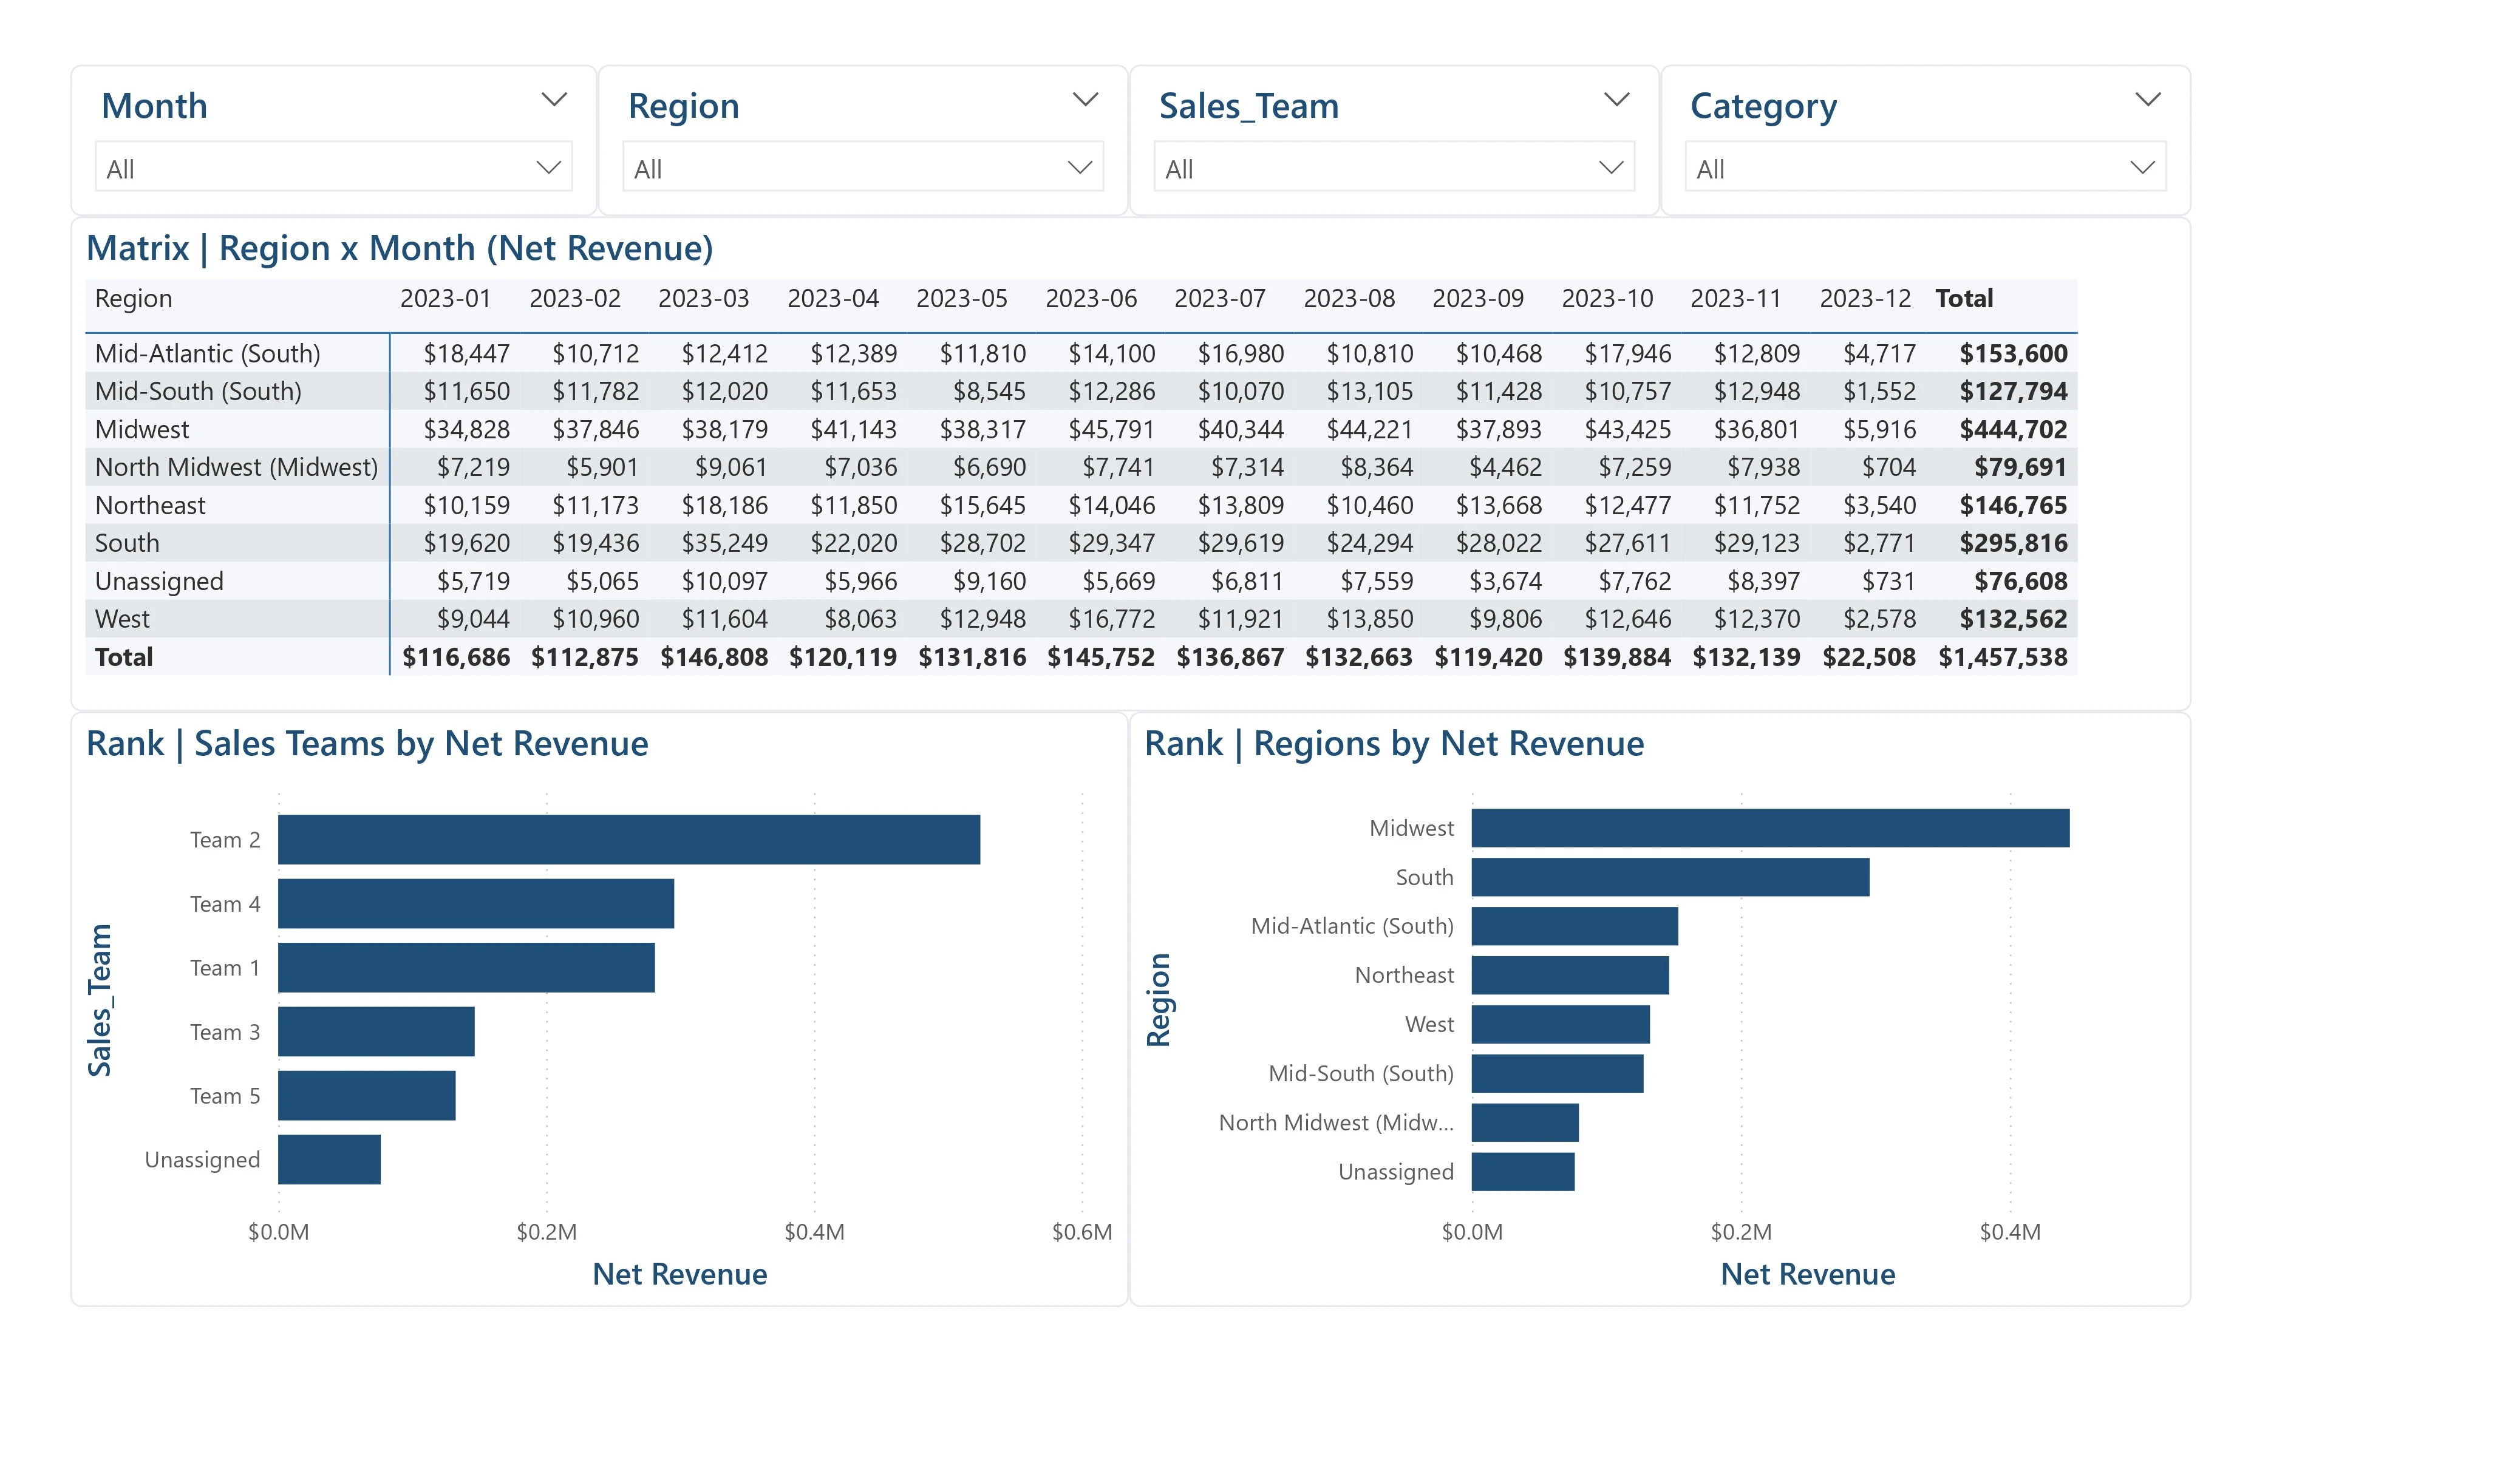
Performance Diagnostics (Region × Time)
Enables root‑cause analysis by highlighting when and where performance changes occurred across regions and time periods.
Sales Team Monitoring
Supports day‑to‑day management through ranked team performance metrics, enabling prioritization of coaching or follow‑up actions.
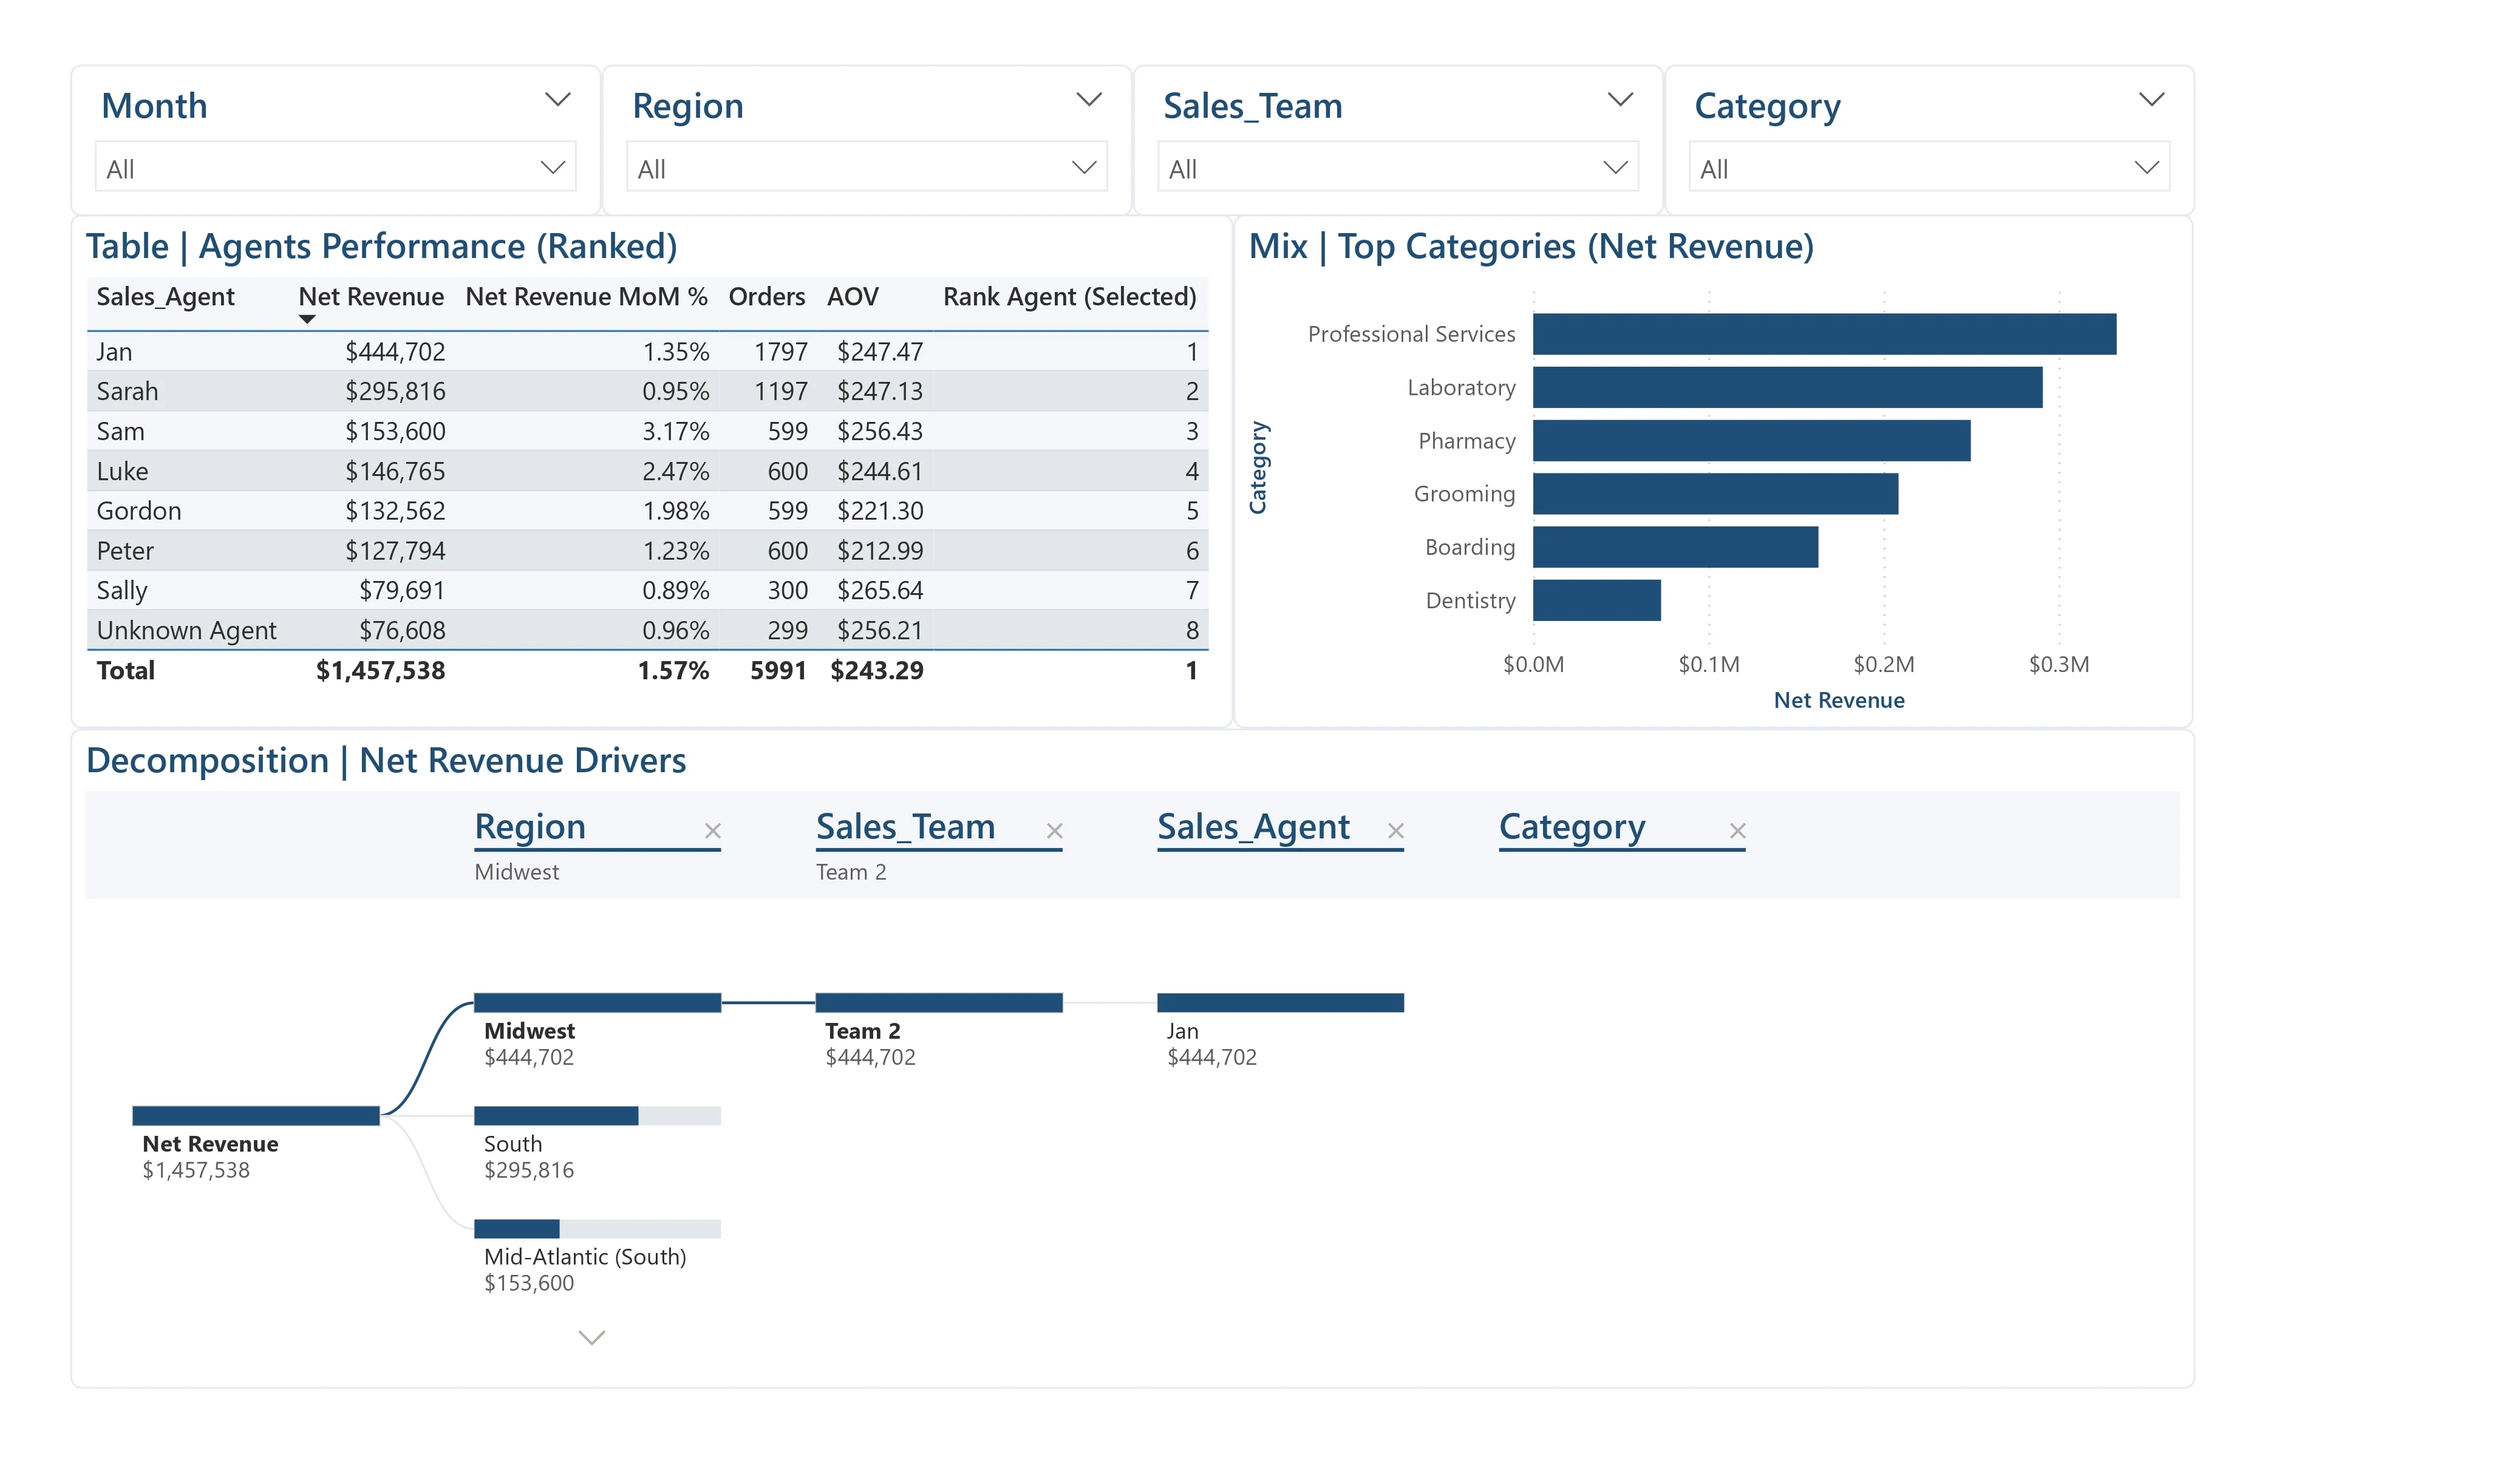
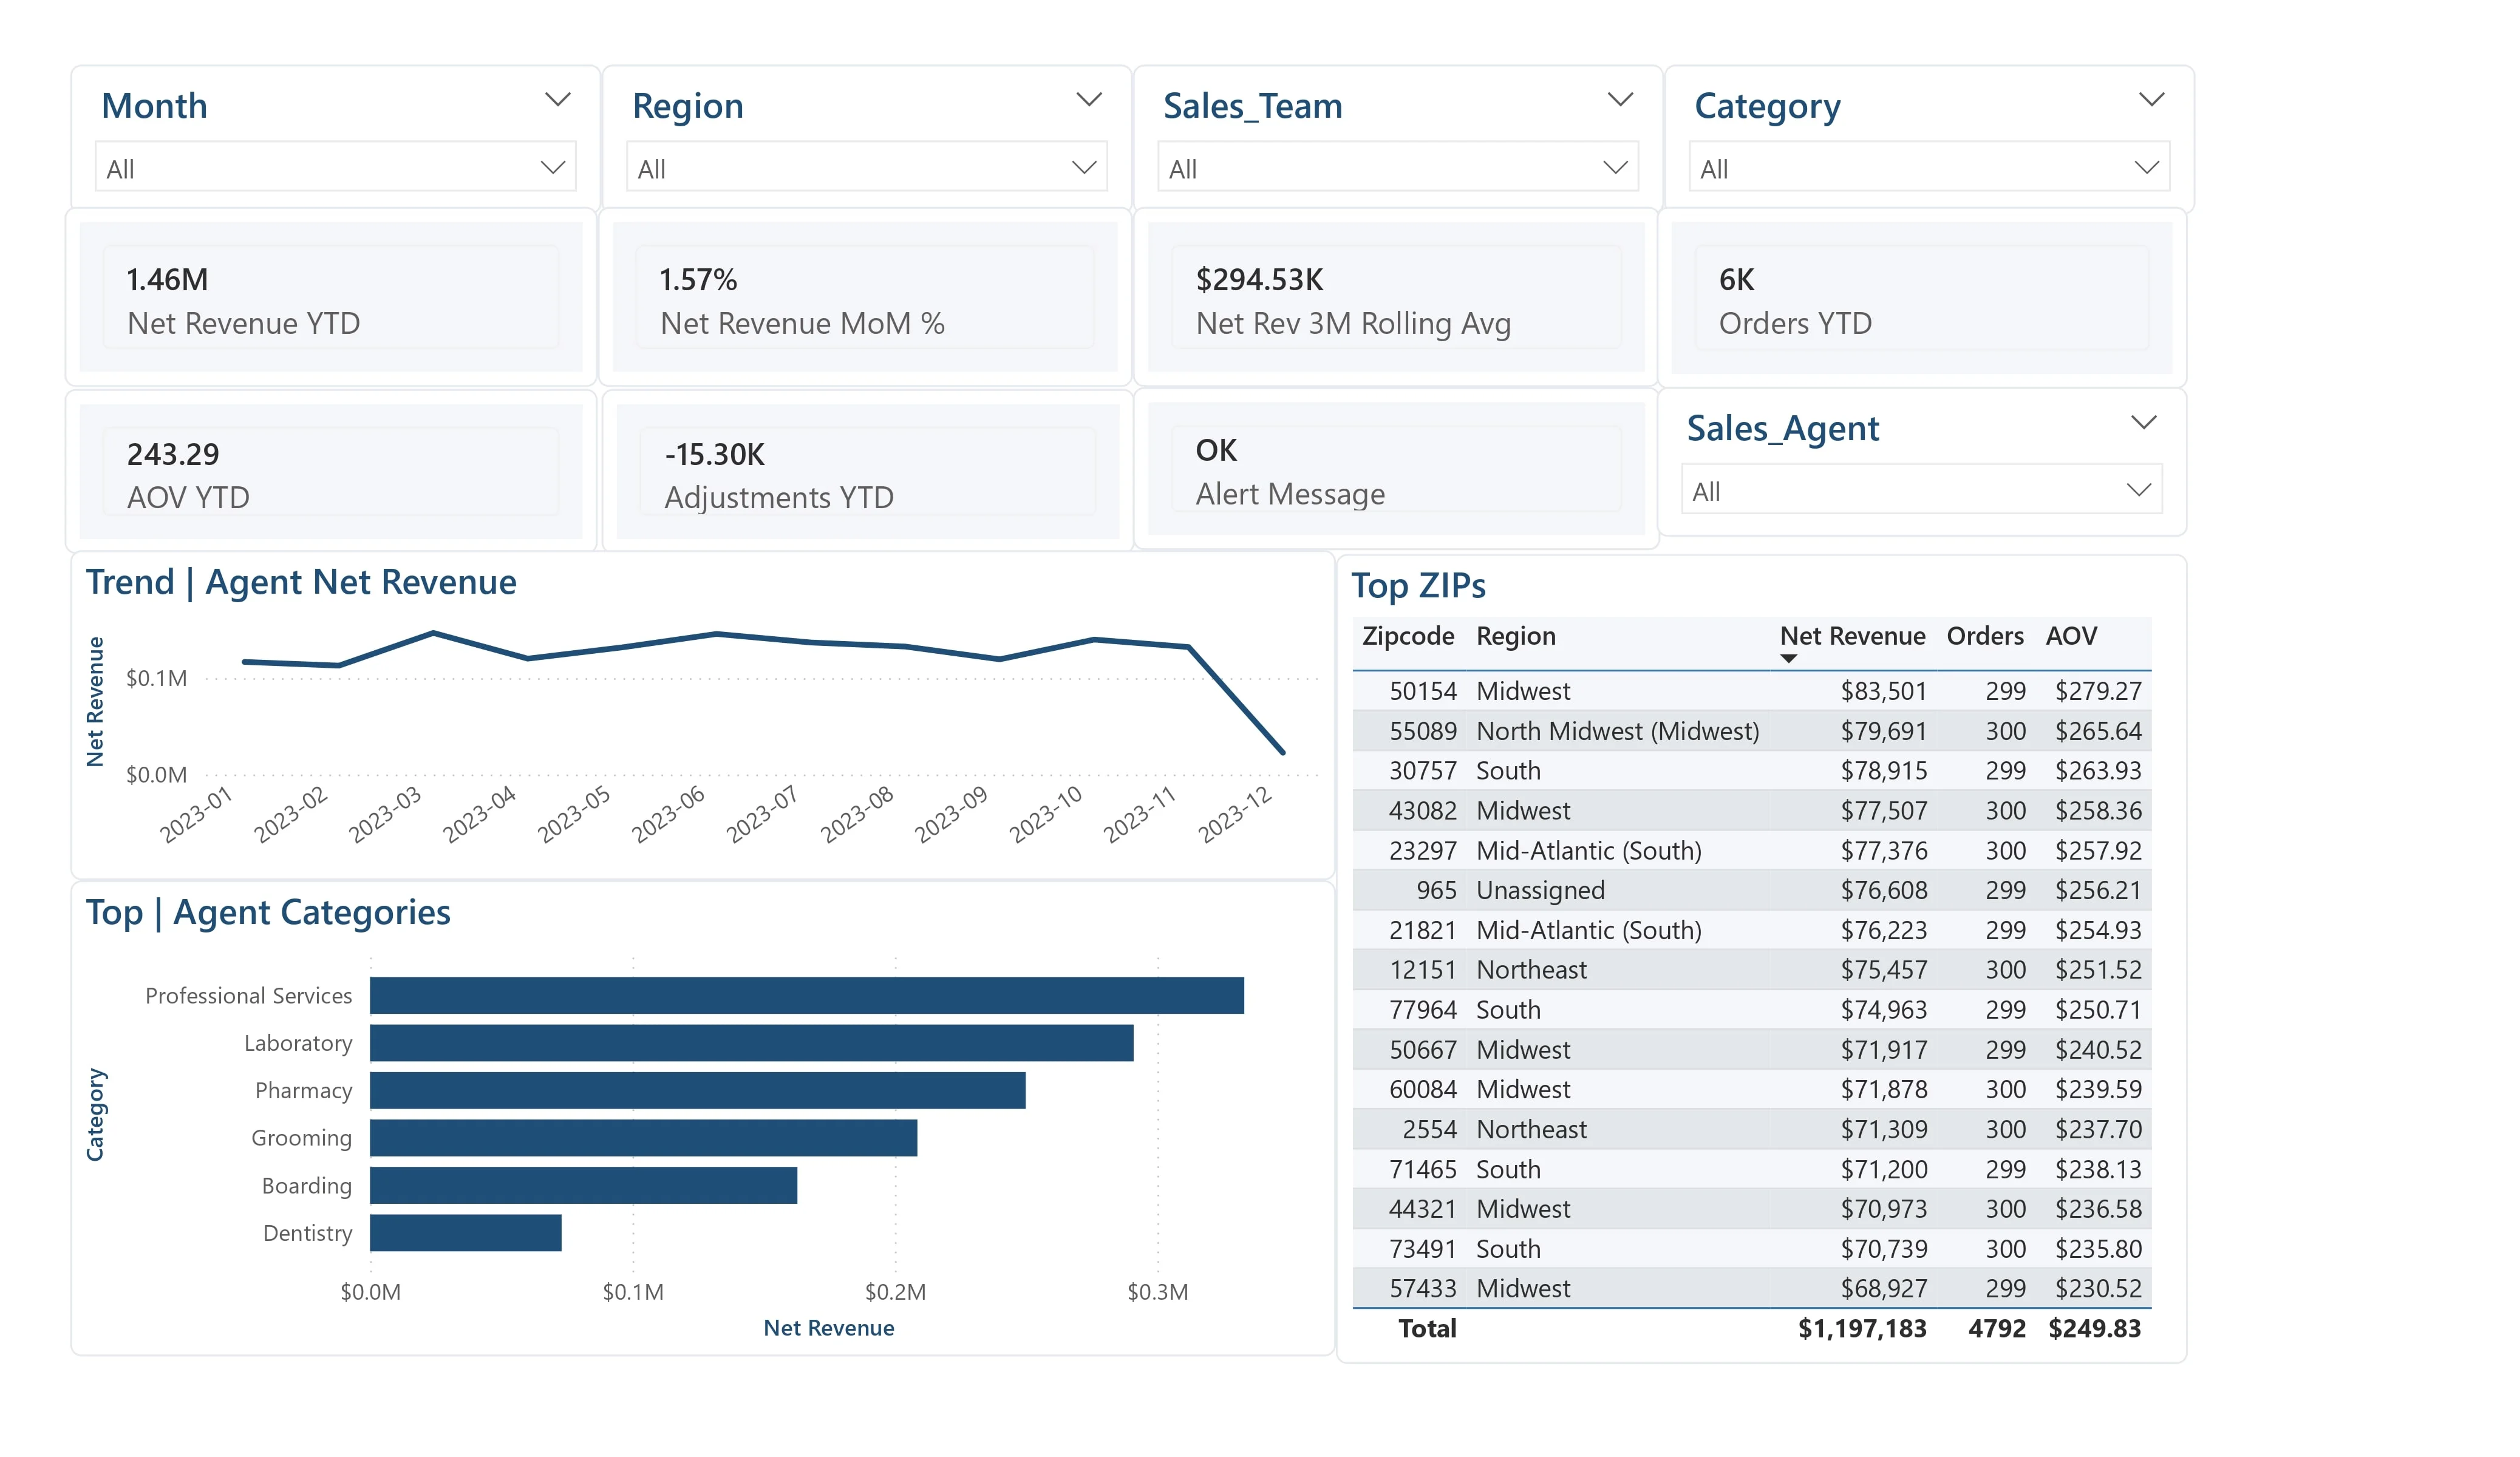
Agent‑Level Analysis
Offers a focused performance view per individual contributor, including category mix and territory‑level revenue drivers.
Data Quality Monitoring
Separates adjustments (e.g. returns, discounts) from gross performance to prevent misleading KPI interpretation.
💼 Business Value
Designed to:
Monitor operational performance
Identify revenue drivers behind month‑over‑month changes
Detect under‑ or over‑performing teams
Support targeted coaching
Enable fast, data‑driven decision‑making
🛠 Tools & Concepts Used
Power BI
Data Modeling (Fact / Dimension)
KPI Design
MoM Analysis
Driver‑Based Revenue Monitoring
AOV Tracking
Data Quality Checks
0 likes · 0 views · Apr 7, 2026
📊 Sales Performance Analytics Dashboard (Power BI) This Power BI dashboard was developed as part of a technical case study to demonstrate a business‑first a...


