Advanced Data Analysis and Smart Web App
Nathalia Montandon
Overview
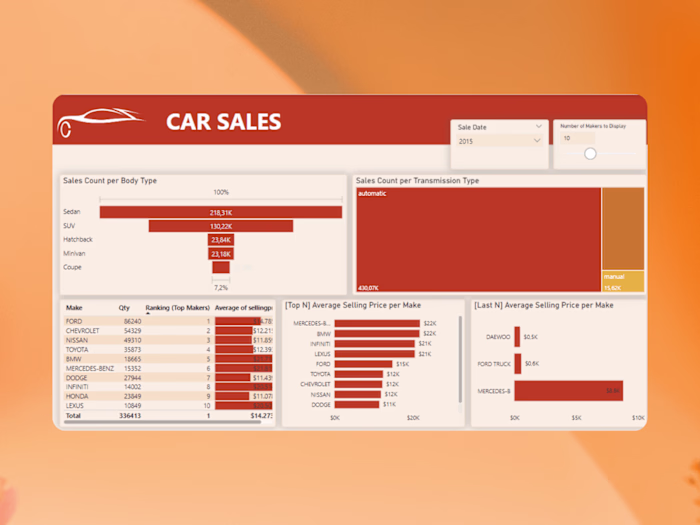
One example of data converted into a web app is this project: a web app developed to be a PitchFork Reviews' Dashboard.
In this project, I used SQL and Python to transform and load the data and Streamlit to create the web app.
KPIs
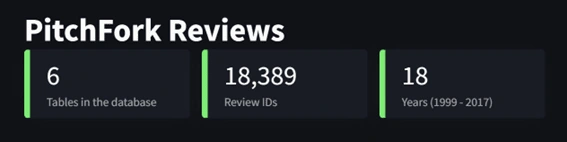
KPIs of PitchFork Reviews
The first part of the application are the KPIs:
Number of tables in the database
Number of reviews
Number of years (and the range)
Reviews Over Time
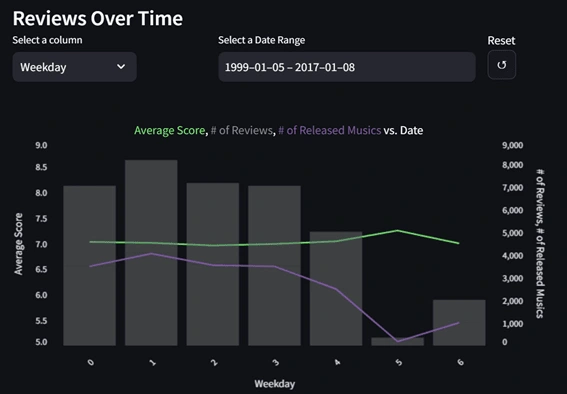
Reviews Over Time Section
In this section it's possible to analyze the reviews over time through the following metrics:
Average Score
Number of reviews
Number of released musics
To extract the best insights, the user have some filter options:
The level of detail of the date -> Year, Month, Day, Weekday
The date range
Average Score per Feature

Average Score per Feature Section
The third section contains an analysis of the average score and number of reviews per artist or per genre.
Aiming to complement the analysis, it's possible to select the feature and how many rows the user wants to analyze.
Like this project
Posted May 29, 2024
Data analysis and data visualization are complementary. In this project I show the result of joining both as a web app presenting the result of data analysis.
Likes
0
Views
5