Comprenhensive Dashboards
Nathalia Montandon
Overview
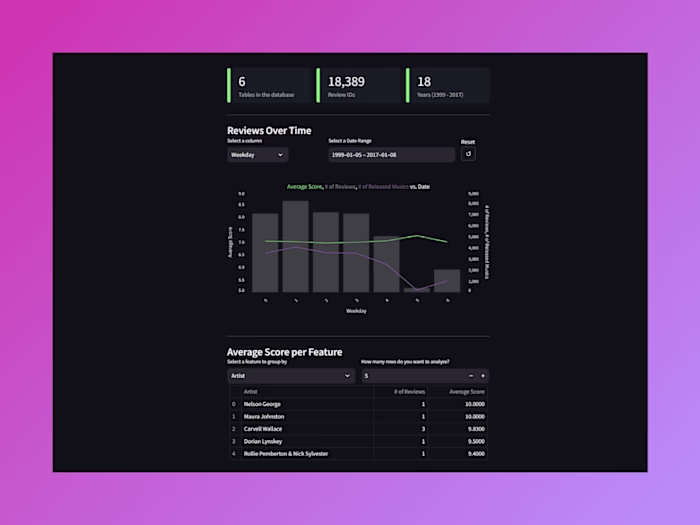
I created many interactive dashboards in Power BI that simplified complex data into understandable visuals, enhancing decision-making processes.
One example is the Car Sales dashboard.
Available Pages
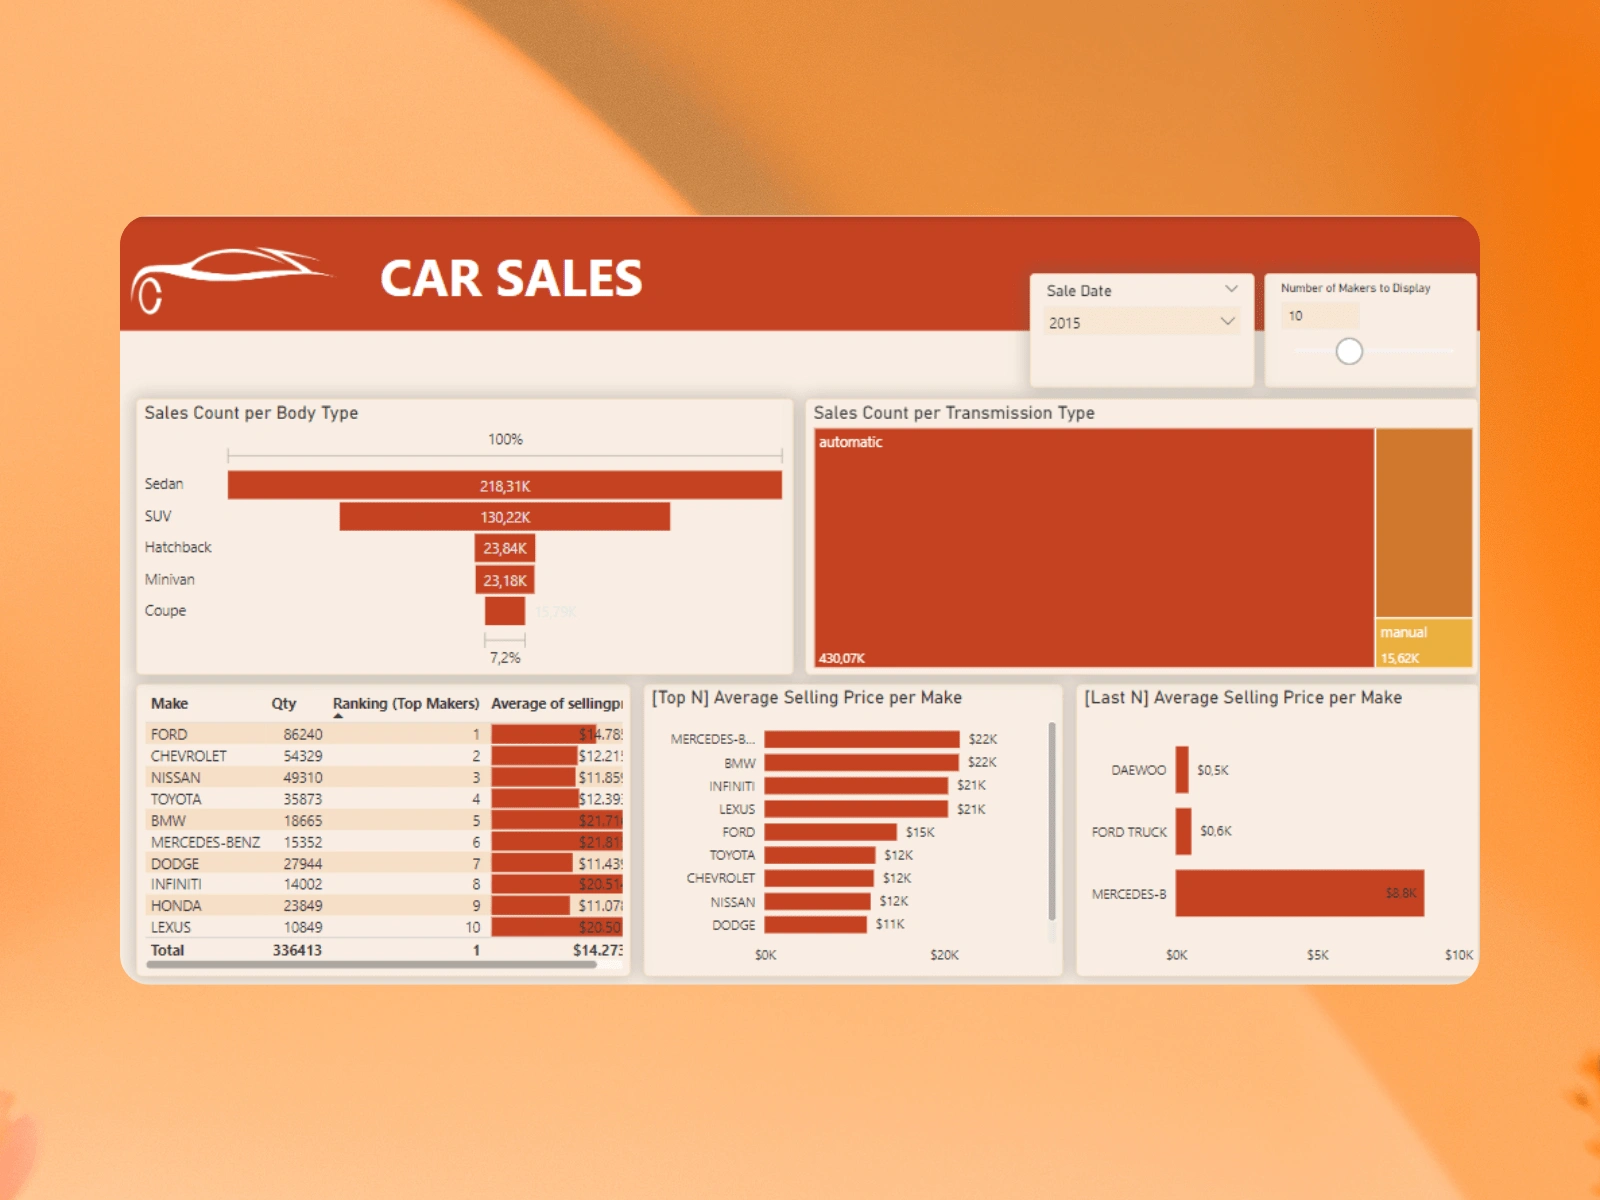
Overview
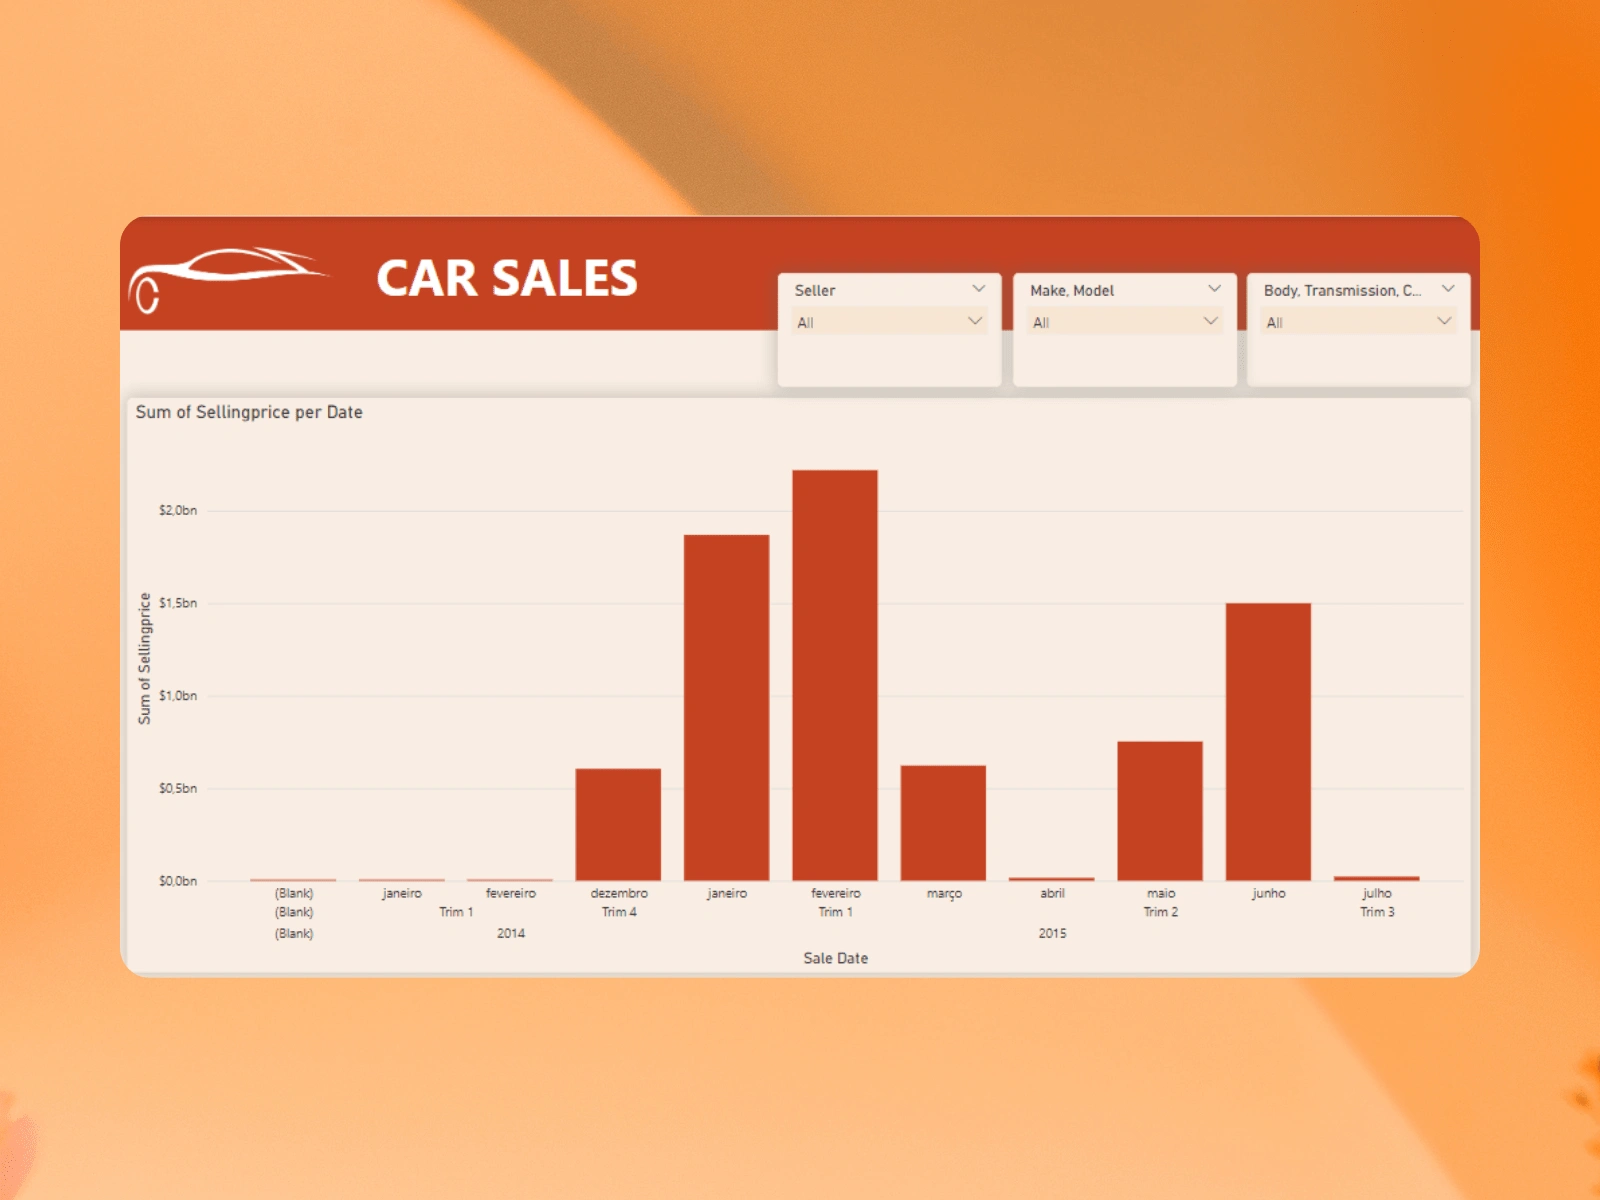
Selling Price per Date
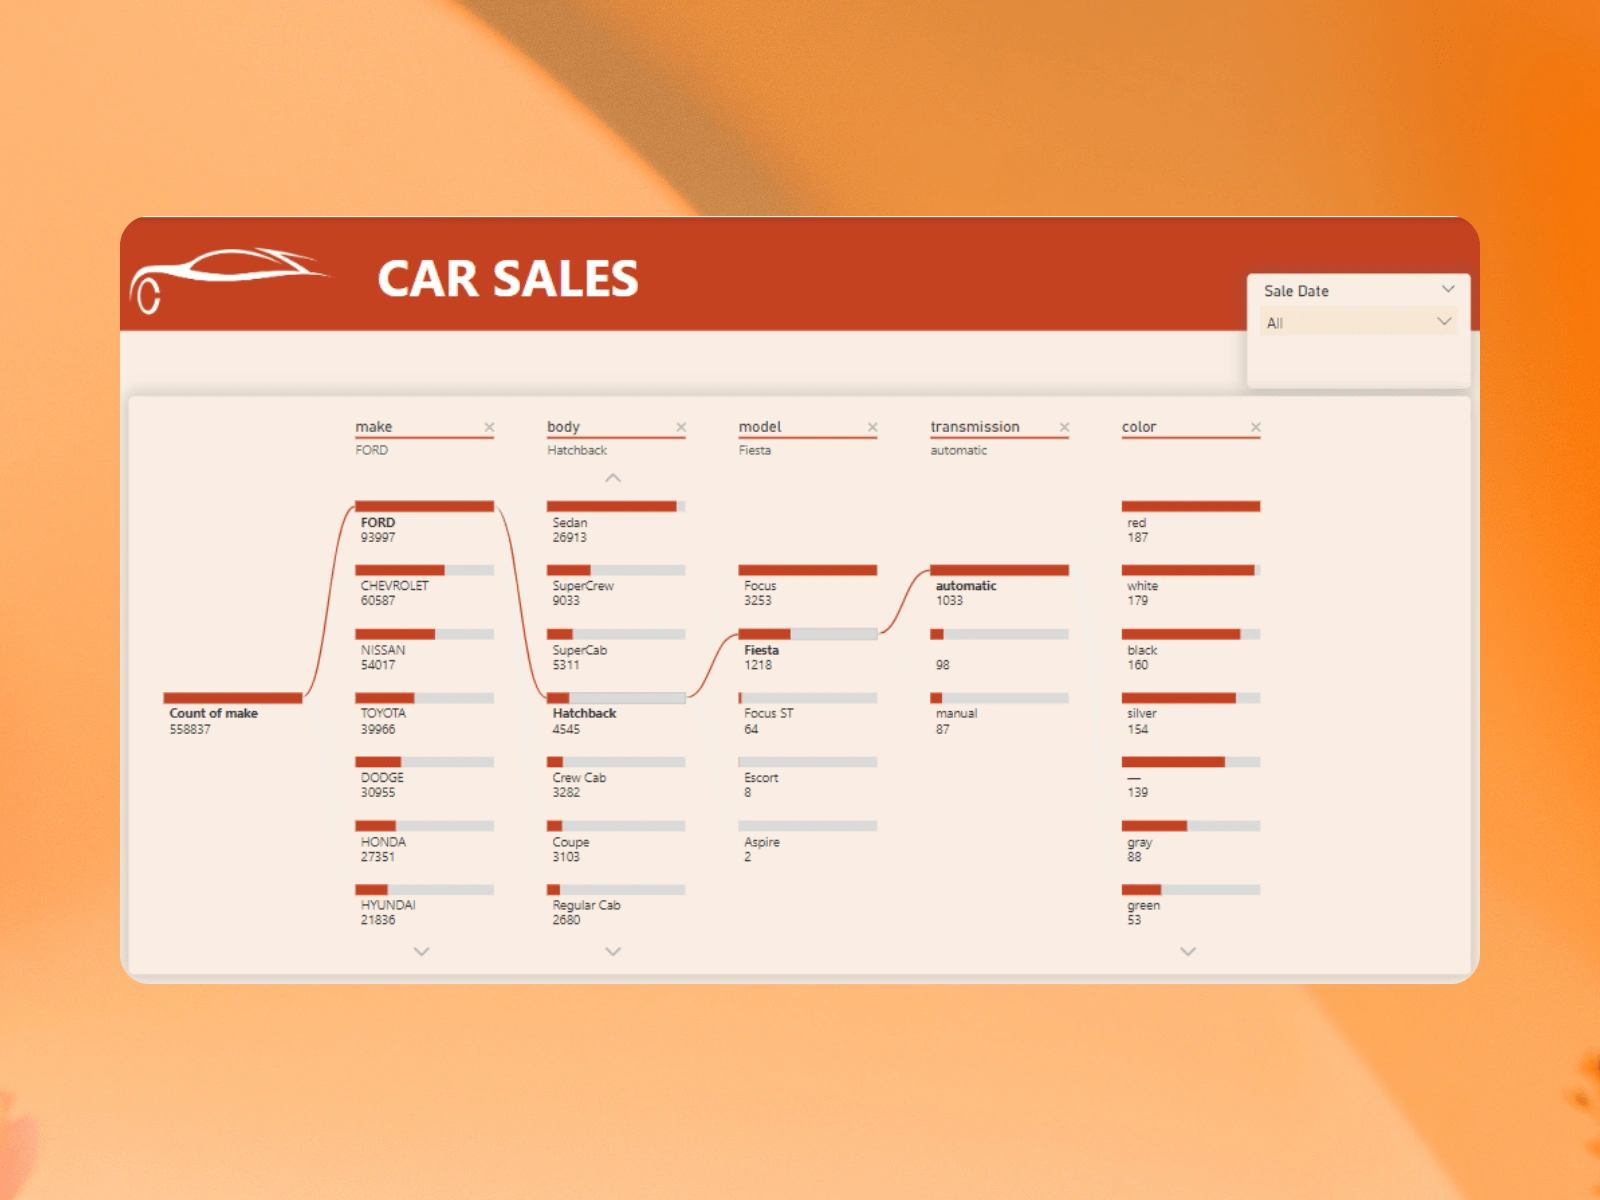
Decomposition Tree
Like this project
Posted May 13, 2024
I created many interactive dashboards in Power BI that simplified complex data into understandable visuals, enhancing decision-making processes for my clients.
Likes
0
Views
2