Educational Data Analysis and Visualization Project
Ifigeneia Tsiflidou
I cleaned and prepared the data in Excel by organizing it into a clear format, fixing errors, handling missing values, and calculating key metrics such as the percentage of correct, incorrect, and unanswered questions for each student. This step made the data ready for analysis and visualization.
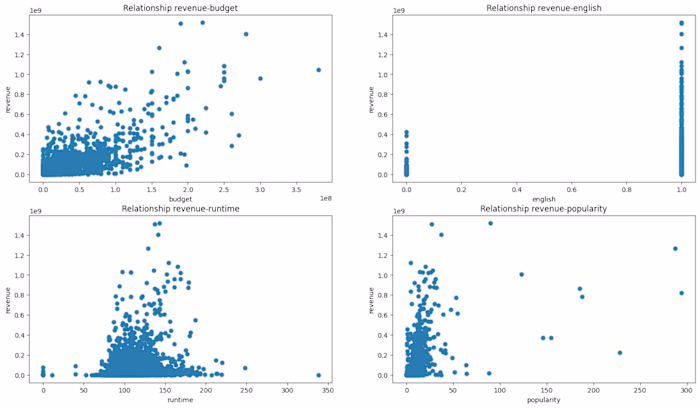
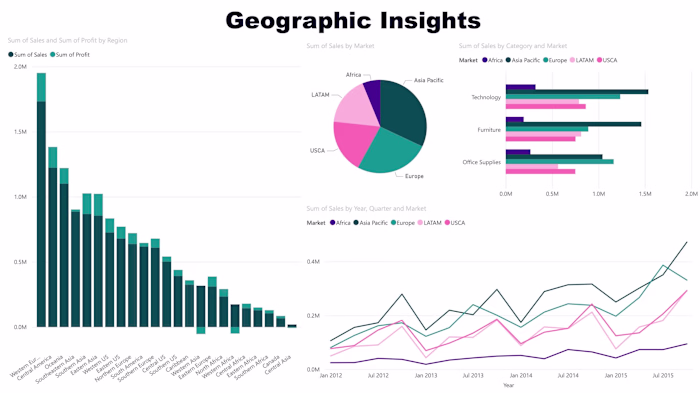
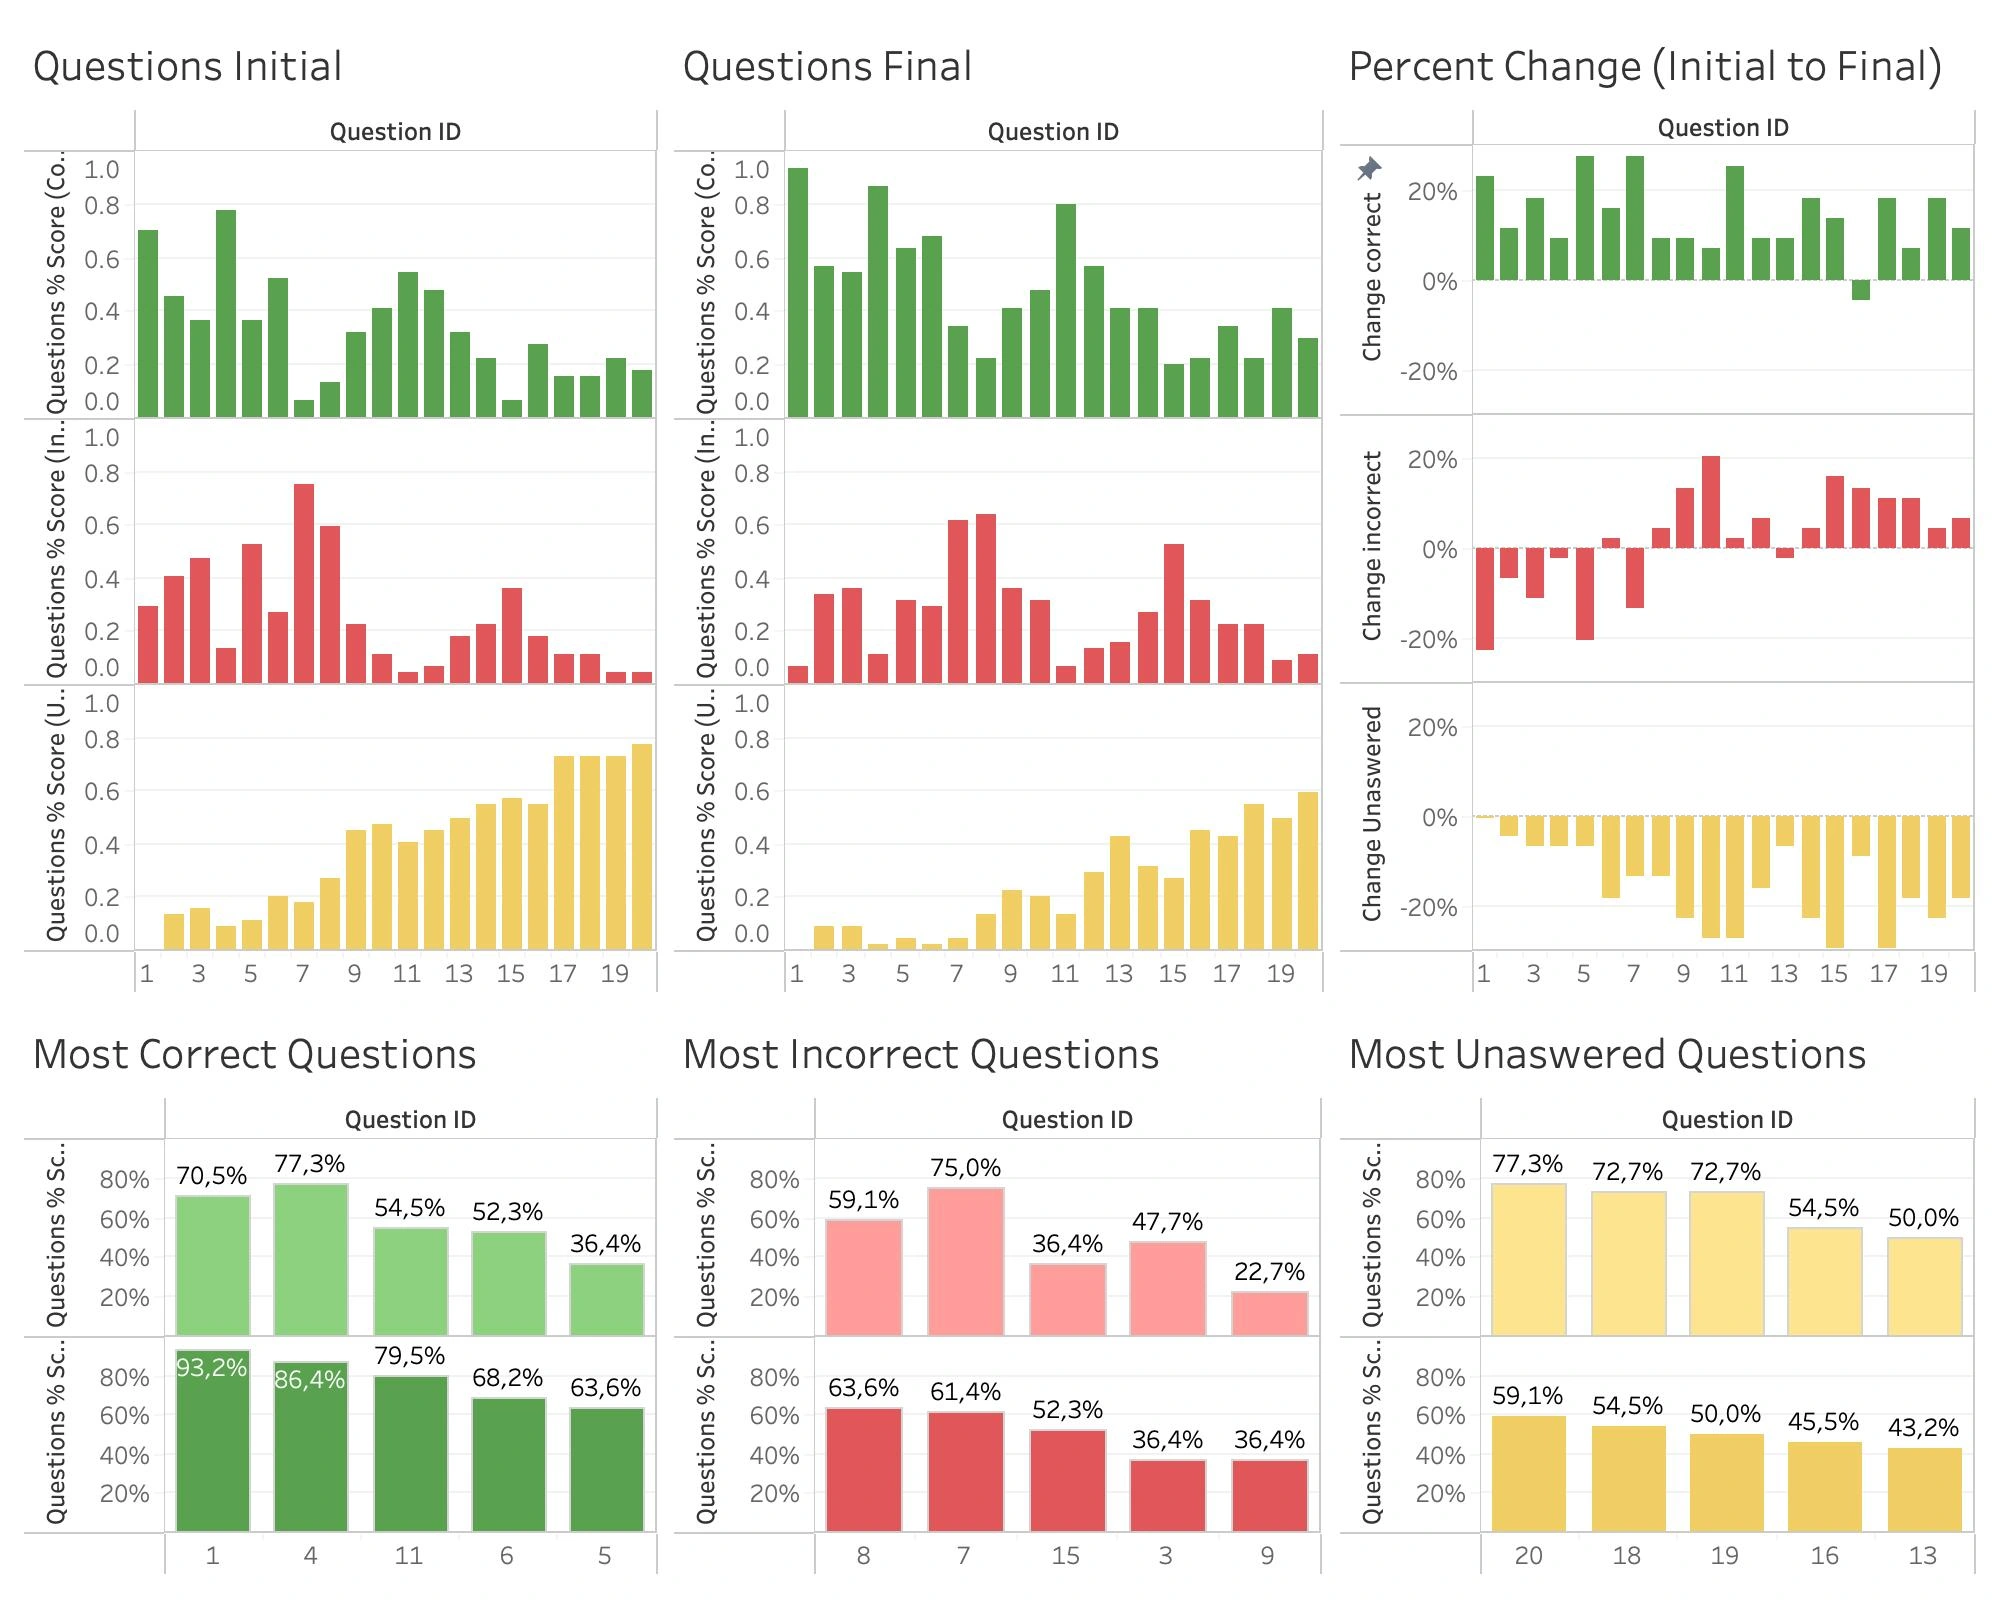
After preparing the data, I created interactive graphs and dashboards in Tableau. These visualizations showed overall student improvement, score distributions, the effect of attendance on performance, and detailed analysis of individual questions, such as which questions were answered correctly or incorrectly most often.
To make it easy for the client to present the results, I also created a PowerPoint presentation that included the analysis, key insights, and final visualizations, ready to be shown to stakeholders. I added extra metrics to the Excel file, built an additional Tableau dashboard, and included extra slides in the presentation to explain important trends and observations.
Like this project
Posted Jun 24, 2025
Prepared data, created visualizations, and presentation for educational analysis.
Likes
1
Views
9
Timeline
May 5, 2025 - May 8, 2025