Data Analysis for E-commerce Expansion Strategy
Odefe Oberabor
Contains the text description of a data analysis project
Deleted TRANS_DATE Column because it was empty & we have a valid date

Deleted NO_OF_ITEMS Column It's filled with 0s and blanks.
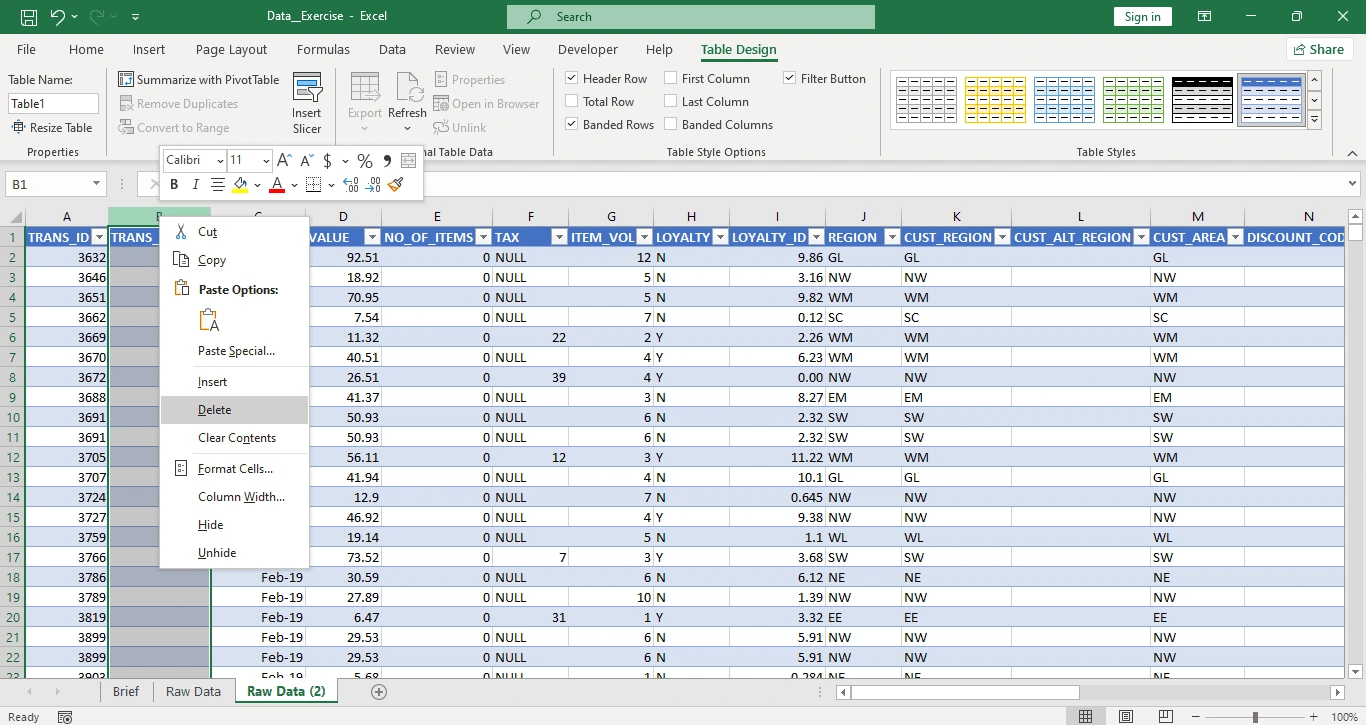
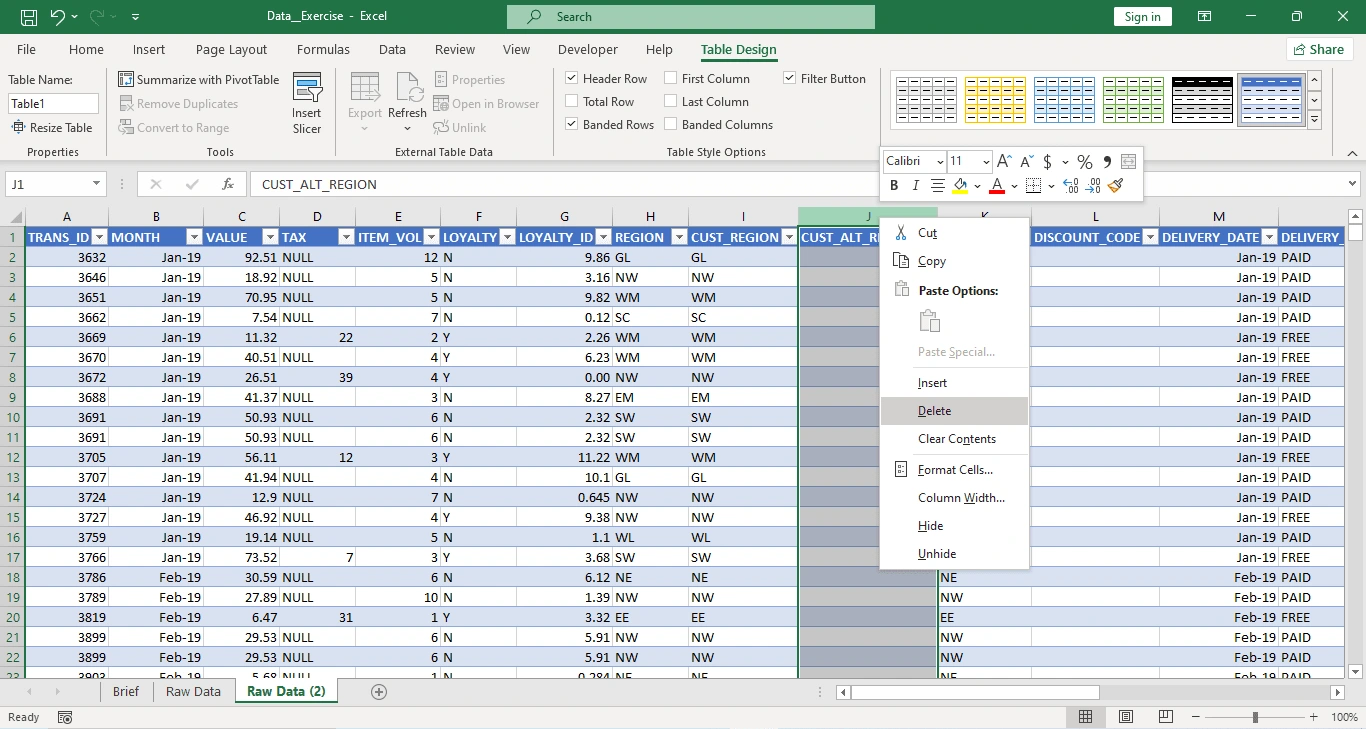
Deleted CUST_ALT_REGION Column because we have valid regional data
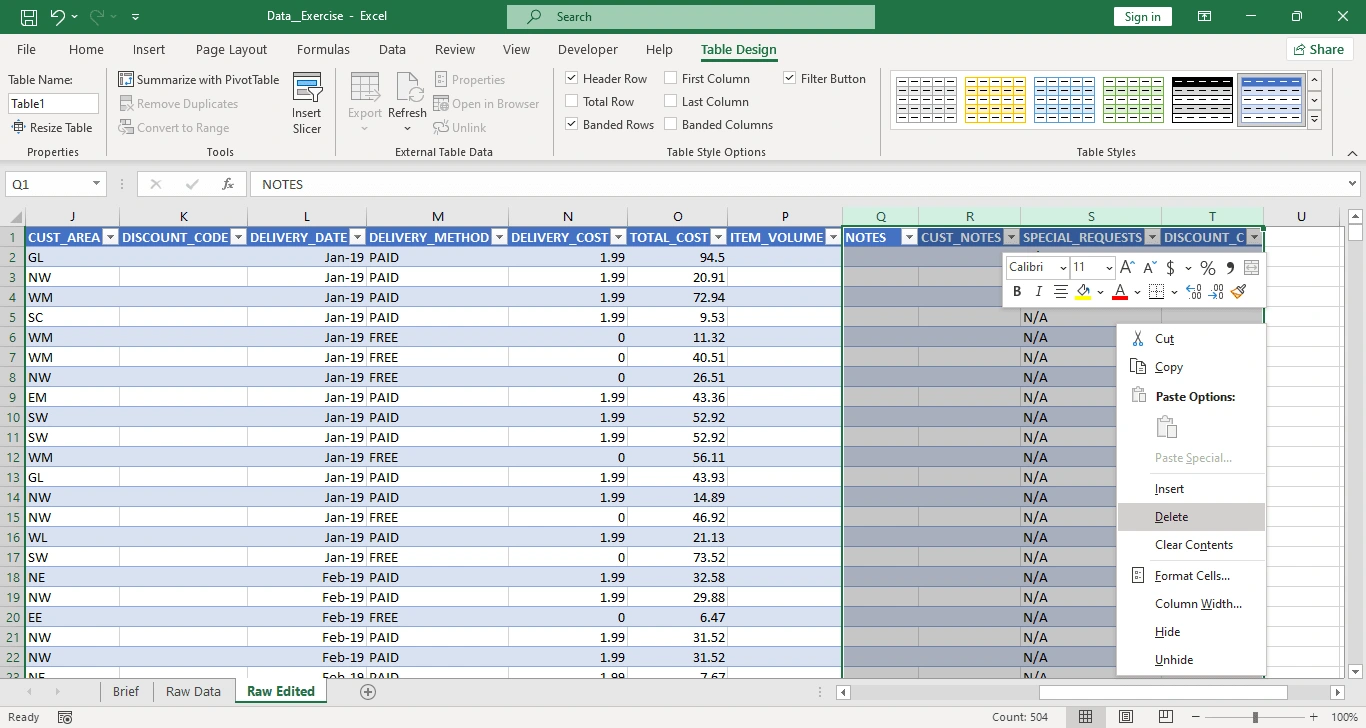
Deleted NOTES,CUST_NOTES,SPECIAL_REQUESTS,DISCOUNT_C Columns
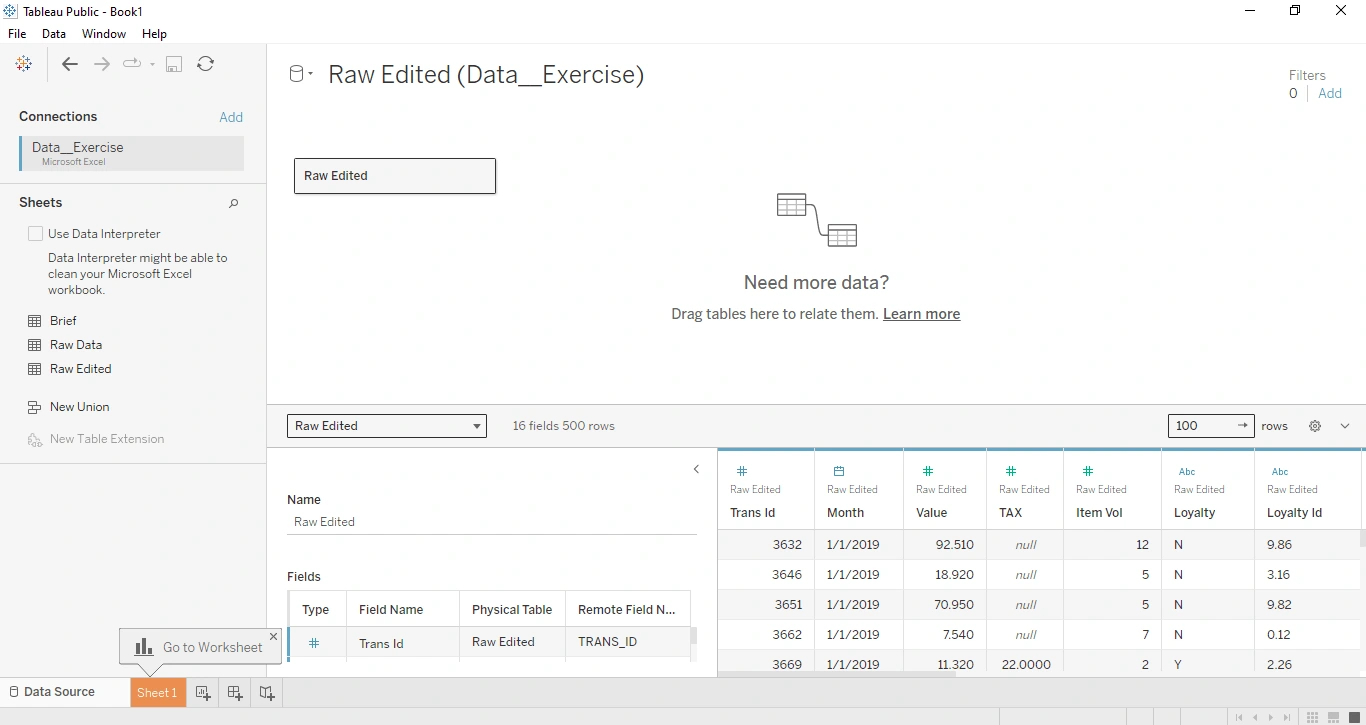
Data is ready for analysis in tableau
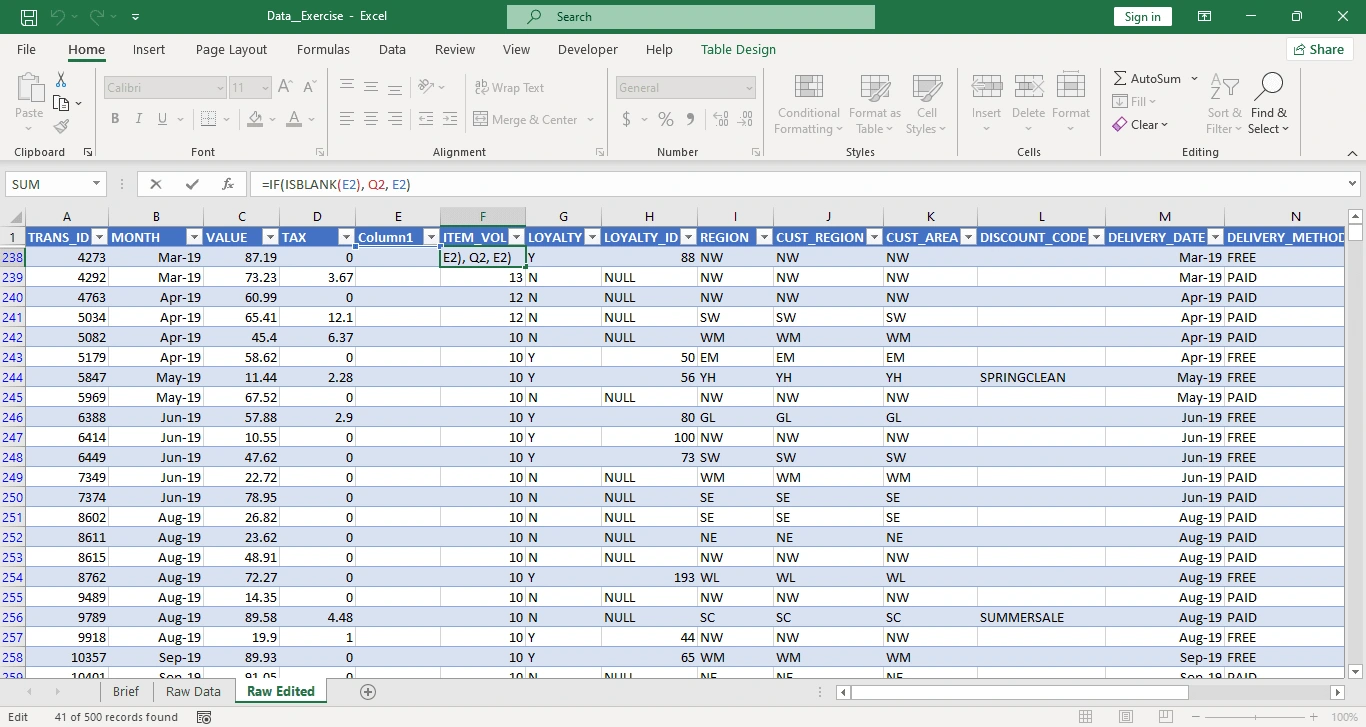
Using the ISBLANK Formula: =IF(ISBLANK(E2), Q2, E2)
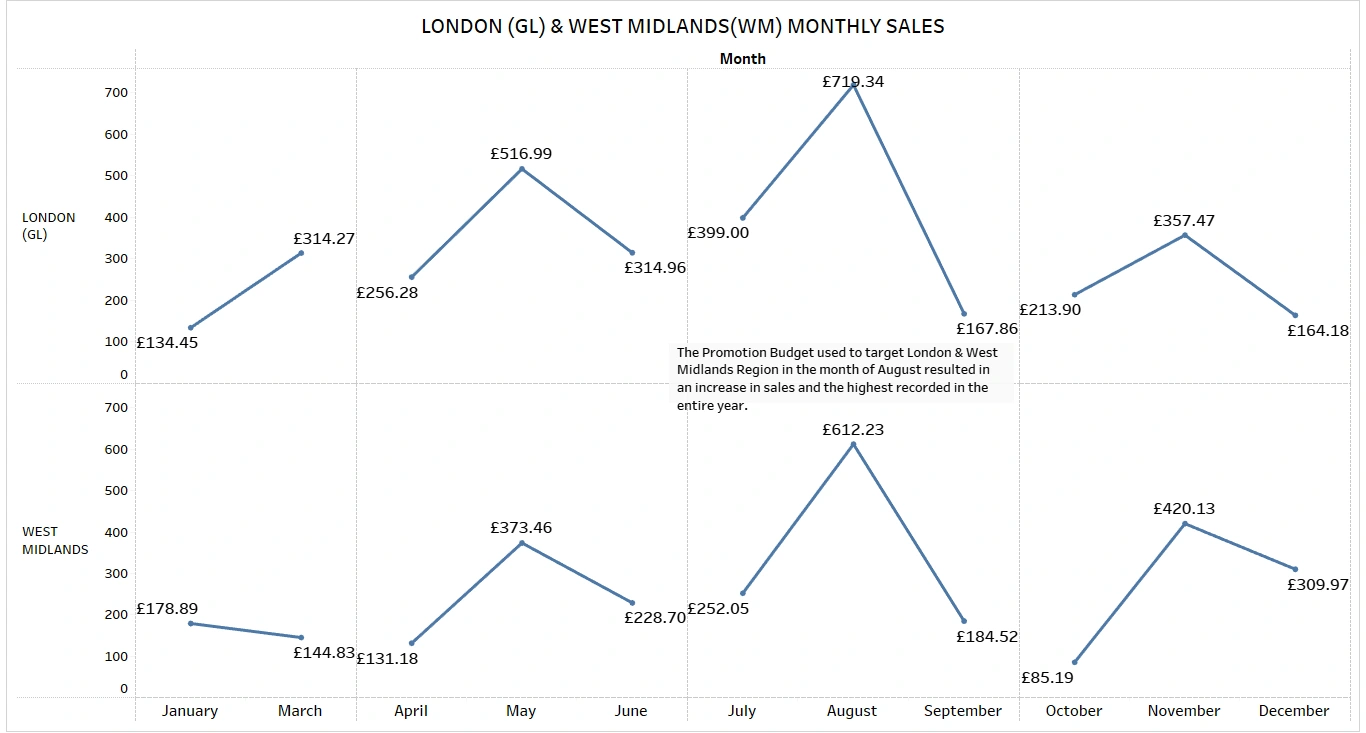
This line chart shows monthly sales for London (GL) and the WM

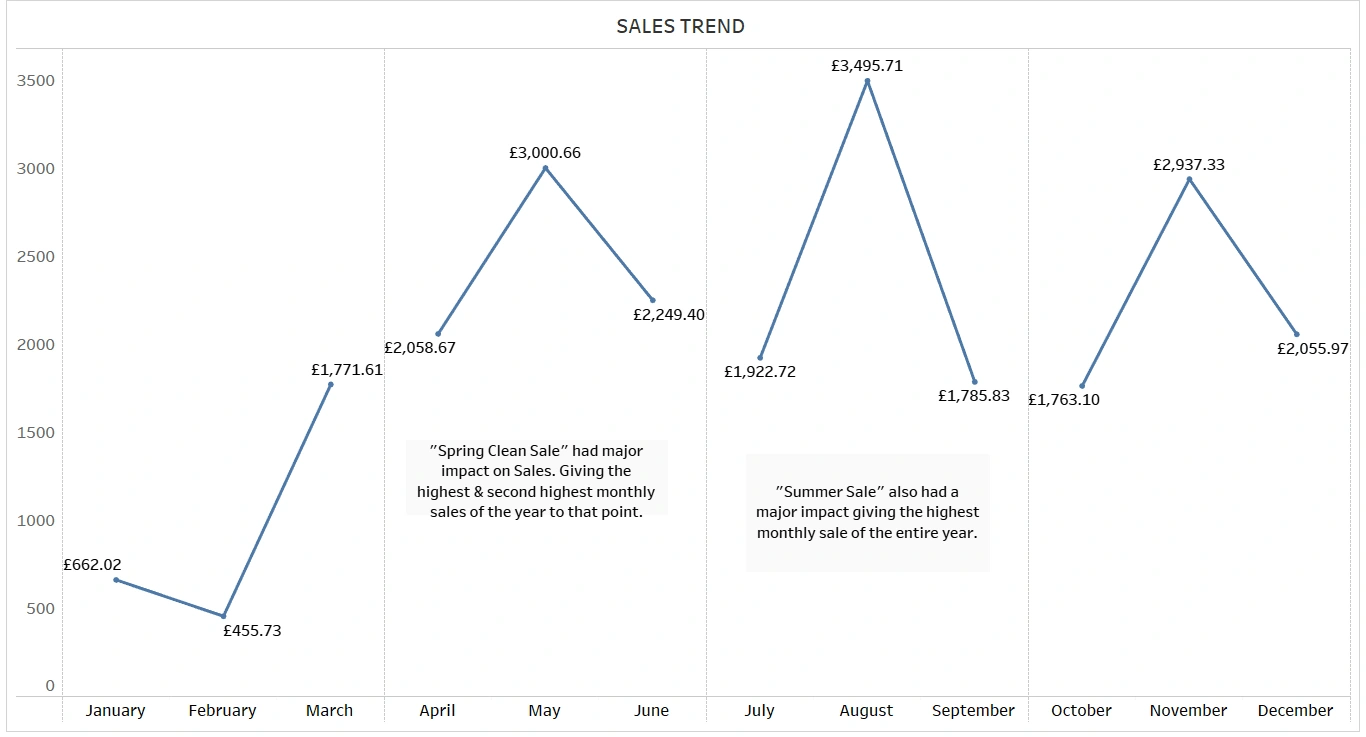
A line chart titled "SALES TREND" displaying monthly sales data
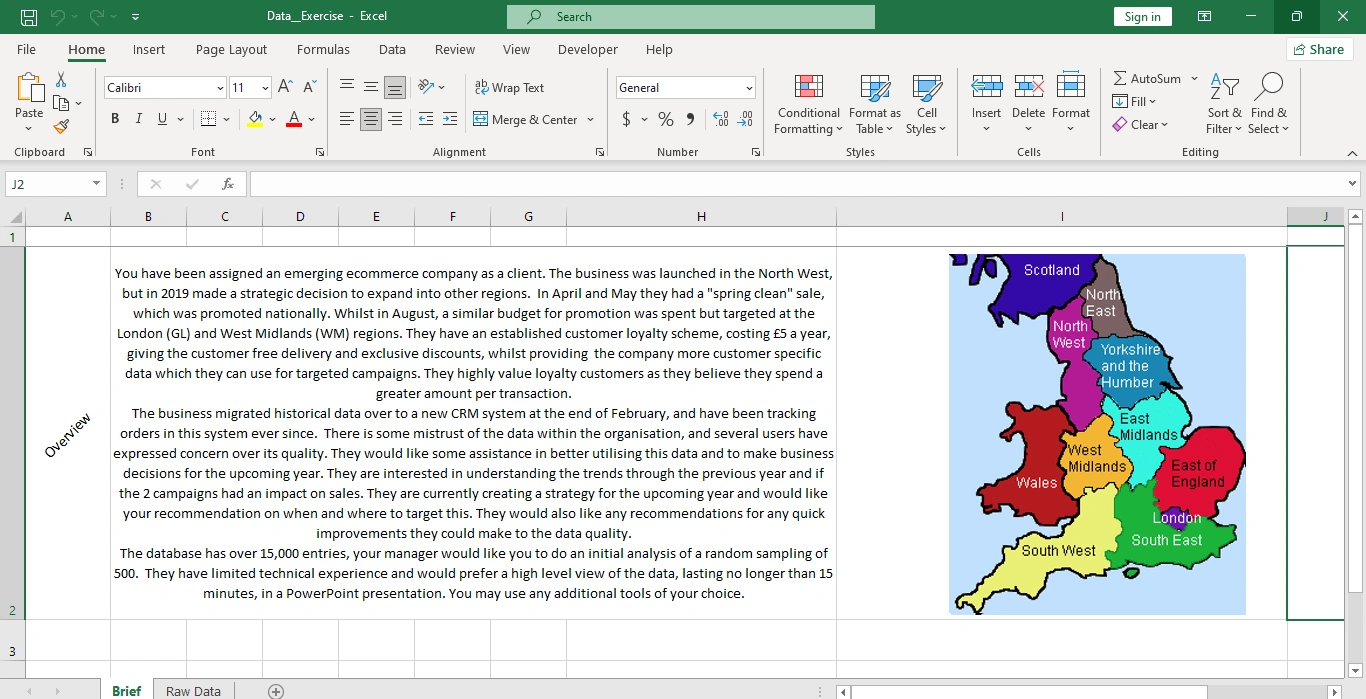
An overview slide from a presentation
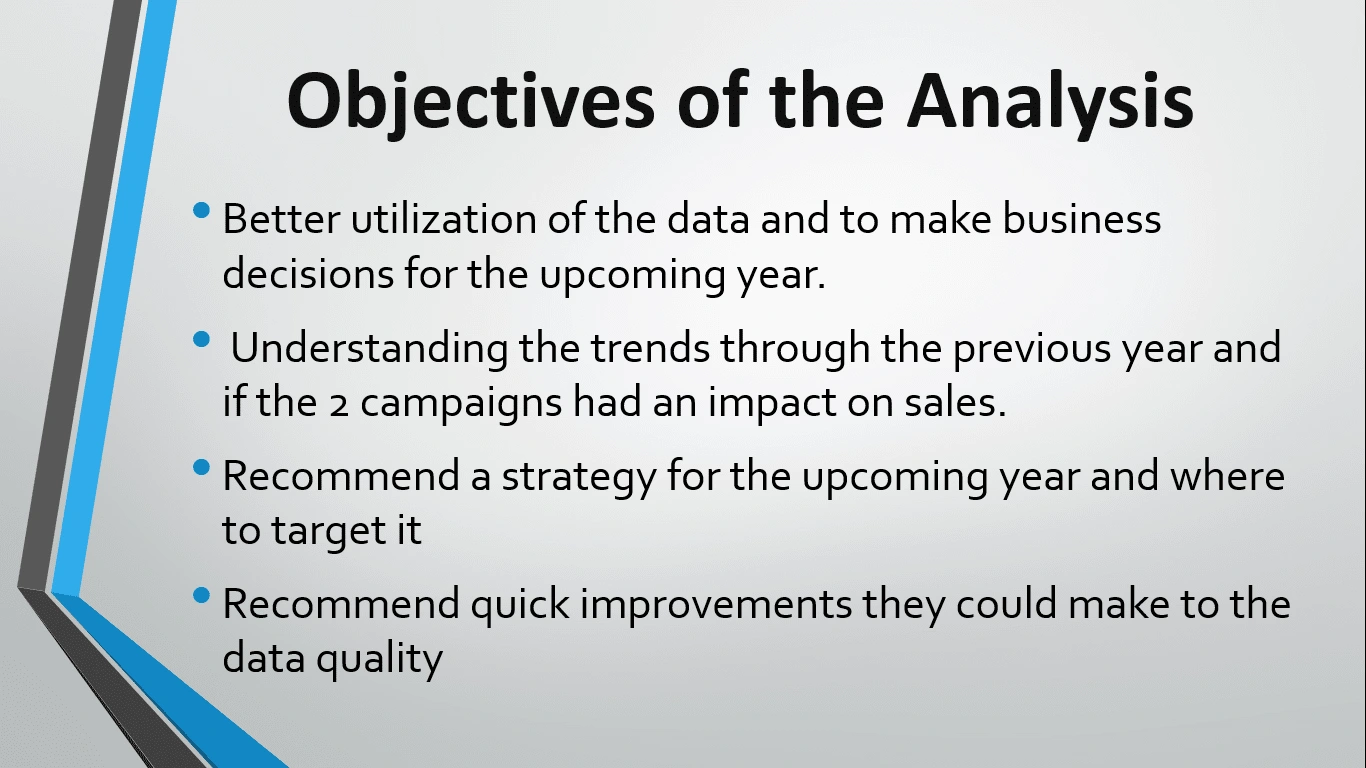
A slide detailing the objectives of the analysis
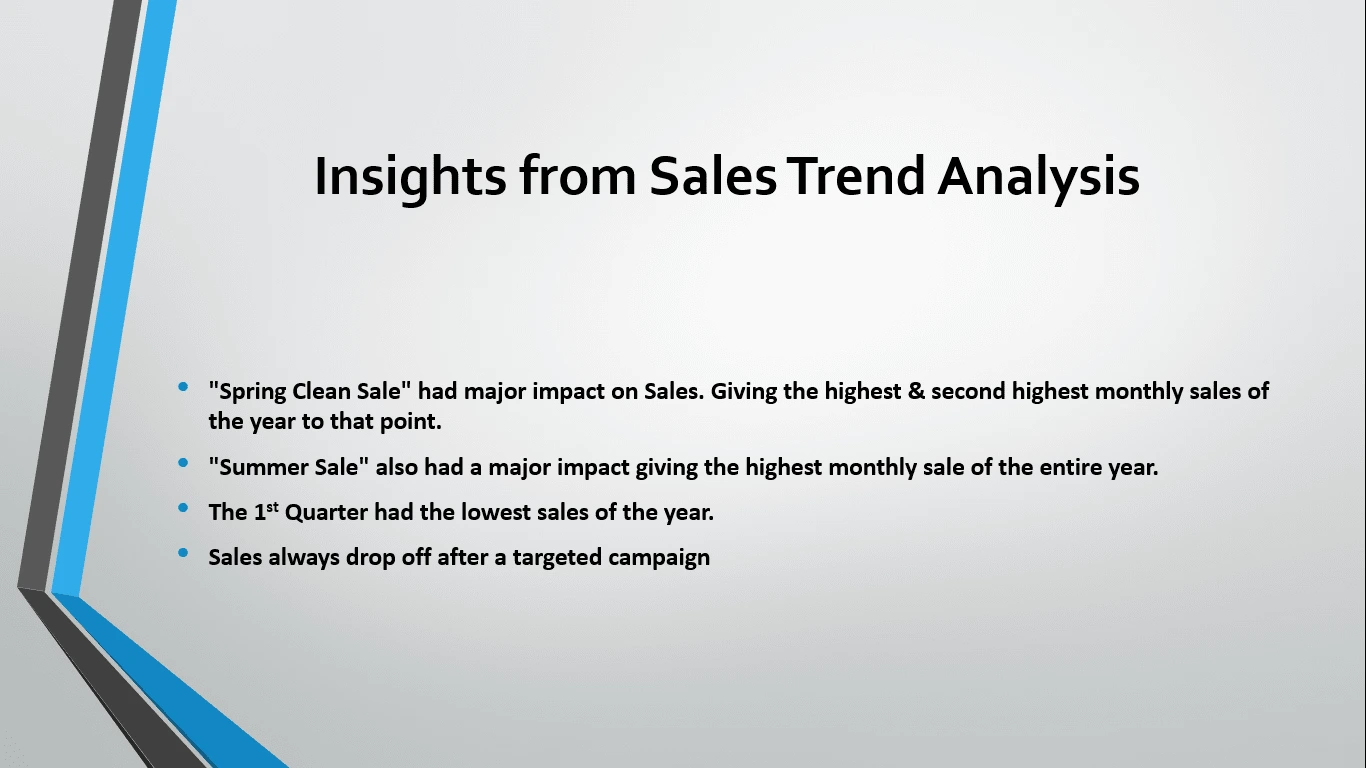
A slide titled Sales Trend Analysis
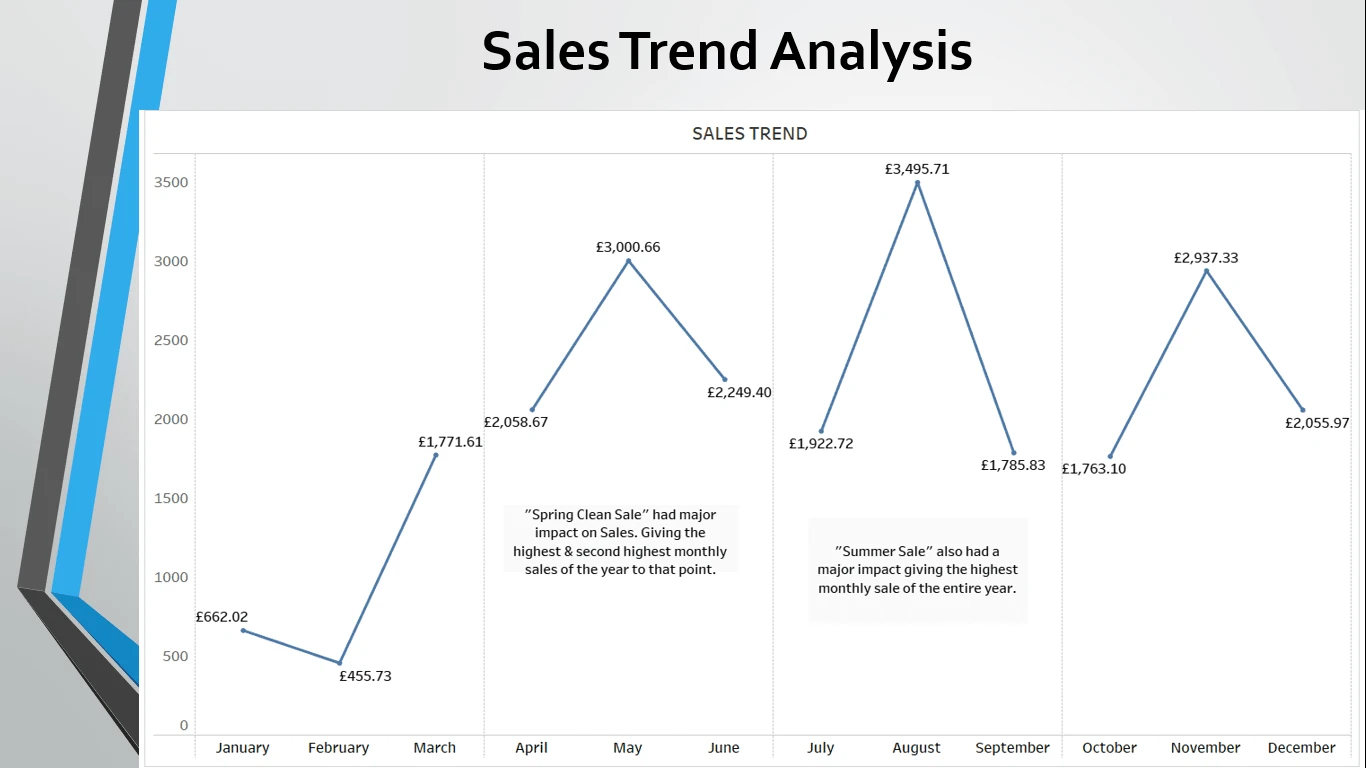
Summarizing key observations from the sales data
Combines quantitative and proportional data visualizations
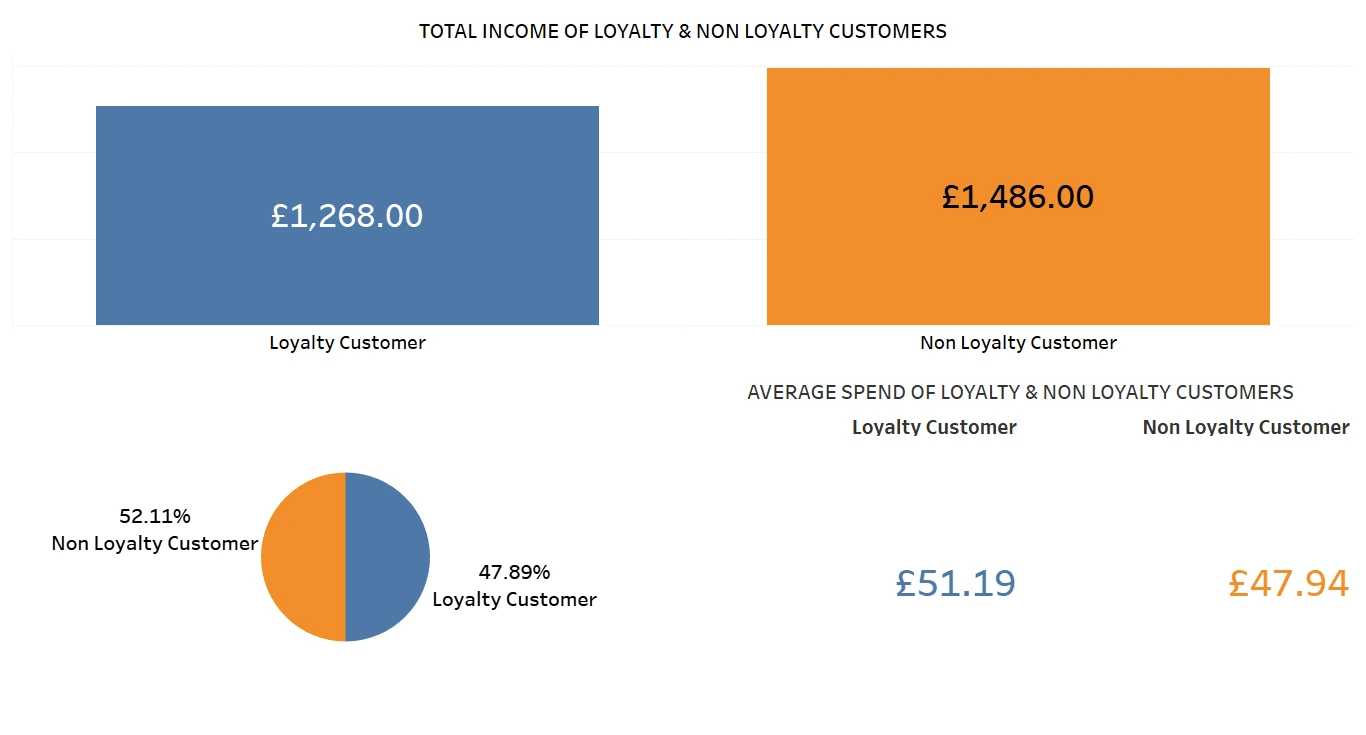
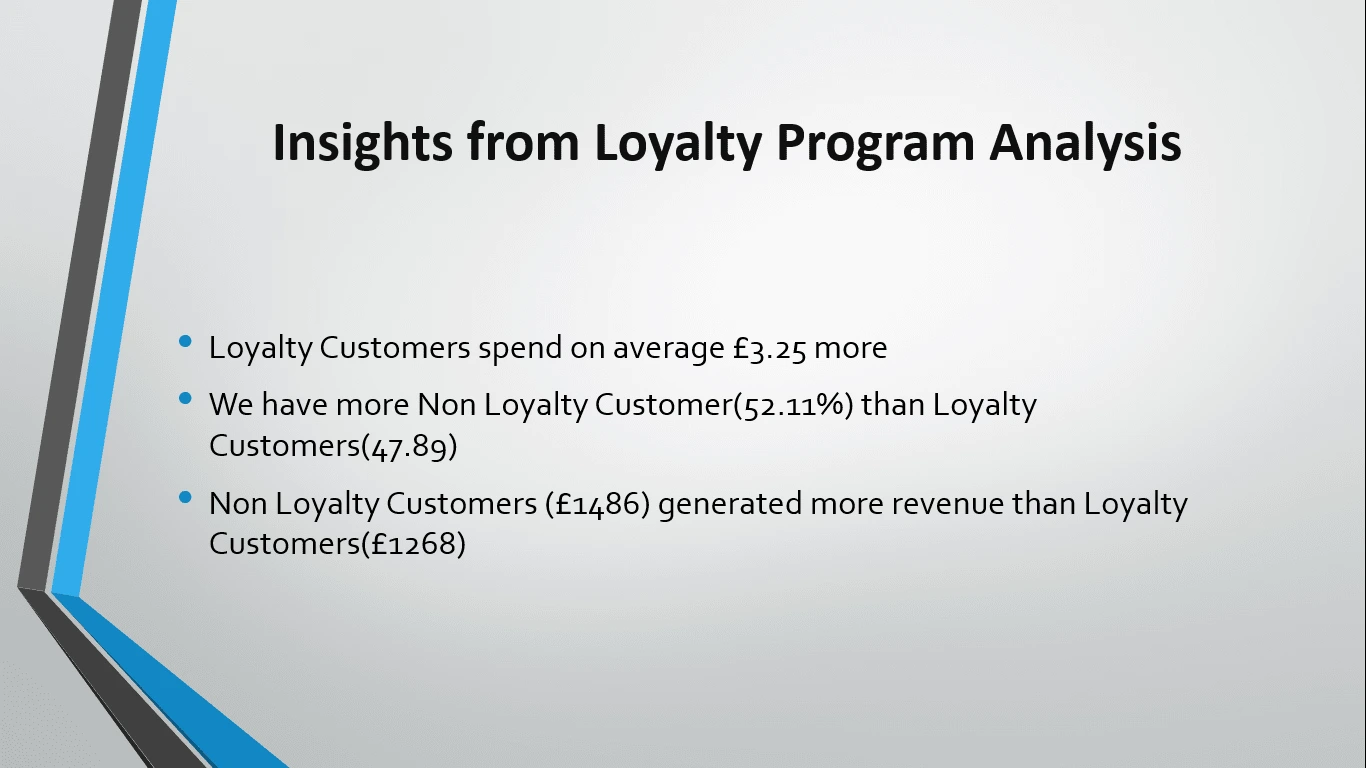
Presents key findings from customer behavior data.
Offering a visual comparison of sales performance across UK regions
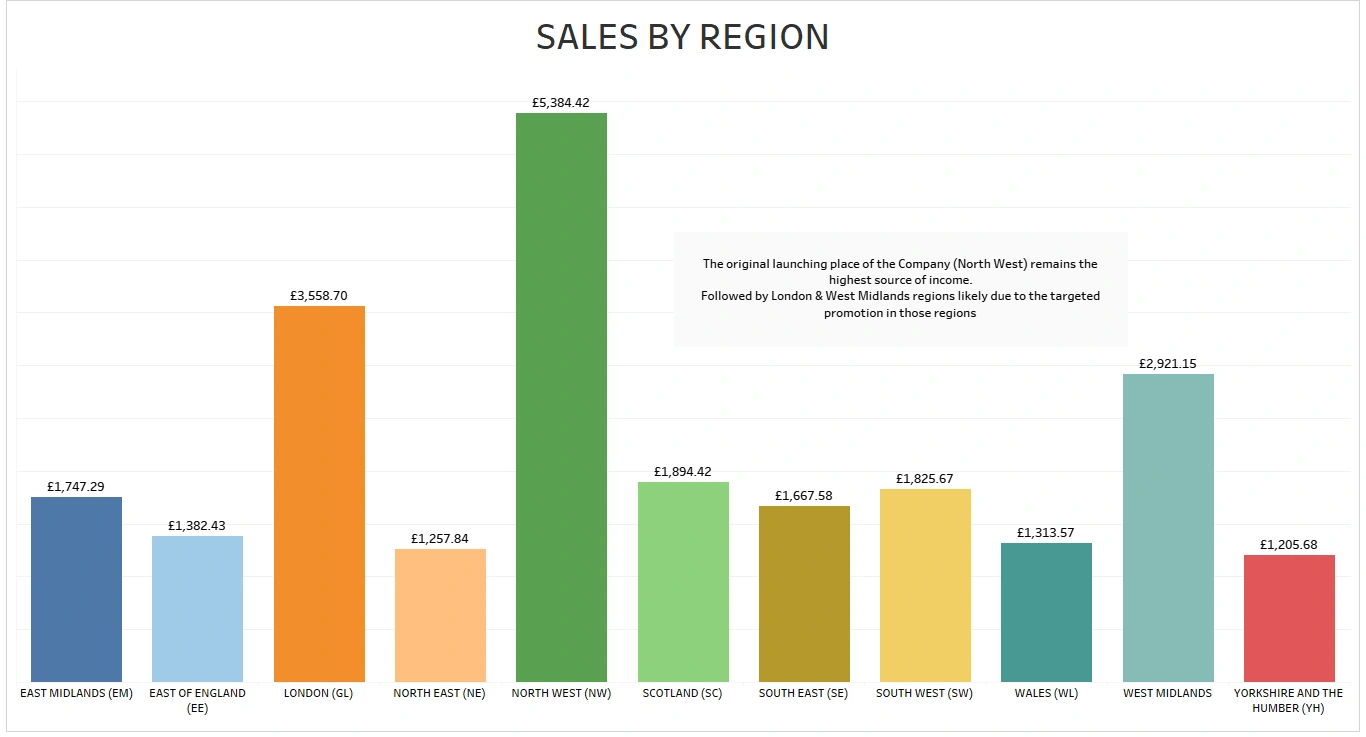
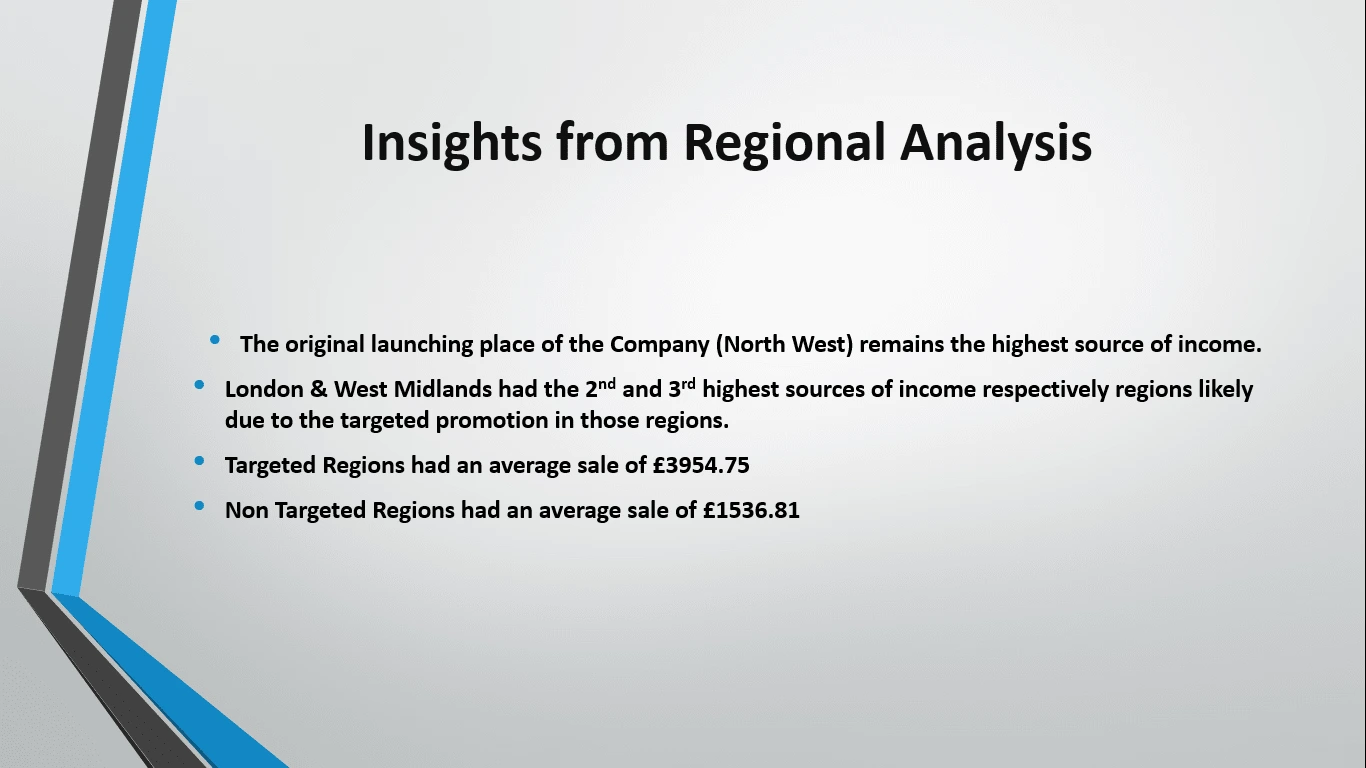
Provides conclusions drawn from the regional analysis
Compares the monthly sales of London and the West Midlands
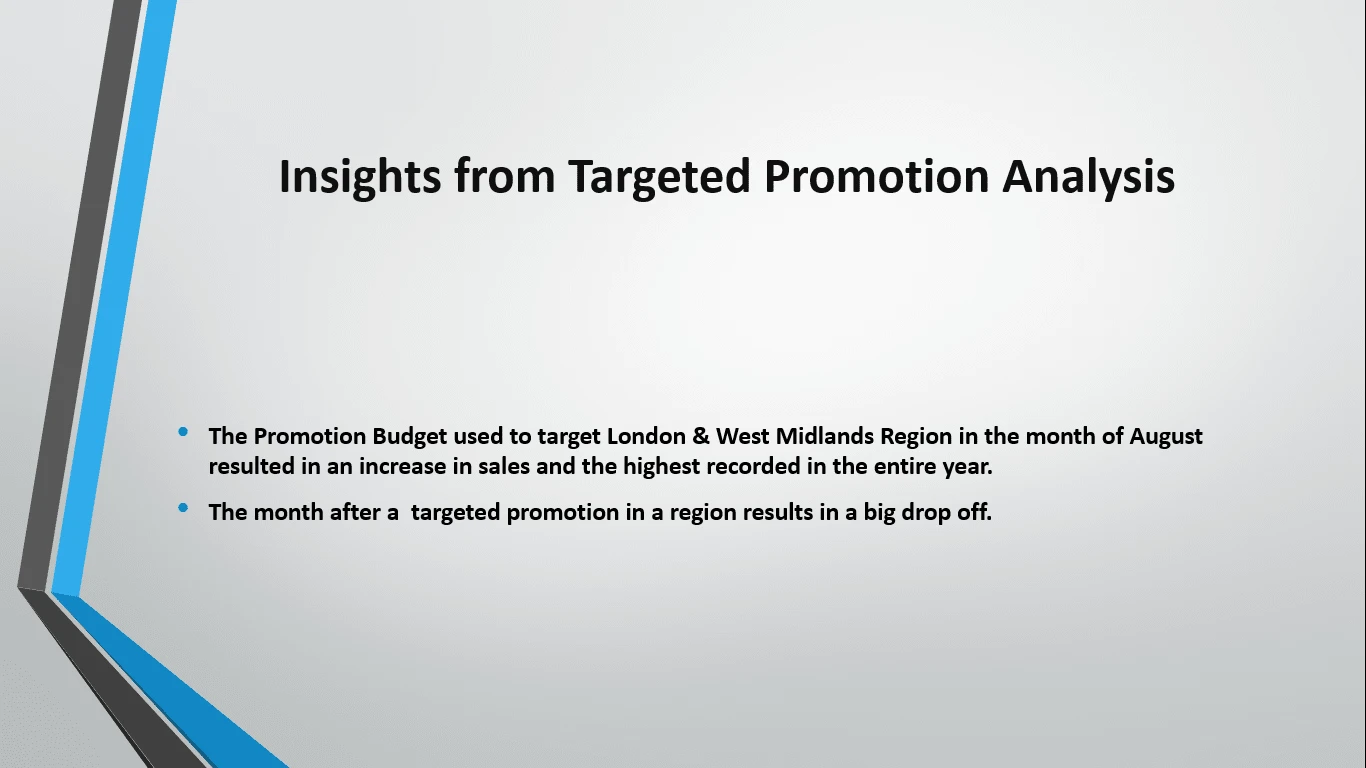
Insights from Targeted Promotion Analysis
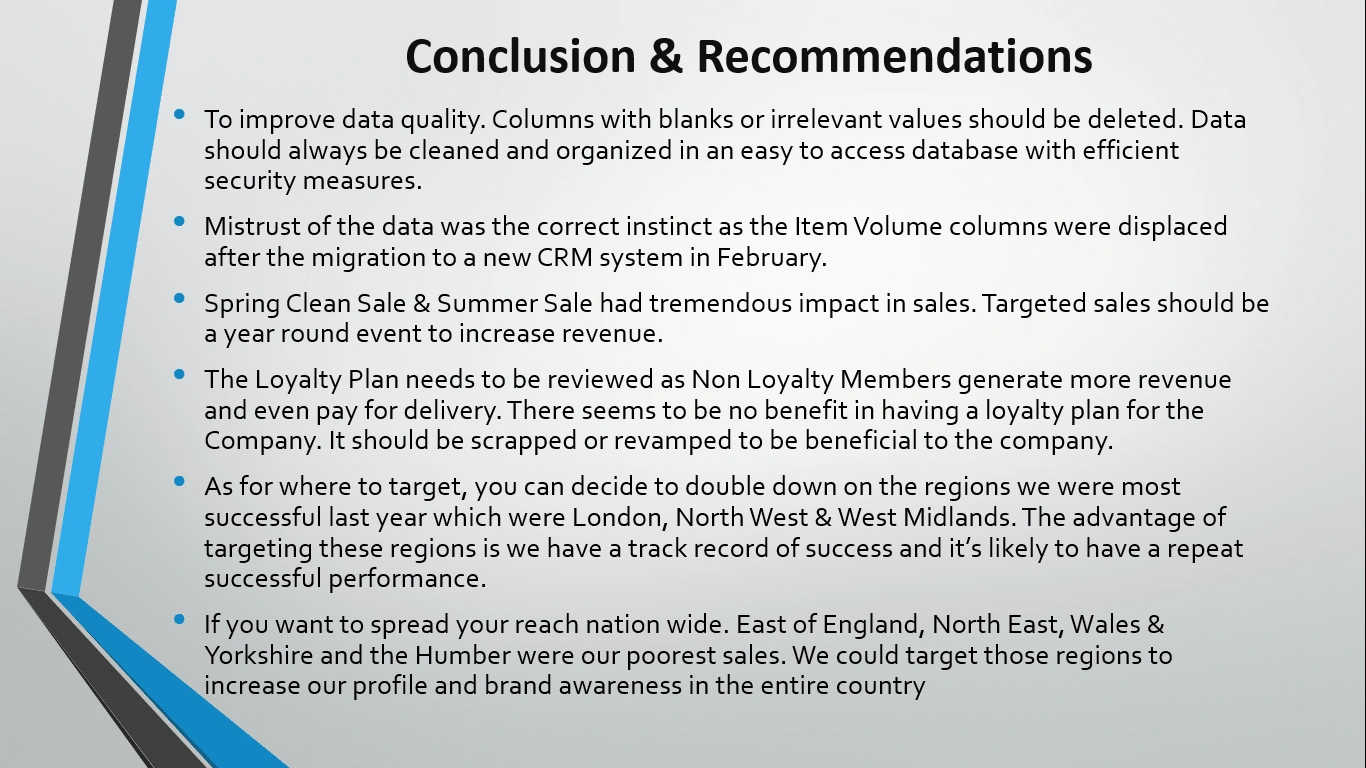
Summarizes the analysis, suggesting improvements in data quality
Like this project
Posted May 20, 2024
Detailed analysis of a rising e-commerce company's operations by scrutinizing customer behavior, sales trends, and the impact of regional marketing initiatives