Power BI Report for Coffee Chain Growth and Sales

Oyeyemi Oluseye


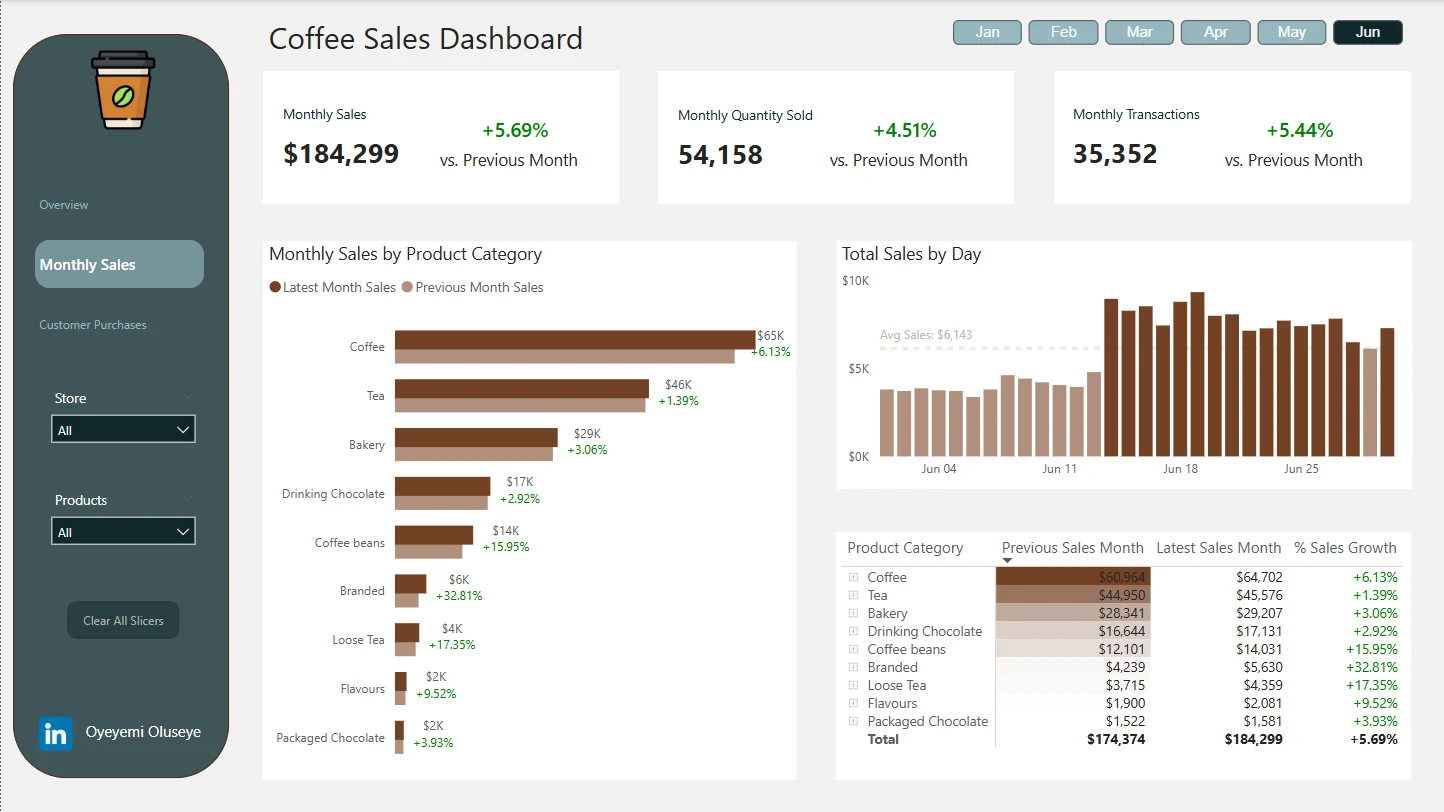
This report was created using power bi to highlight and breakdown important metrics that concerns the growth and sales of this coffee chain.
Insight
Top Performing Product: Coffee is the highest selling product with 34.87% as the total sales, followed by Tea with 25.24% in sales.
Best Performing Store: The Astoria branch takes the lead has the best performing store both in sales and quantity which closely followed by Hell's Kitchen.
Best Selling Month: The month of June has been the best selling month for the business and followed by May. For example, we have a 5.69% in Sales growth compared to May.
Peak Sales Period: The coffee shop enjoyed peak sales in the morning of Wednesday, Friday and Sunday. This helps to understand the buying patterns of our customers and ensuring the availability of our product in those days and time.
Best Performing Product: Our top performing product is the Cappucinno LG with a 6.06% growth rate. It is best for the business to understand why our customers love their Cappucinno LG and ensure that they never run out of stock of this fine product.
Like this project
Posted Jun 16, 2025
This report was created using power bi to highlight and breakdown important metrics that concerns the growth and sales of this coffee chain.