Sales Performance Dashboard
Cansaas Agency
Overview
This exploration presents a Sales Performance Dashboard designed to help teams monitor revenue, tax summaries, and operational activity within a centralized interface. The product is focused on supporting decision-making through structured visibility of sales metrics and store performance. It is intended for business owners and operational teams who require clarity across financial summaries and order tracking. The experience emphasizes organization and readability in a data-intensive environment.
The Challenge
Sales dashboards frequently introduce complexity through dense metrics, overlapping indicators, and scattered performance data. Users may struggle to distinguish between strategic insights and operational details when everything competes for attention. The challenge lies in presenting comprehensive sales information without overwhelming the user. Establishing clarity within layered financial and transactional data is a common issue in performance monitoring tools.
Design Approach
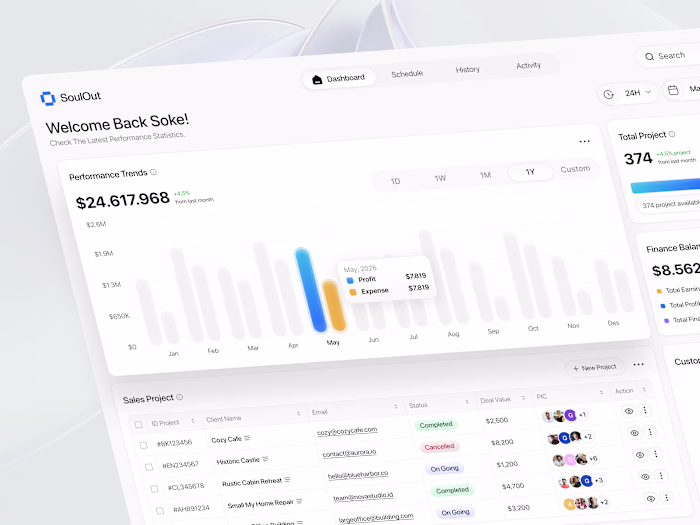
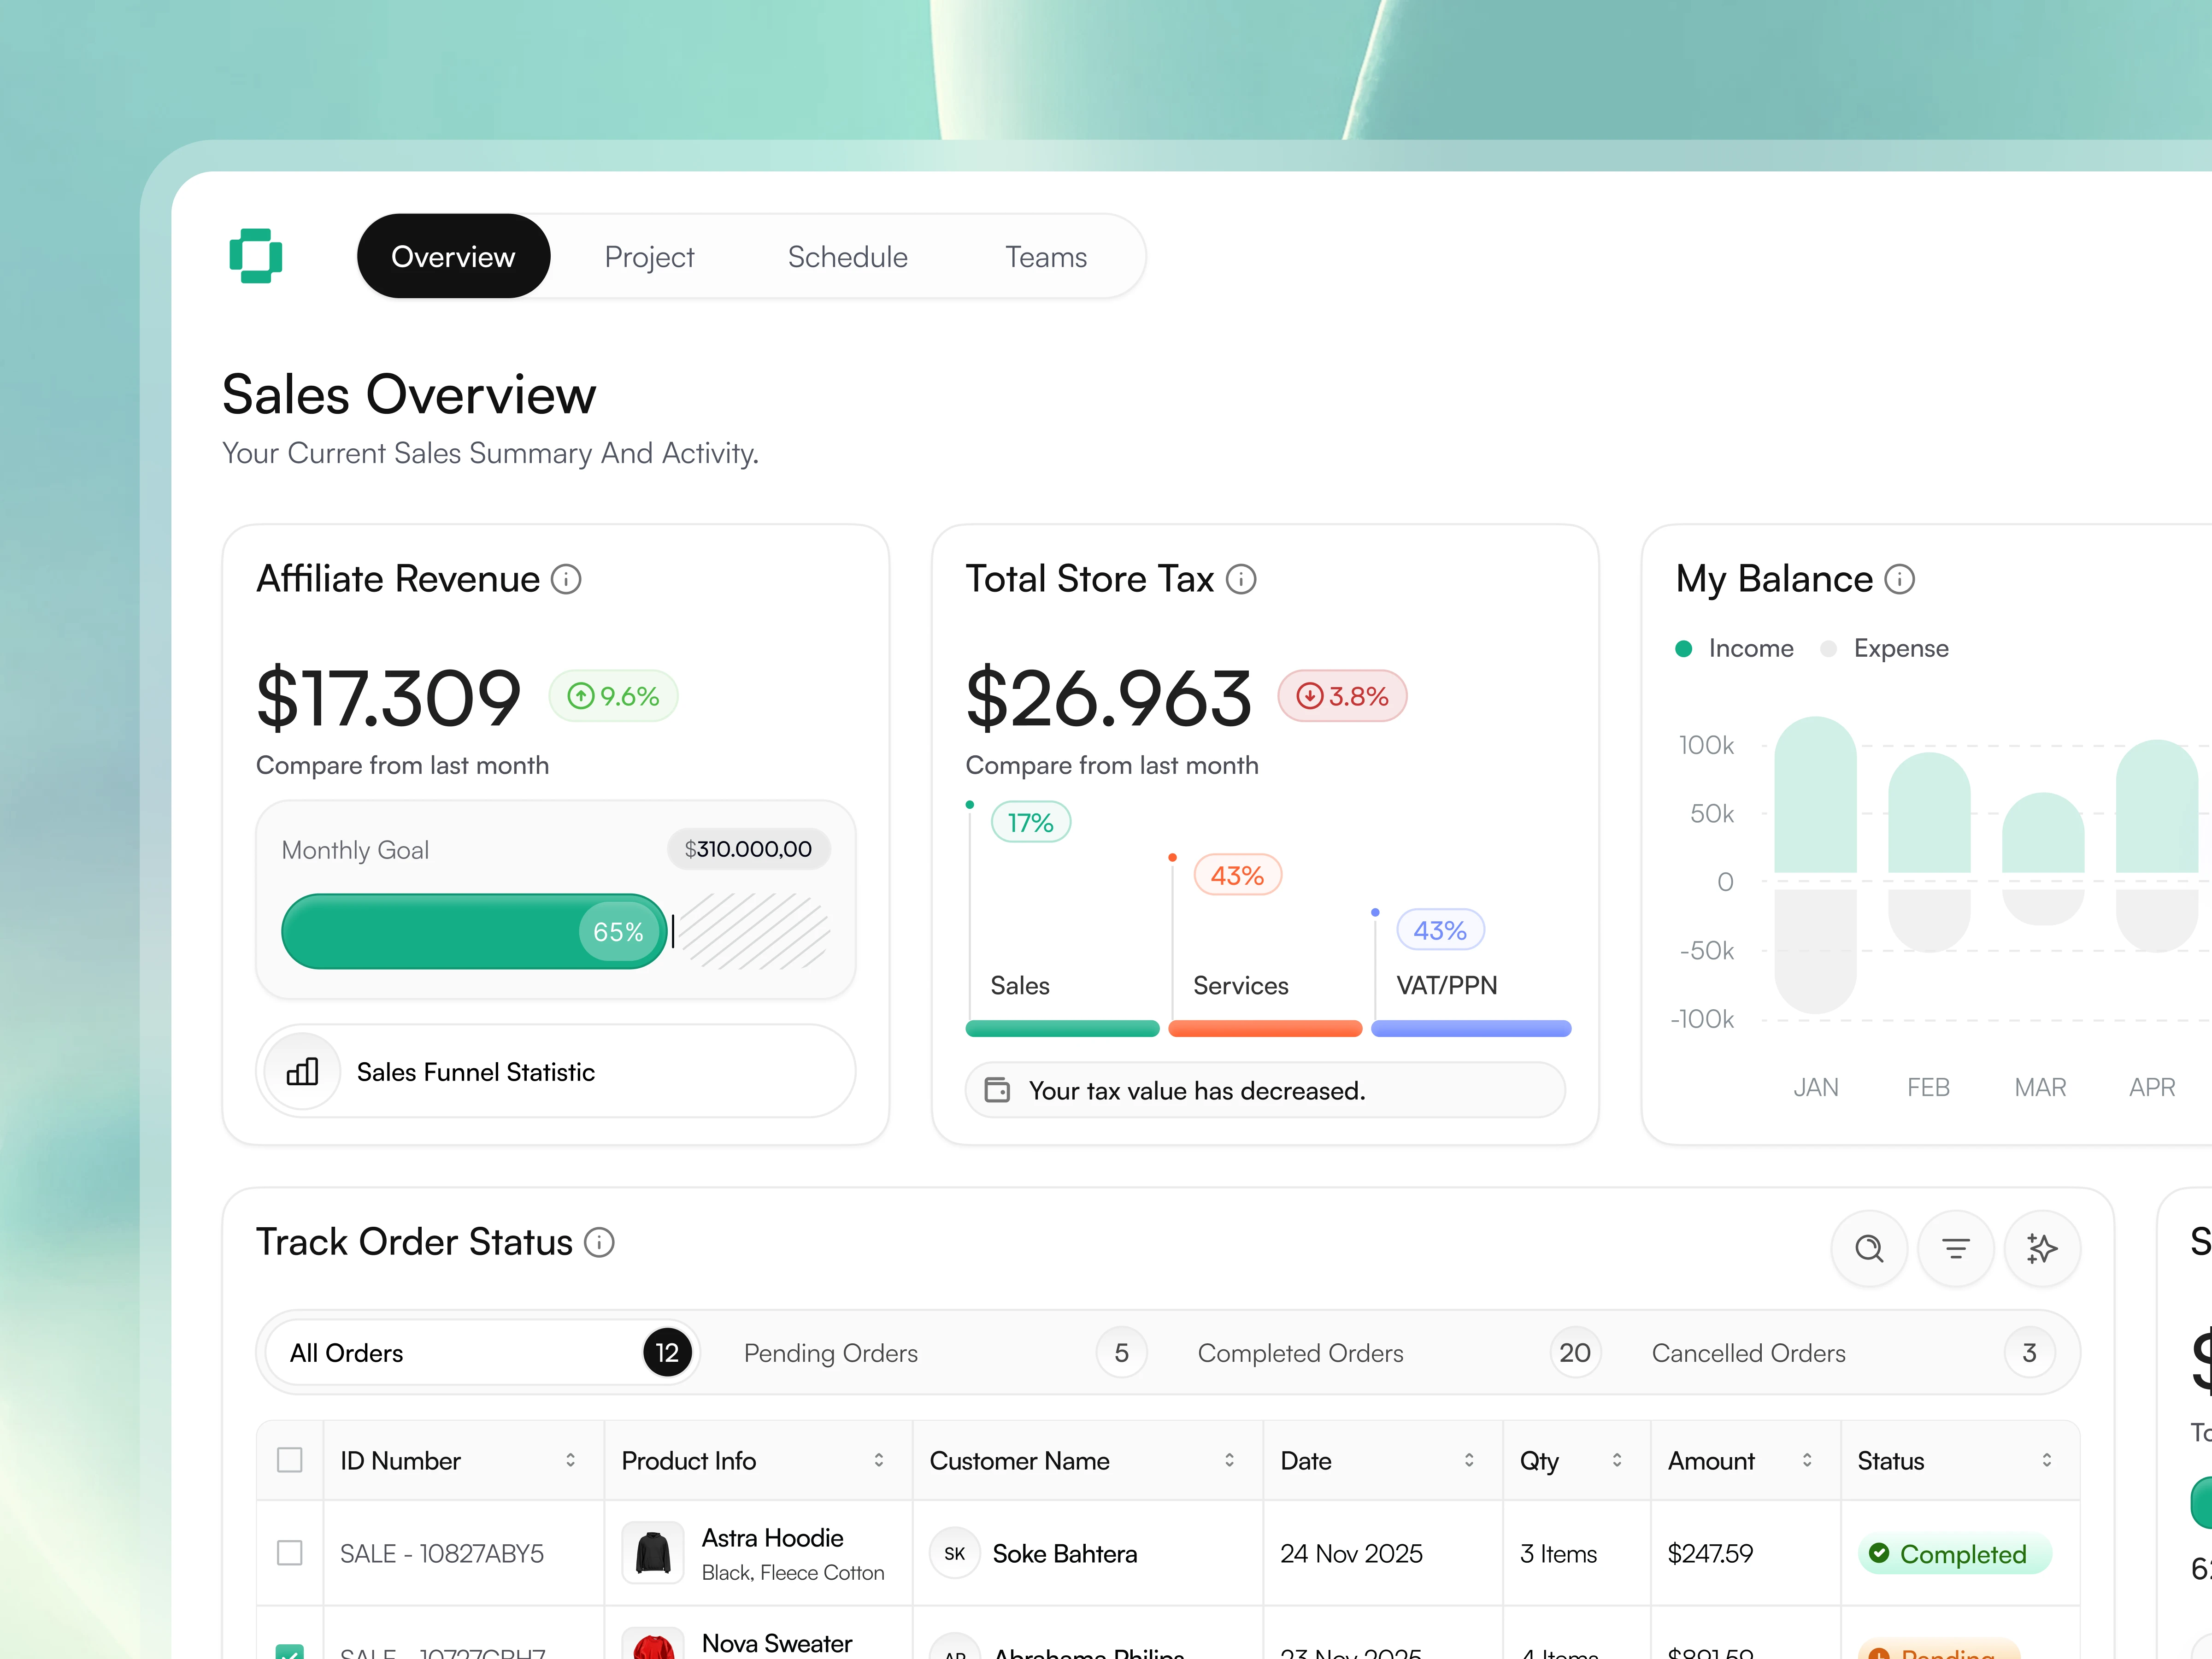
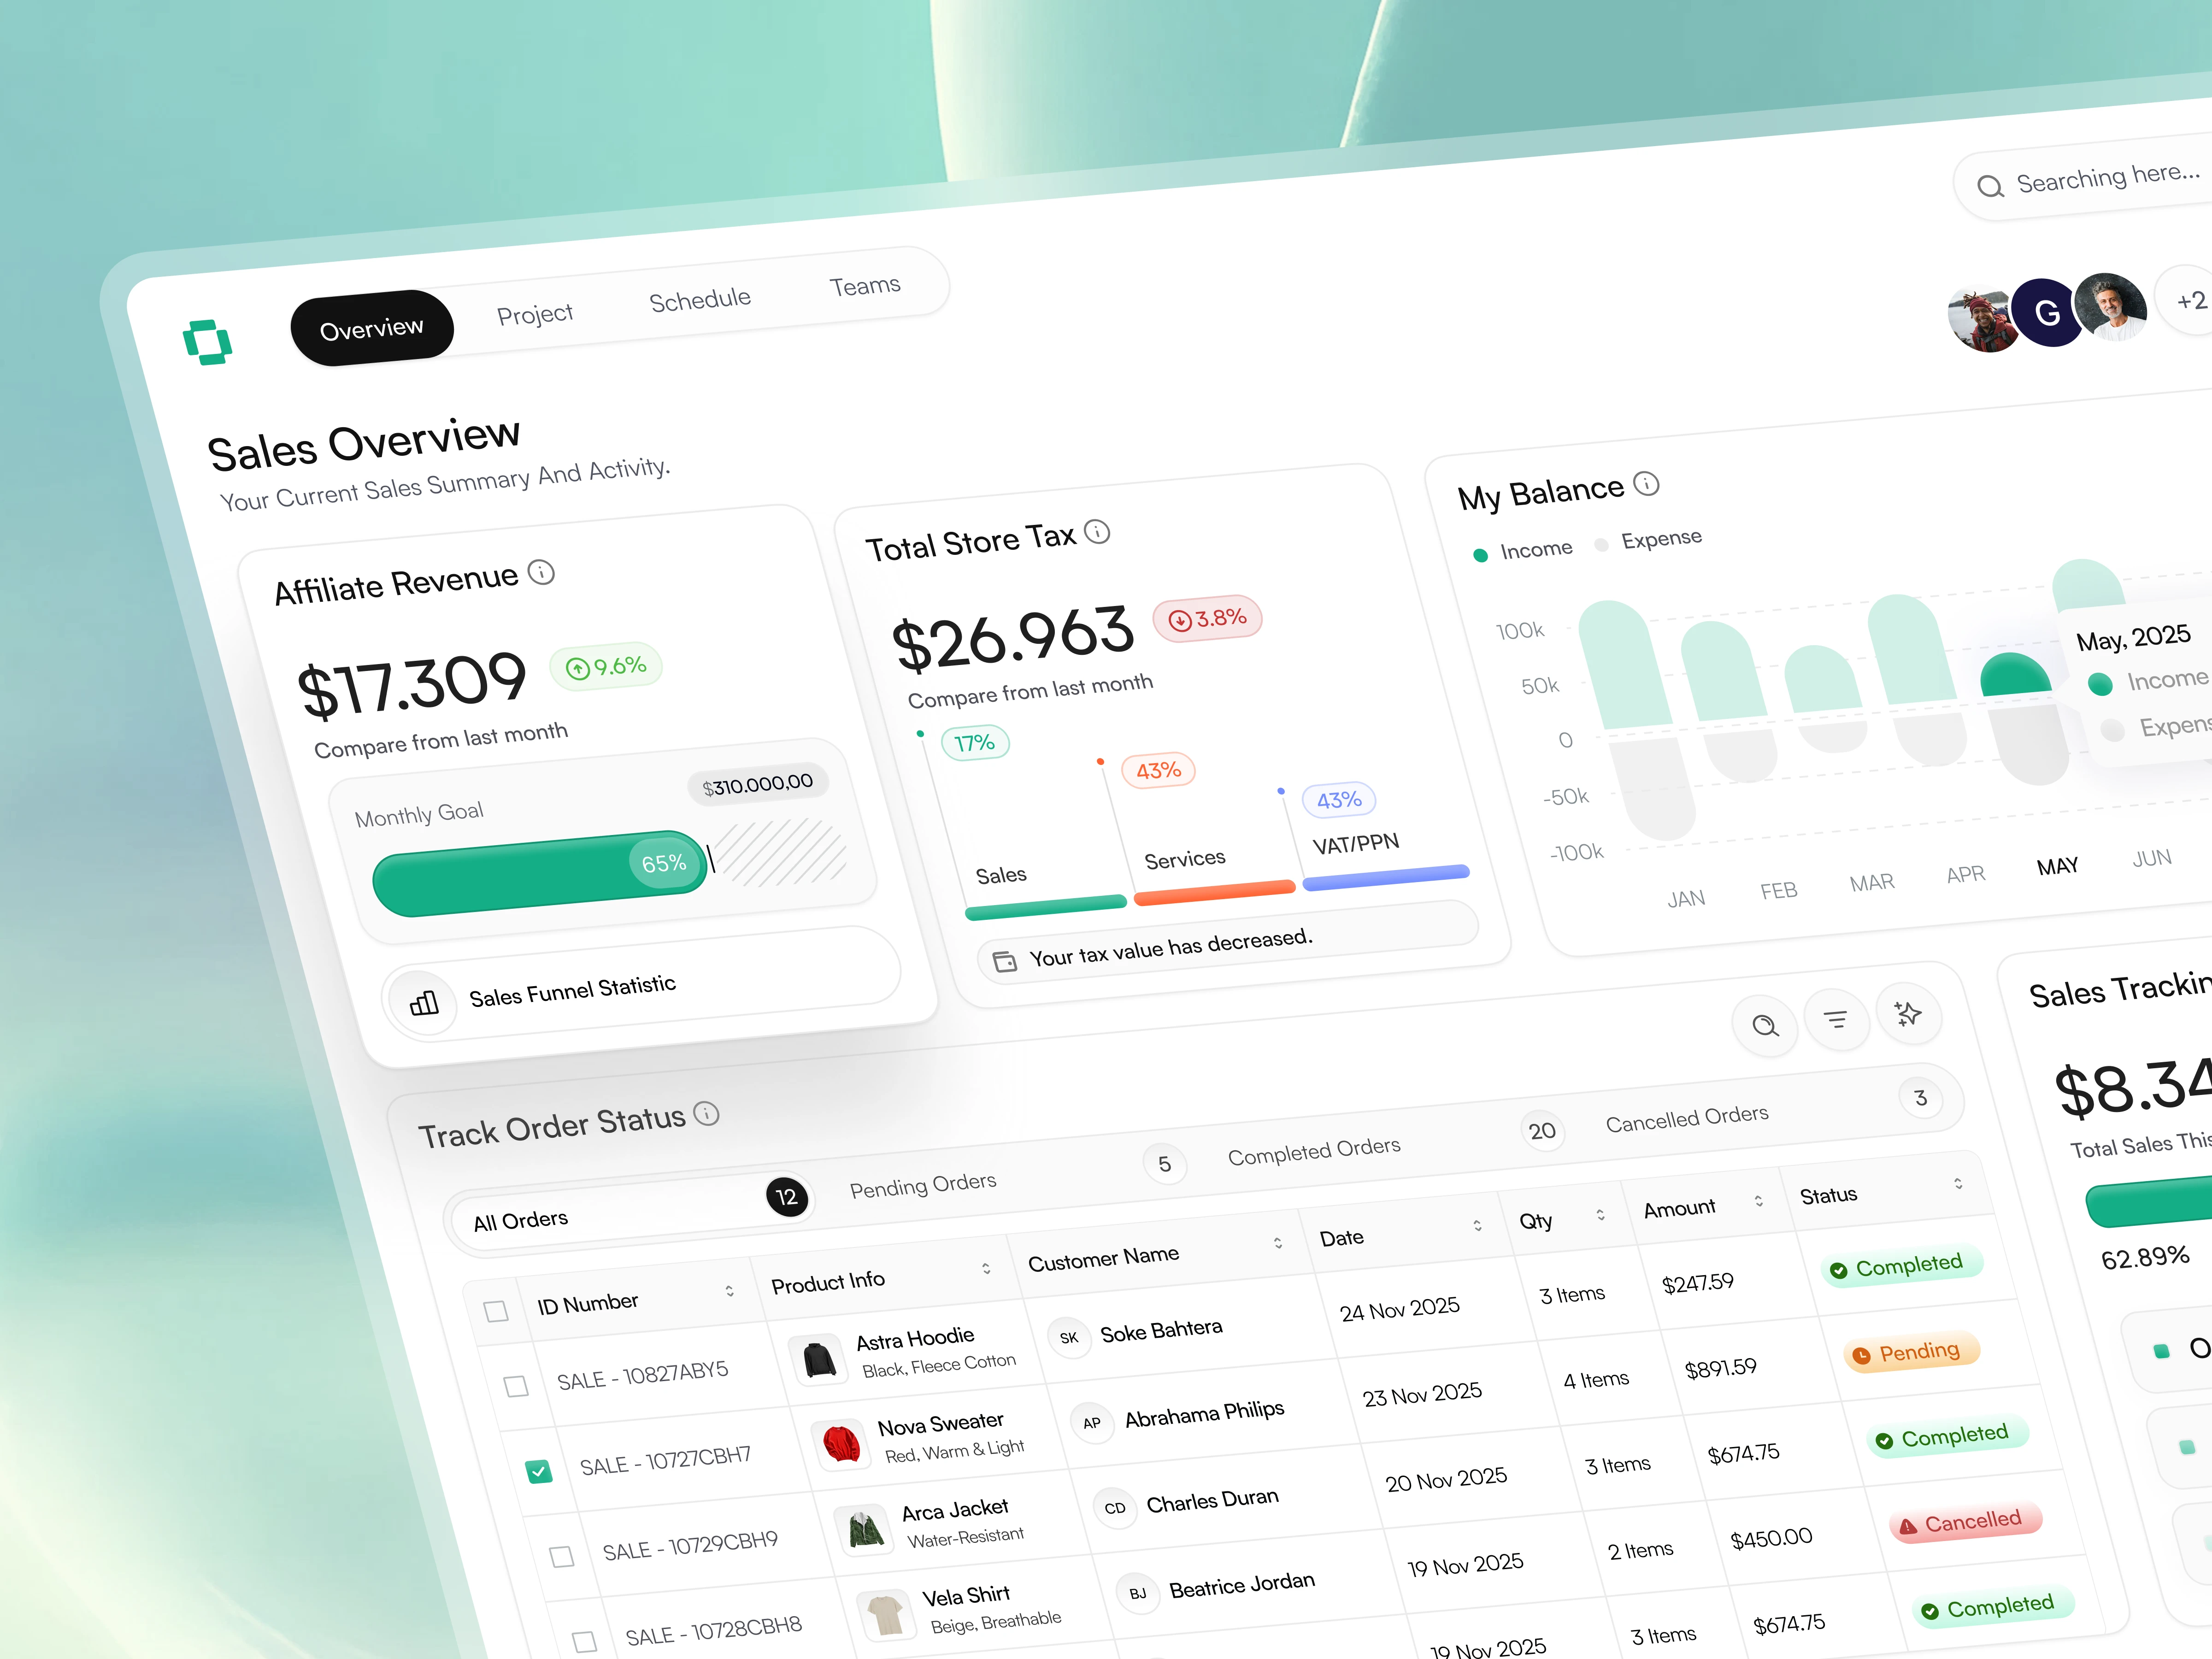
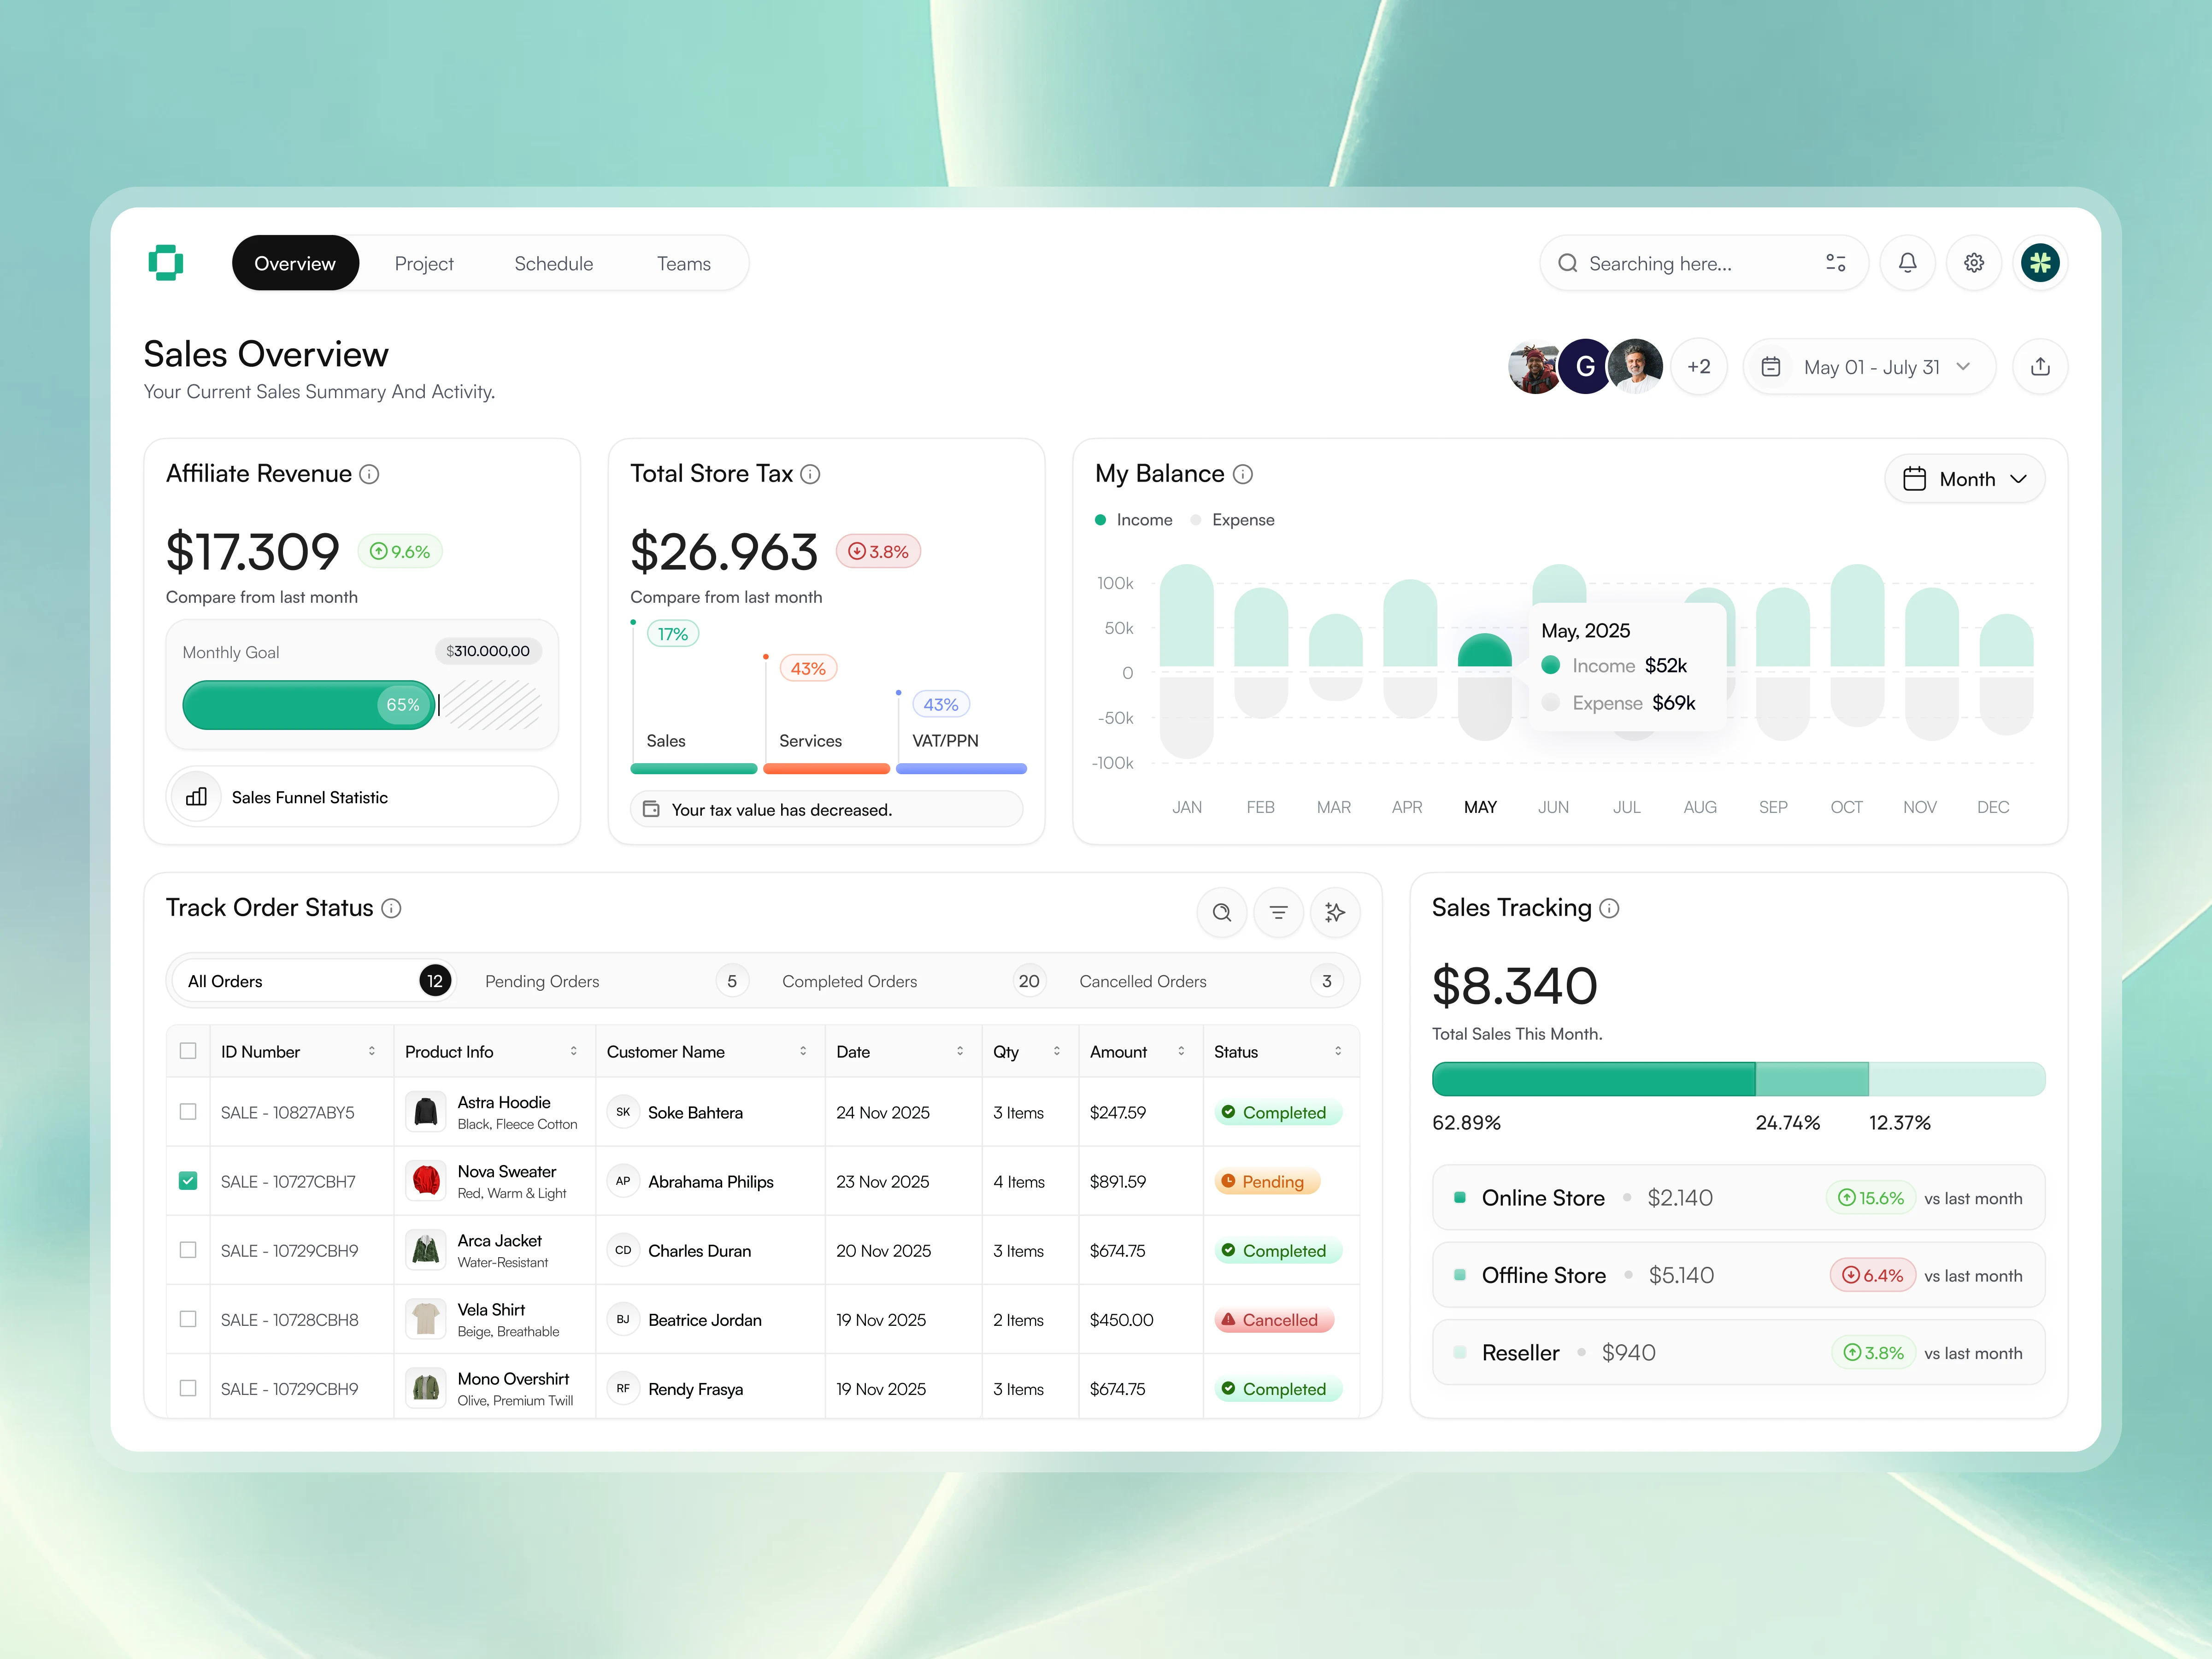
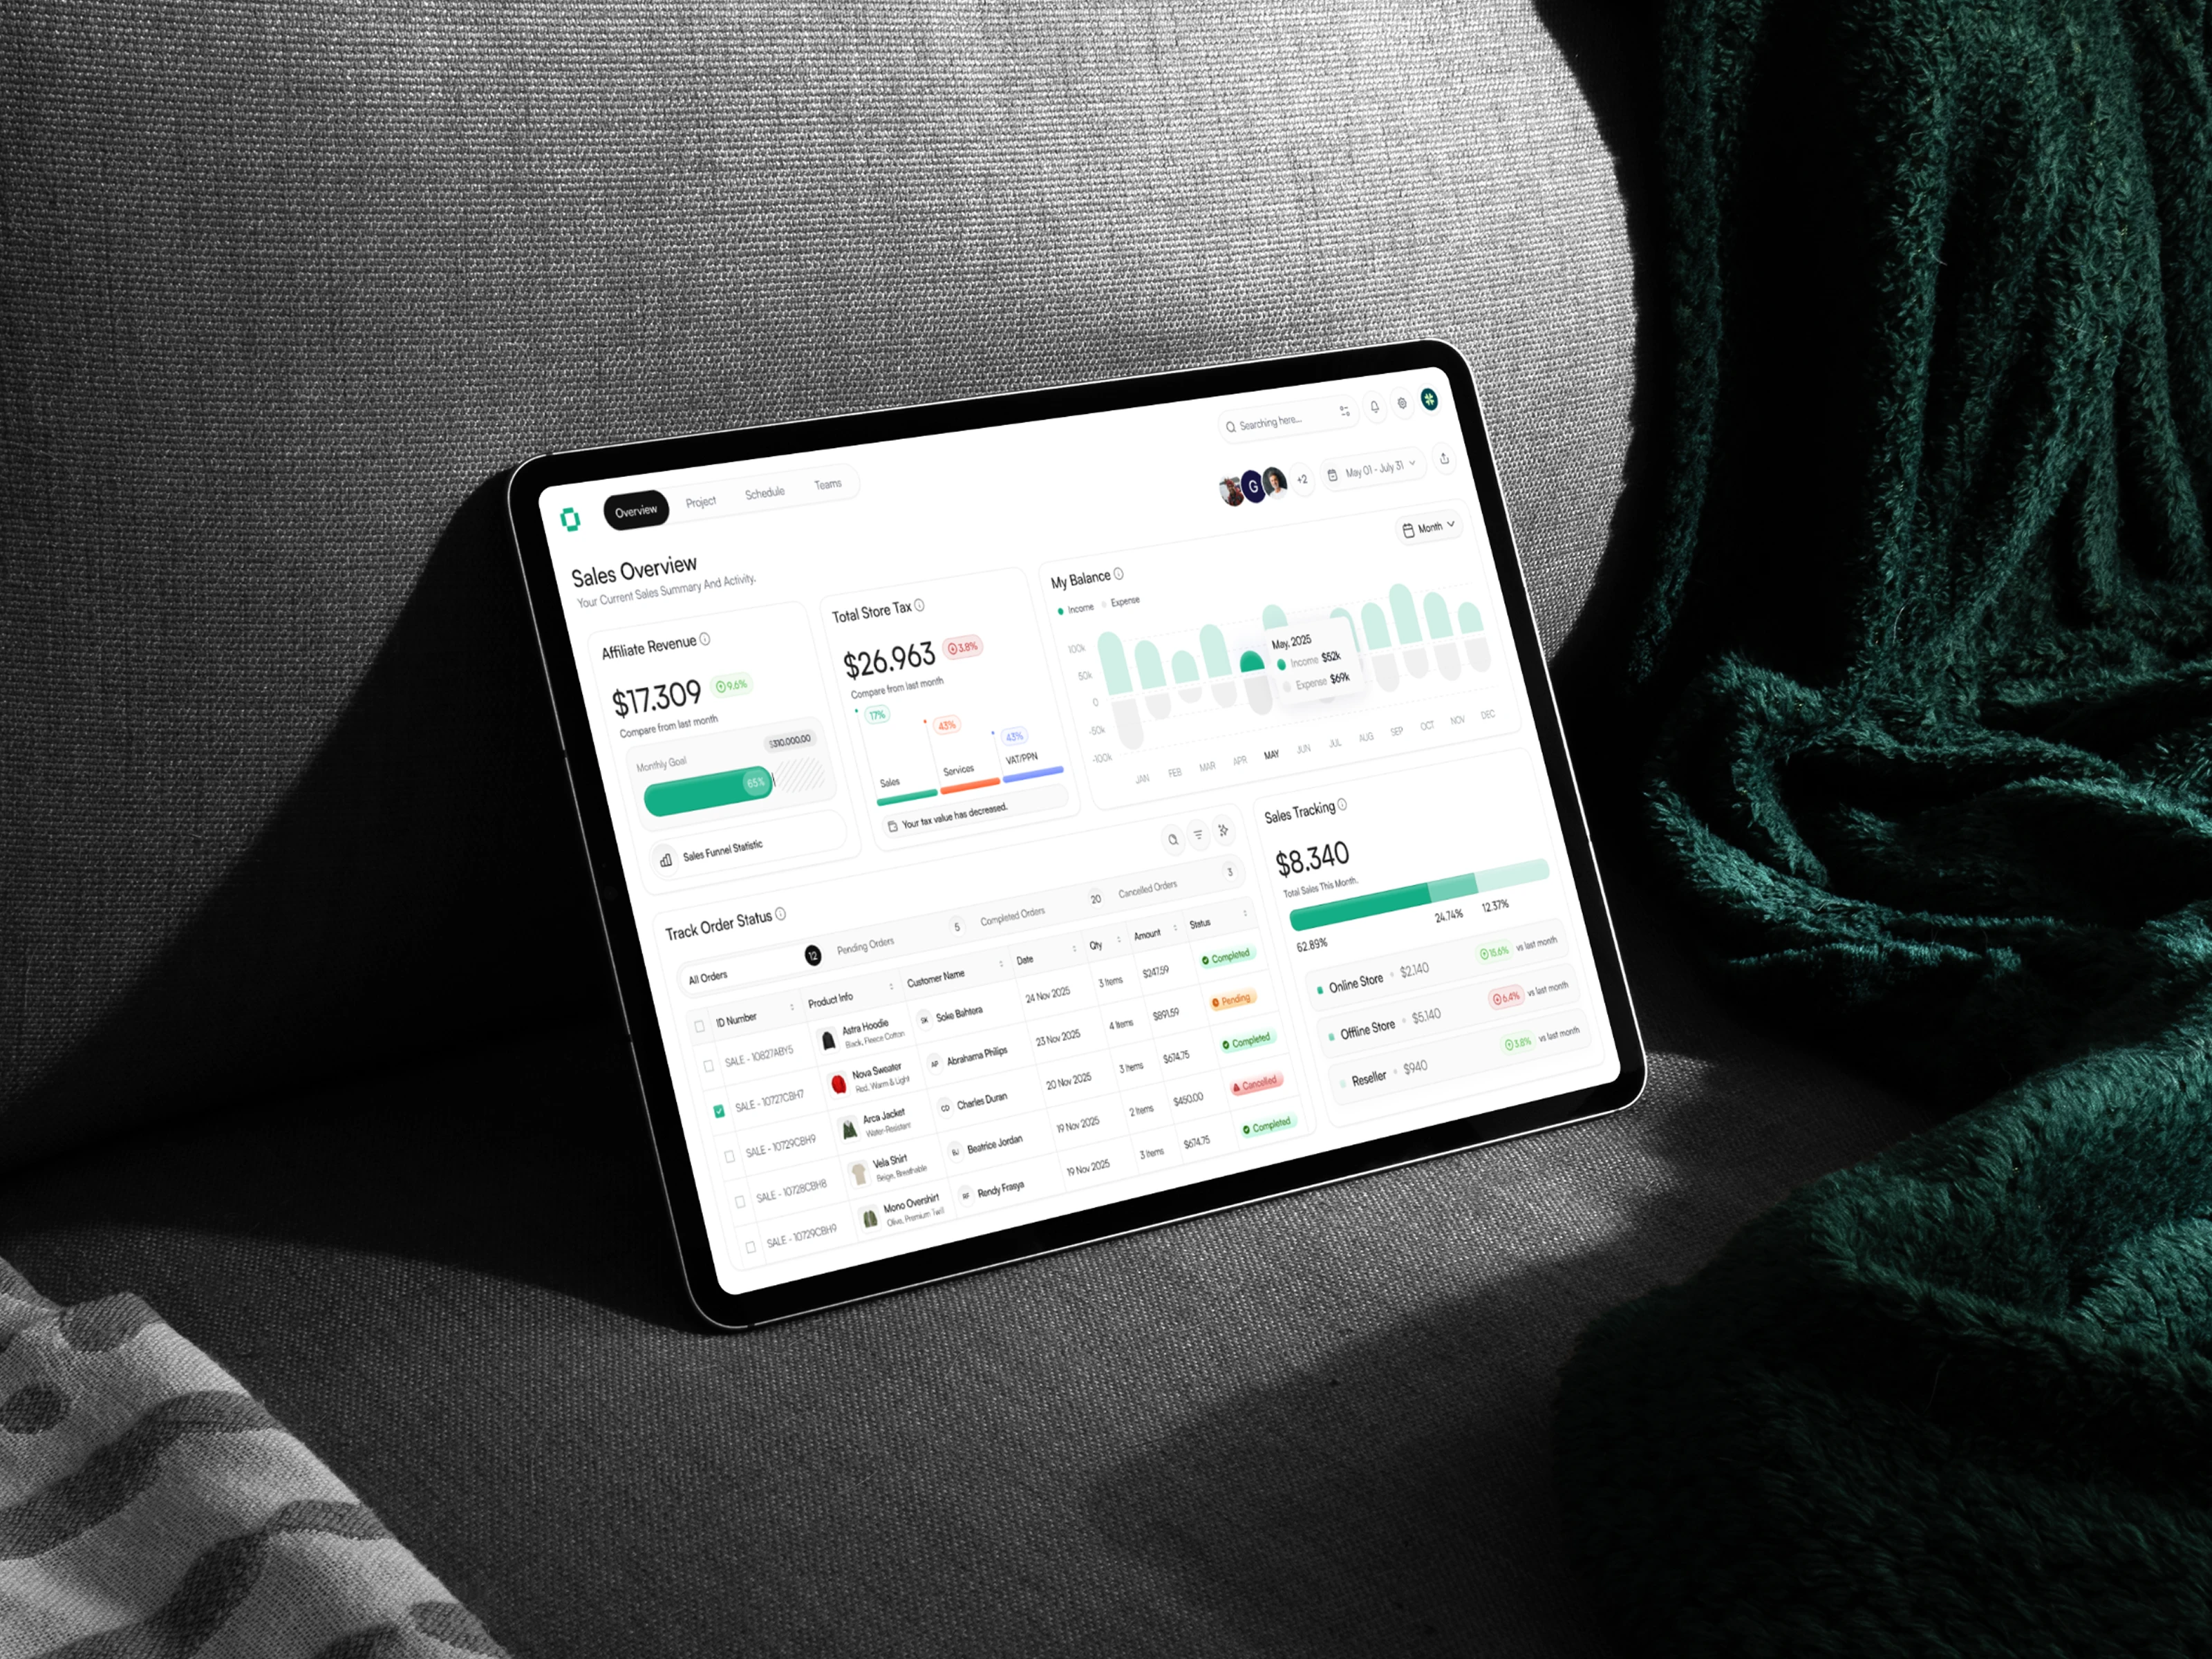
The layout is structured into modular sections that separate high-level financial summaries from operational tracking components. Hierarchy is established by placing key revenue indicators at the top, followed by visual trend analysis and structured order data. Information is grouped into predictable zones to guide scanning behavior before deeper inspection. The organization prioritizes logical alignment and progressive disclosure to support consistent monitoring.
Key Features Highlighted
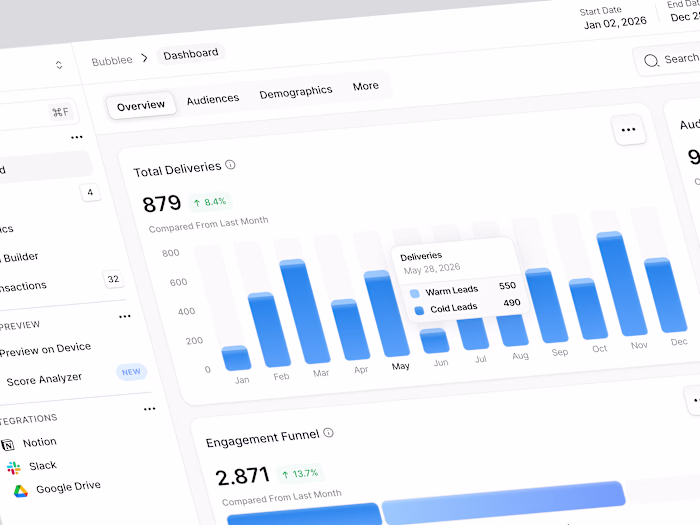
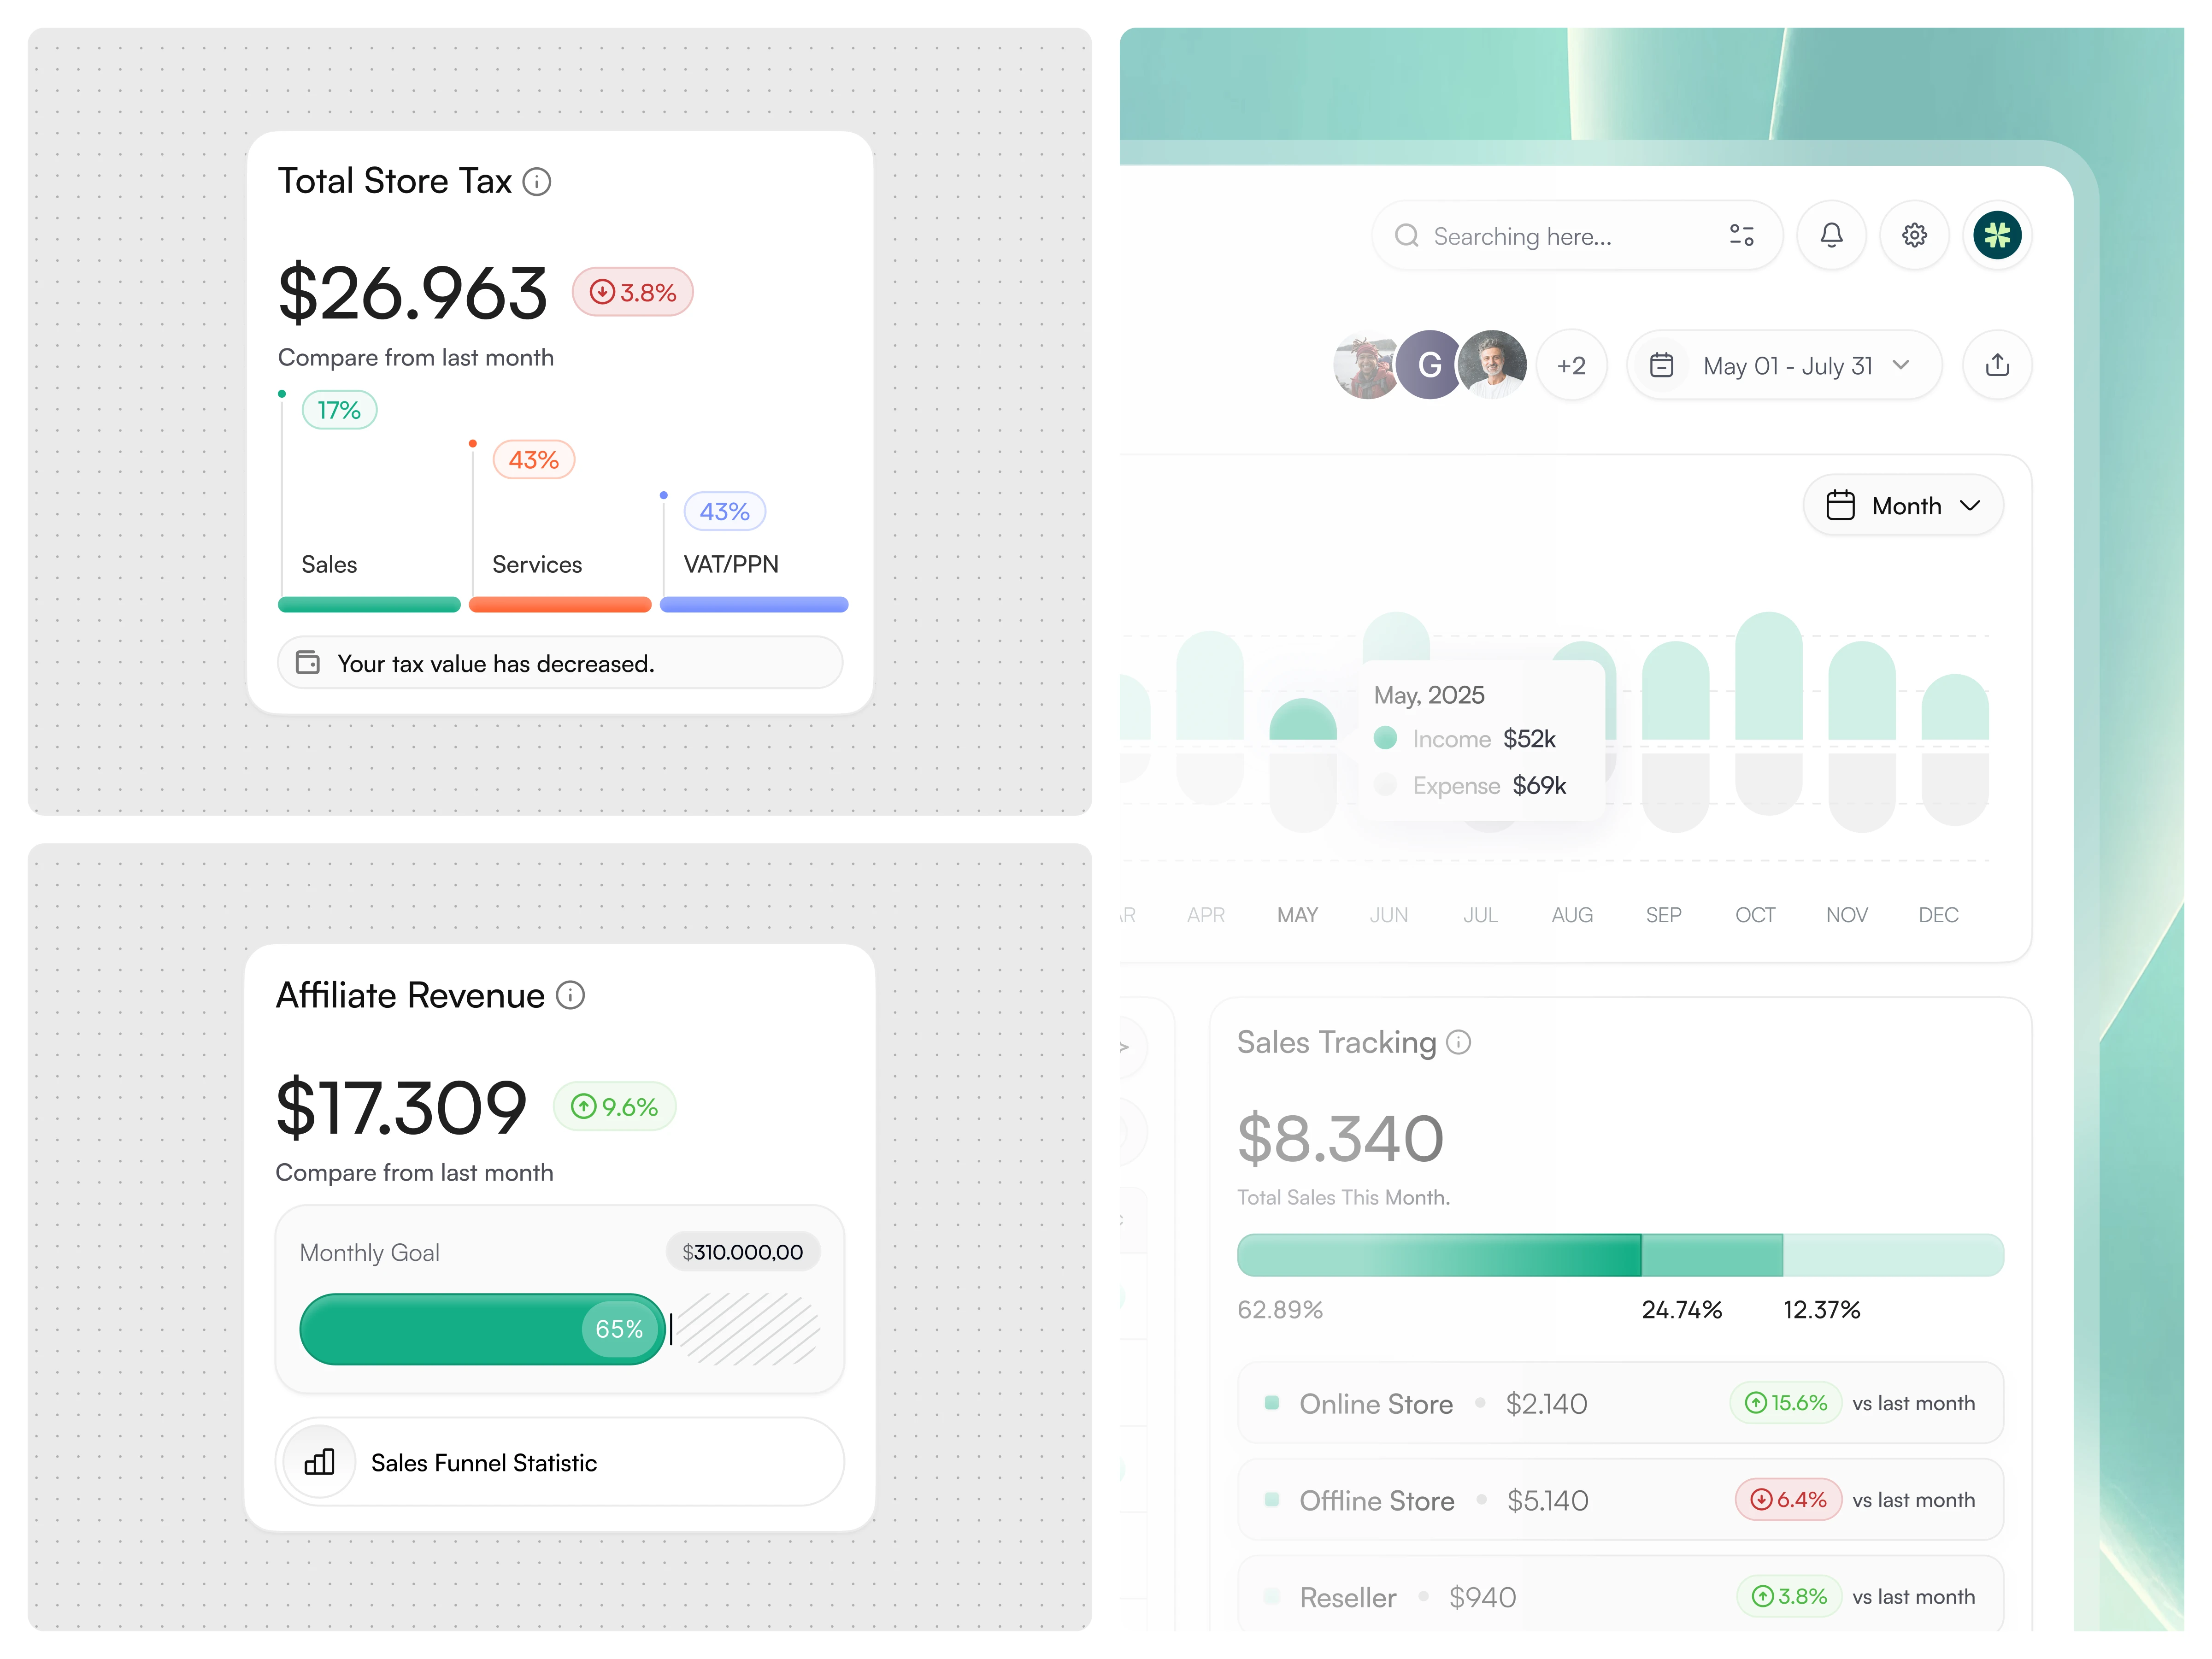
The interface presents summary cards that display affiliate revenue, total store tax, and balance tracking to provide immediate financial context. A visual income and expense chart supports trend analysis across selected timeframes. Order status tracking introduces structured visibility into transaction progress, customer details, and fulfillment states. Sales tracking components further contextualize revenue distribution across channels, helping users interpret performance sources within the dashboard.
The Solution and Impact
The resulting dashboard helps users interpret complex sales activity with greater clarity and confidence. By structuring financial and operational data into clearly defined sections, the interface reduces cognitive load during daily review. Users can move seamlessly between summary metrics and detailed transaction views without losing context. The design supports informed oversight through organization rather than visual density.
Like this project
Posted Feb 12, 2026
Sales Performance Dashboard exploration designed to support structured revenue visibility, order tracking, and operational sales clarity
Likes
1
Views
8