Full-Funnel Performance Dashboard for ClickToClose

Shaily Soni

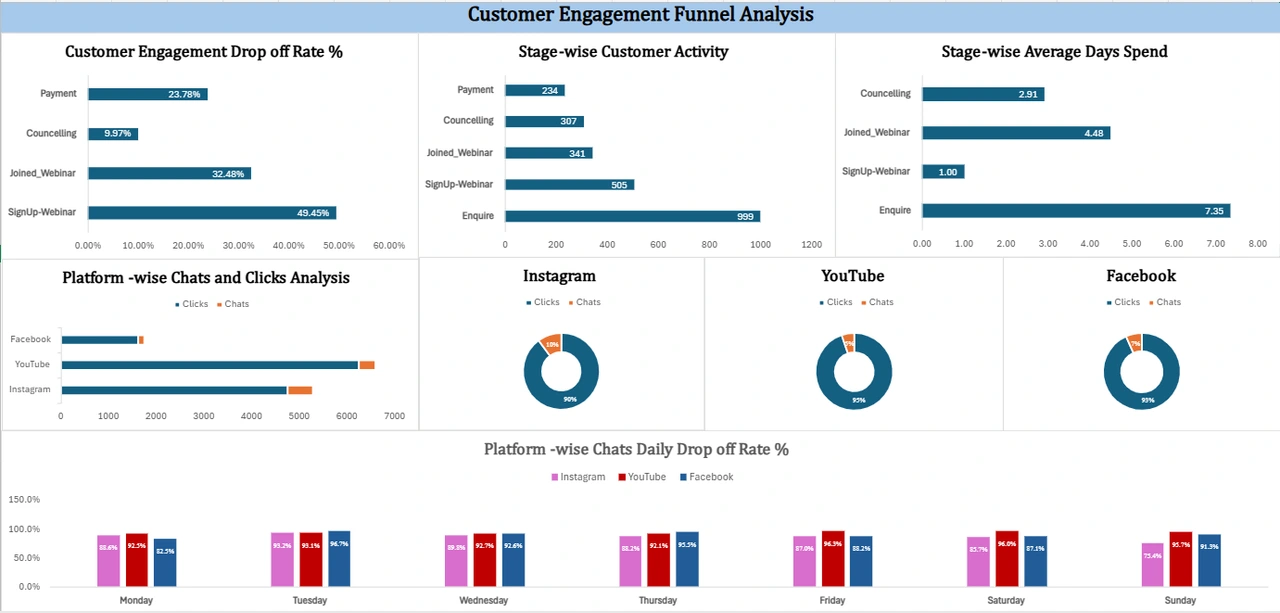
ClickToClose: Full-Funnel Performance Dashboard
An advanced Excel dashboard that tracks and visualizes the full customer journey from ad click to final payment—helping optimize marketing ROI across YouTube, Facebook, and Instagram.
📌 Project Overview
This dashboard maps the entire conversion funnel, from initial engagement to final payment, using multi-source campaign data. Built entirely in Excel, it allows the marketing team to:
Monitor platform-wise performance (YouTube, Facebook, Instagram)
Identify drop-offs at each funnel stage
Analyze campaign effectiveness daily
Support smarter ad spending and optimization
📊 Key Insights
📉 Facebook had the highest drop-off rate at the chat stage despite the most clicks.
🎯 Instagram showed the best conversion from chats to webinar registrations.
👥 Counseling session attendance dropped by ~45% after webinars.
💳 UPI was the most popular payment mode, especially via Google Pay and PhonePe.
📈 Best conversion day: Wednesday showed the highest chat-to-payment ratio.
🛠 Tools & Techniques Used
Microsoft Excel (Advanced Dashboarding)
Regex & Text Functions for Data Cleaning (especially Payment Data)
Funnel Calculation Logic
Platform-wise Drop-off Analysis
Dynamic Dropdown Filters and KPIs
🖼 Dashboard Preview
💼 Business Value
📊 Identifies where potential customers lose interest
🎯 Enables targeted platform-level improvements
💰 Drives higher ROI by aligning budget with high-performing stages
Like this project
Posted Jul 1, 2025
Created an Excel dashboard to track and optimize marketing ROI across platforms.
Likes
0
Views
0


ChurnScope-Customer-Retention-Analysis-Dashboard

Indigo Airlines Meal Feedback Analysis