ChurnScope-Customer-Retention-Analysis-Dashboard

Shaily Soni


ChurnScope-Customer-Retention-Analysis-Dashboard
A data-driven Excel dashboard project to analyze customer churn patterns, segment behavior, and improve user retention through smart insights.
Presentation Link: https://www.canva.com/design/DAGq57F5izo/cvQ2N4he_XfvU1yxQJOP9g/view?utm_content=DAGq57F5izo&utm_campaign=designshare&utm_medium=link2&utm_source=uniquelinks&utlId=h8c13129a96
Project Overview
Customer churn is one of the biggest challenges for subscription-based businesses. This dashboard helps identify who’s leaving—and more importantly, why. The project identifies churn drivers by analyzing tenure, plan types, customer types, and engagement stages and provides a foundation for effective retention strategies.
Built using Tableau, the dashboard turns raw data into actionable insights that business leaders can use to reduce churn and improve lifetime value.
Key Insights
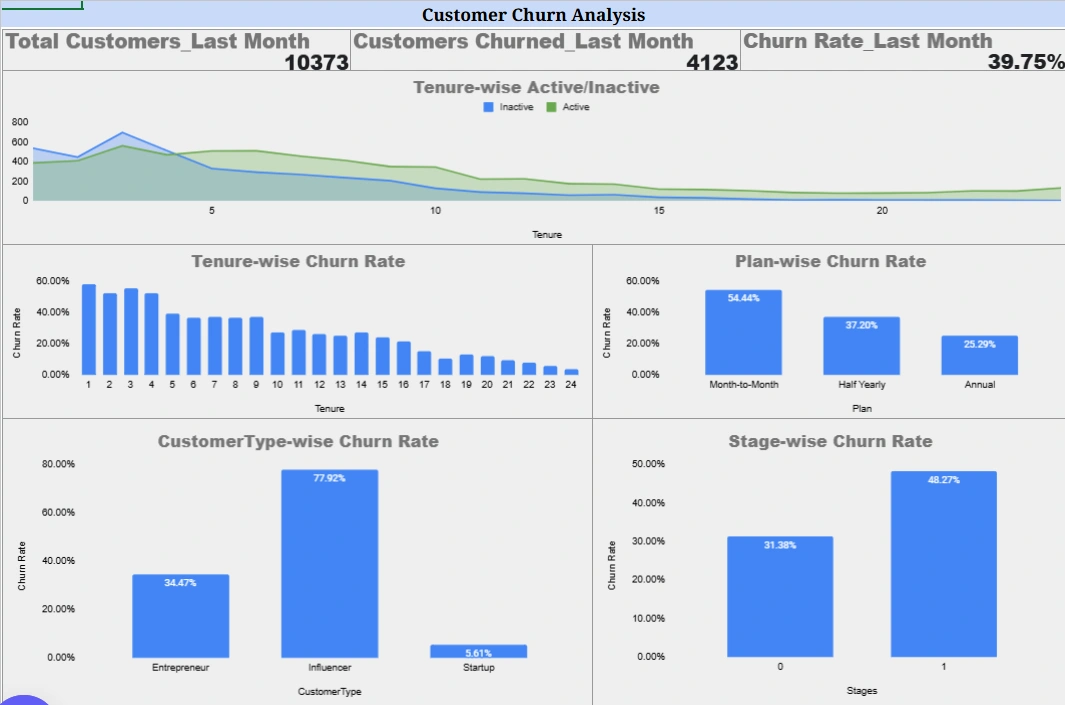
Churn Rate (Last Month): 39.75%
Total Customers (Last Month): 10,373
Customers Churned: 4,123
Segment-Wise Observations:
Tenure: Newer users (1–3 months) show significantly higher churn rates (60–70%)
🗓 Plan Type:
The month-to-Month plan has the highest churn (54.44%)
The annual plan has the lowest churn (25.29%)
Customer Type:
Influencers have the highest churn (77.92%)
Startups are the most loyal (5.61%)
Stage:
Emerging businesses (Stage 1) churn more (48.27%) than established ones (Stage 0)
Visualizations
Tenure-wise Active/Inactive Line Chart
Tenure-wise Churn Rate Bar Chart
Plan-wise Churn Rate
Customer Type-wise Churn Rate
Stage-wise Churn Rate
Each chart helps pinpoint where churn is happening most, making it easier to take specific action.
Dashboard Preview
Tools Used
Excel
Customer Segmentation
Churn Rate Analysis
Data Storytelling
Business Value
Target high-risk customer groups for retention campaigns
Personalize outreach for at-risk user segments
Reduce churn and improve customer lifetime value
Support data-backed business decisions
Like this project
Posted Jul 1, 2025
Created a Tableau dashboard to analyze customer churn and improve retention.
Likes
0
Views
0


Indigo Airlines Meal Feedback Analysis
Full-Funnel Performance Dashboard for ClickToClose