Geospatial Analysis and 3D Visualization of the 2014 Oso Mudslid
Damilare Ogunajo
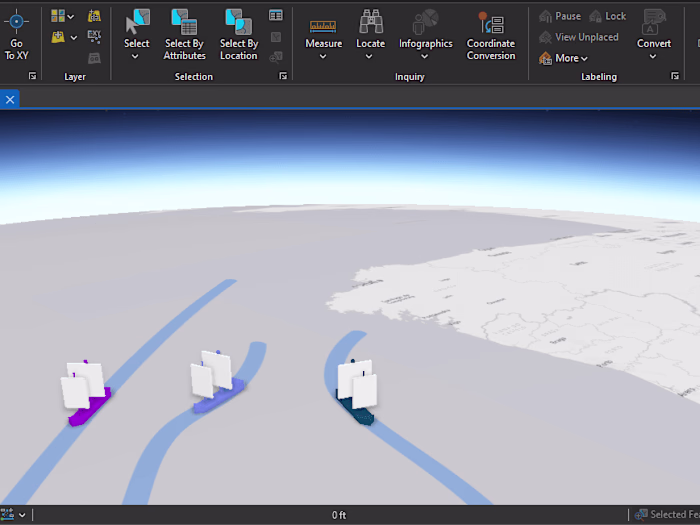
I authored a 3D fly-through animation to visualize the catastrophic impact of the Oso mudslide that occurred on March 22, 2014, near the town of Oso, Washington. This animation illustrates the dramatic changes in topography, showing how the mudslide reshaped the landscape. I utilized various data sources to represent the ground surface, combining an elevation surface with matching imagery layers. This project demonstrates the power of 3D visualization in understanding natural disasters and their effects on terrain.
Like this project
Posted Nov 28, 2024
Created a 3D animation to visualize the geospatial impact of the 2014 Oso mudslide.
Likes
0
Views
5