Total Sales and Quantity Dashboard
Zhanel Jamenkova
Here I have provided the smallest parts of my Power BI reports. The reports are based on sample internet data to maintain client confidentiality.
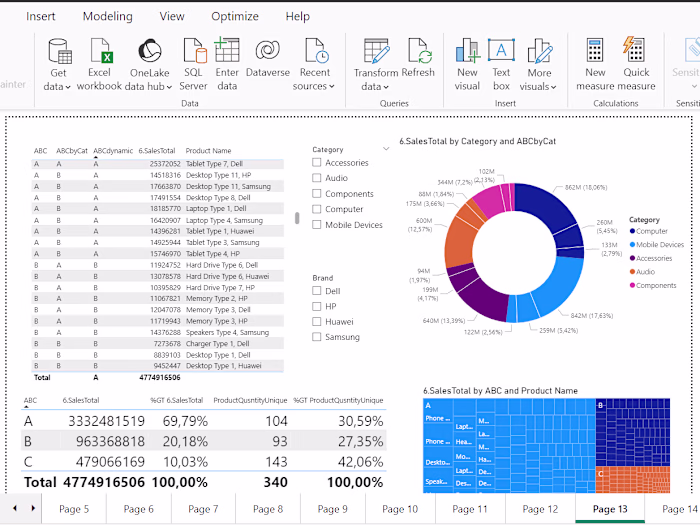
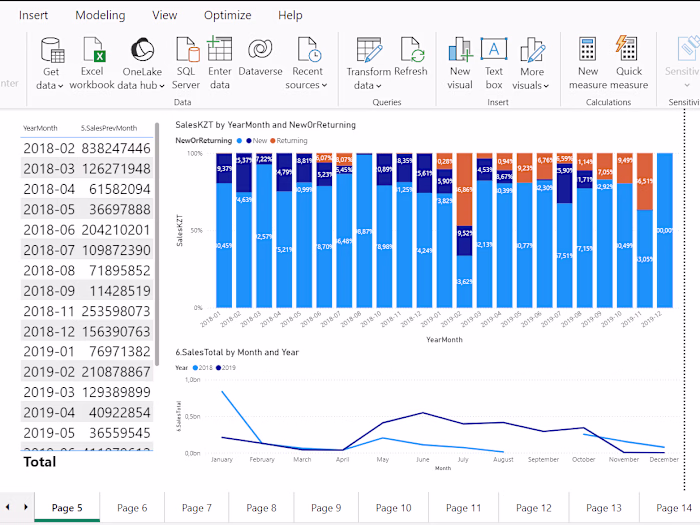
Total Sales and Quantity Report:
Displays total sales and quantities by stores.
Interactive Slicers: Filter data by specific shops and cities, with visuals updating based on these selections.
Map Visualizations: Highlights store locations. Selecting a shop name will pinpoint its exact location on the map.
Like this project
Posted Aug 6, 2024
The report shows sales and quantities by store. Interactive slicers filter by shop and city. Map visualizations highlight store locations.