ABC Analysis Report
Zhanel Jamenkova
ABC Analysis Report:
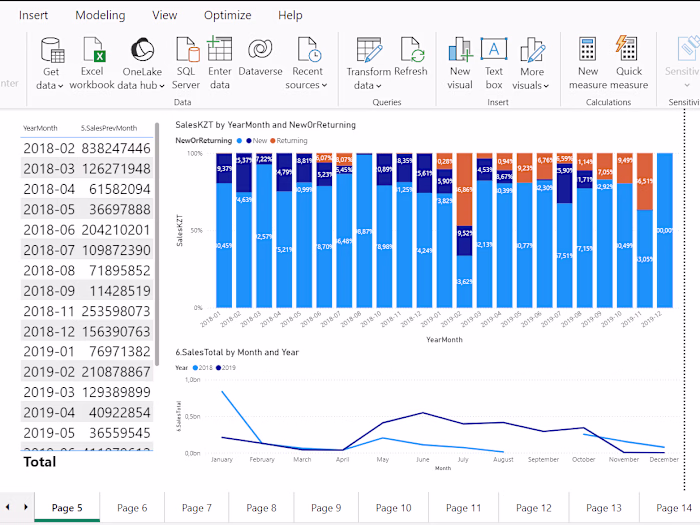
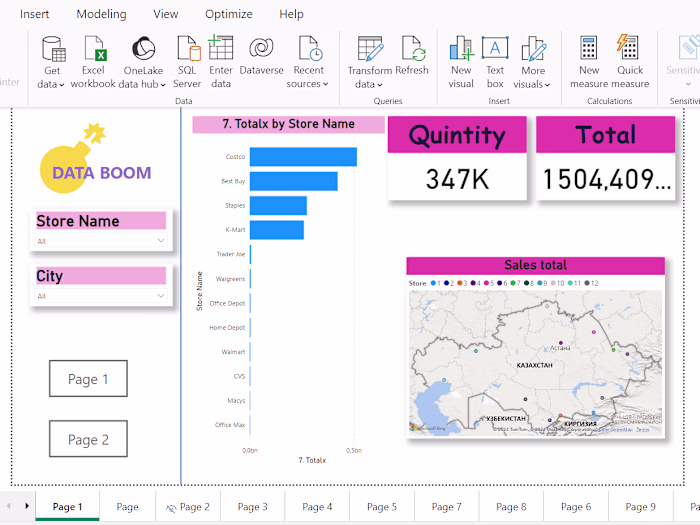
Overall and By Category: Displays ABC analysis for products and total sales.
Visualizations: Includes a donut chart and treemap for ABC analysis and total sales by category.
Like this project
Posted Aug 6, 2024
The report displays ABC analysis for products and total sales, including a donut chart and a treemap for ABC analysis and total sales by category.