Coffee-Sales-Dashboard
Bhavesh Kumar
Coffee Sales Dashboard Project
This project focuses on analysing retail sales data for a coffee shop to deliver actionable insights that enhance operational performance and profitability. Built using Power BI, the dashboard provides an intuitive and visually engaging platform for understanding sales trends and making data-driven decisions.
Key Features:
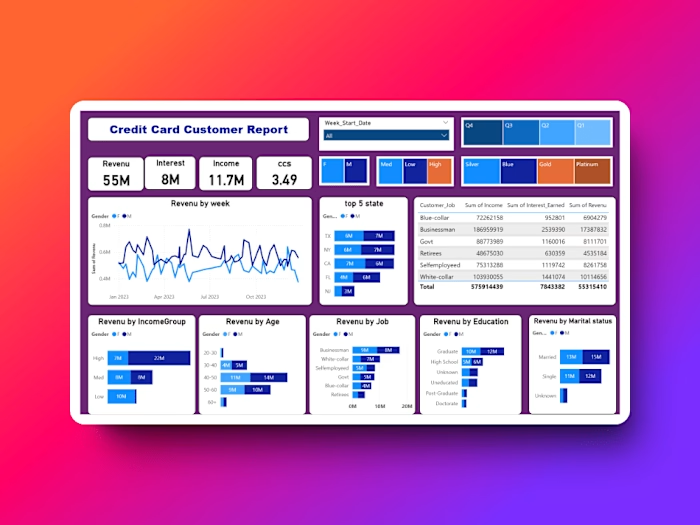
Comprehensive Sales Insights: Analyses how sales vary by day of the week and hour of the day to identify peak sales times.
Revenue Tracking: View total sales revenue for each month, offering a clear picture of seasonal trends.
Store Location Analysis: Understand sales performance across different store locations to optimize operations.
Customer Behaviours Metrics: Determine the average price per order, providing insights into customer spending habits.
Product Performance: Identify best-selling products by quantity and revenue, segmented by product category and type.
Technologies Used: Power BI, Excel, SQL
Outcome: A visually compelling and data-rich dashboard that supports business decisions with real-time insights. Explore the Project on GitHub
If you're looking for someone skilled in Excel, SQL, and Power BI for data analytics, I'm here to help!
Like this project
Posted Nov 27, 2024
Coffee Sales Dashboard A dynamic Power BI dashboard designed to analyze coffee shop sales data. This project provides insights into sales trends by day, time,
Likes
0
Views
1