Interactive Excel Sales Dashboard
Khyati Gupta
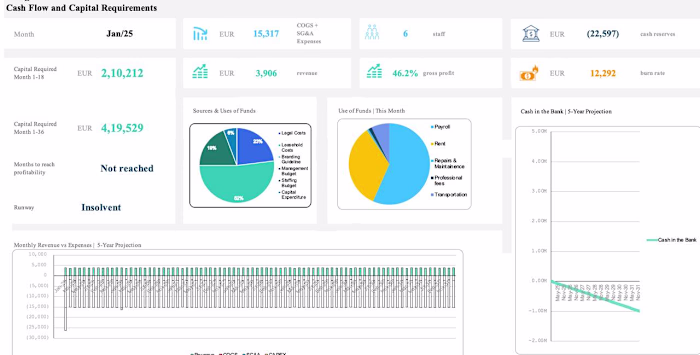
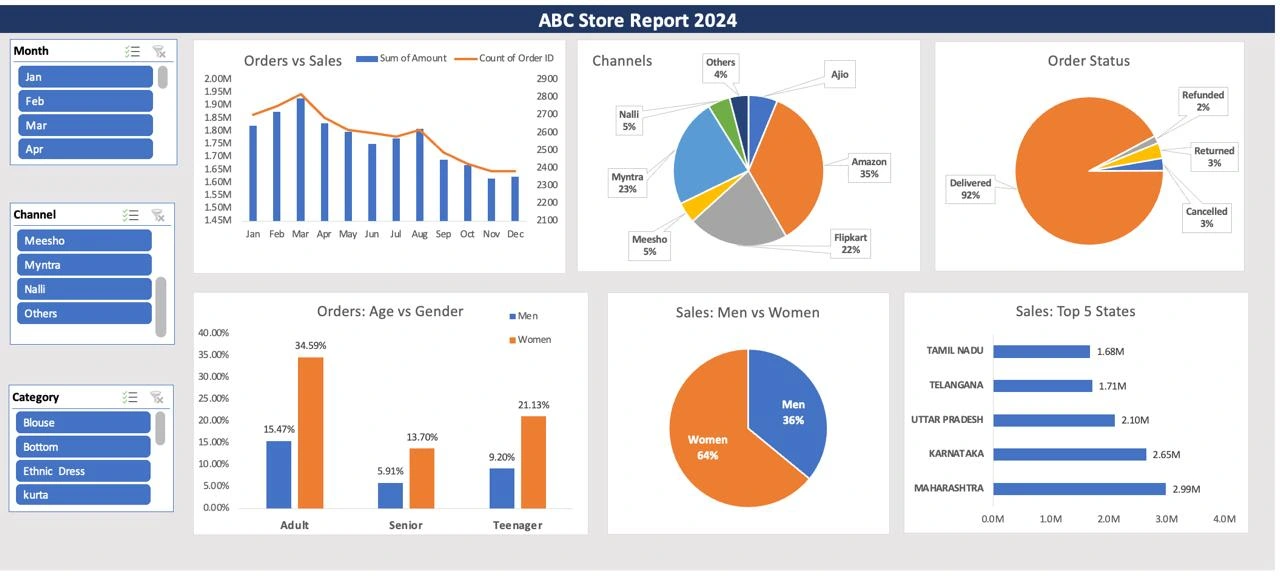
A dynamic Excel dashboard for sales and order analysis.
Features include:
• Filters for months, channels, categories, and customer segments.
• Visuals of Orders vs. Sales trends, channel contributions, order status, age & gender analysis, and state-wise sales performance.
• Interactive charts and slicers for easy navigation and data exploration.
Interactive Excel dashboard with charts, pivot tables, slicers.
Ideal for tracking performance, analyzing trends, and improving decision-making.
Like this project
Posted Jan 23, 2025
An interactive Excel dashboard providing a comprehensive analysis of sales performance. It features key visuals, raw data access, insights on channels, etc.