Daily Expenses Summary Card
Reyshel Garcia

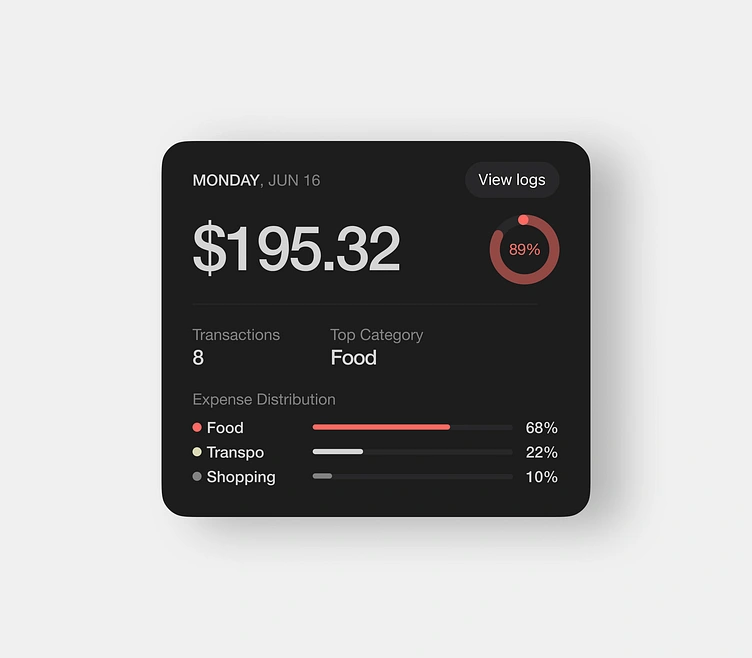
A clean and simple Daily Expenses Summary Card designed to give users a quick overview of how they’re spending throughout the day.
At the top, it shows the date, so users can easily keep track of daily logs. There’s also a clear “View Logs” button that lets them dive deeper into all transactions for that day.
The focus is on the total amount spent, styled prominently to catch attention. Beside it is a progress pie that represents how much of the daily budget has been used—paired with a percentage value (e.g., 89%) to keep things clear without overwhelming. It’s a simple but effective way to give users a sense of how close they are to overspending.
Just below that, users can see the number of transactions and the top spending category, which in this case is “Food.” This helps people quickly understand where most of their money is going.
The design keeps everything minimal and digestible, while still packing in just enough context to stay useful. Great for finance apps that aim to make daily tracking feel less like a chore.
➤ Want a card just like this for your product app?
Feel free to reach out!
Like this project
Posted Jun 22, 2025
A clean and simple Daily Expenses Summary Card designed to give users a quick overview of how they’re spending throughout the day.
Likes
0
Views
4