Diversity Inclusion
Dhanish Vats
Use Power BI's data preparation features to clean and transform the raw data into a format suitable for analysis.
Design a data model in Power BI that represents the relationships between different data tables.
Build a dashboard that combines multiple visualizations to provide a comprehensive view of your diversity and inclusion data. Provide insights and recommendations based on the data analysis.
Like this project
Posted Sep 20, 2023
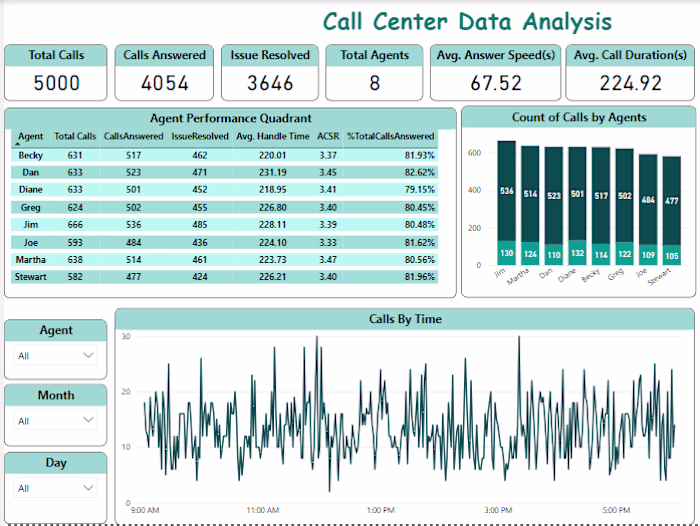
Through visually appealing charts, graphs and interactive features, our Power BI dashboard offers real-time insights into diversity metrics, including workforce
Likes
0
Views
0