IOS app case study
Raksha T
Case Study / IOS App
Studyloop — a focus app for Australian students, is set to launch in mid-year 2026. Its goal is to design an app that helps school students log their study hours, subjects, and sessions.
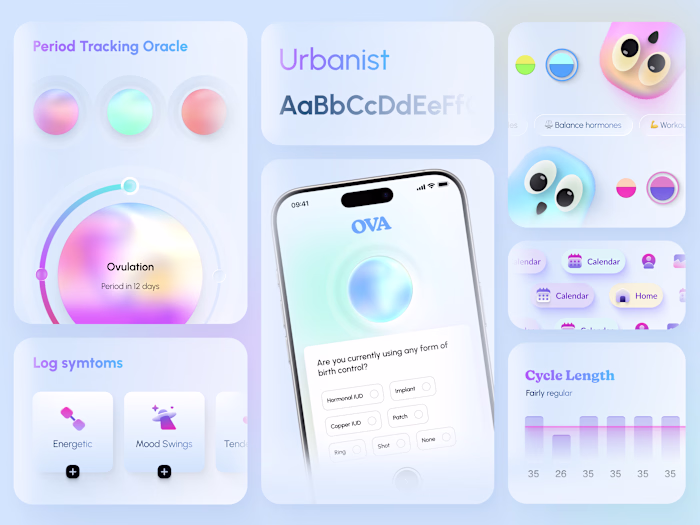
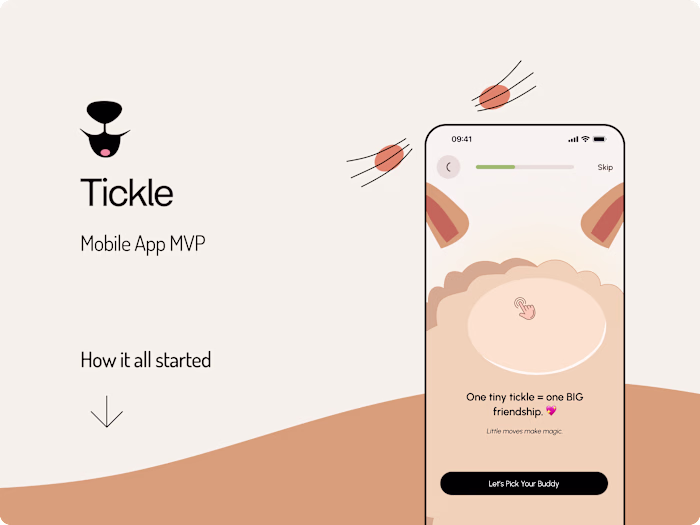
The UI direction aimed to create a playful yet sincere experience, given that the app is a focus tool for studying at the end of the day. This translated into a rounded or circular UI direction, while the fonts were pre-set by the client.
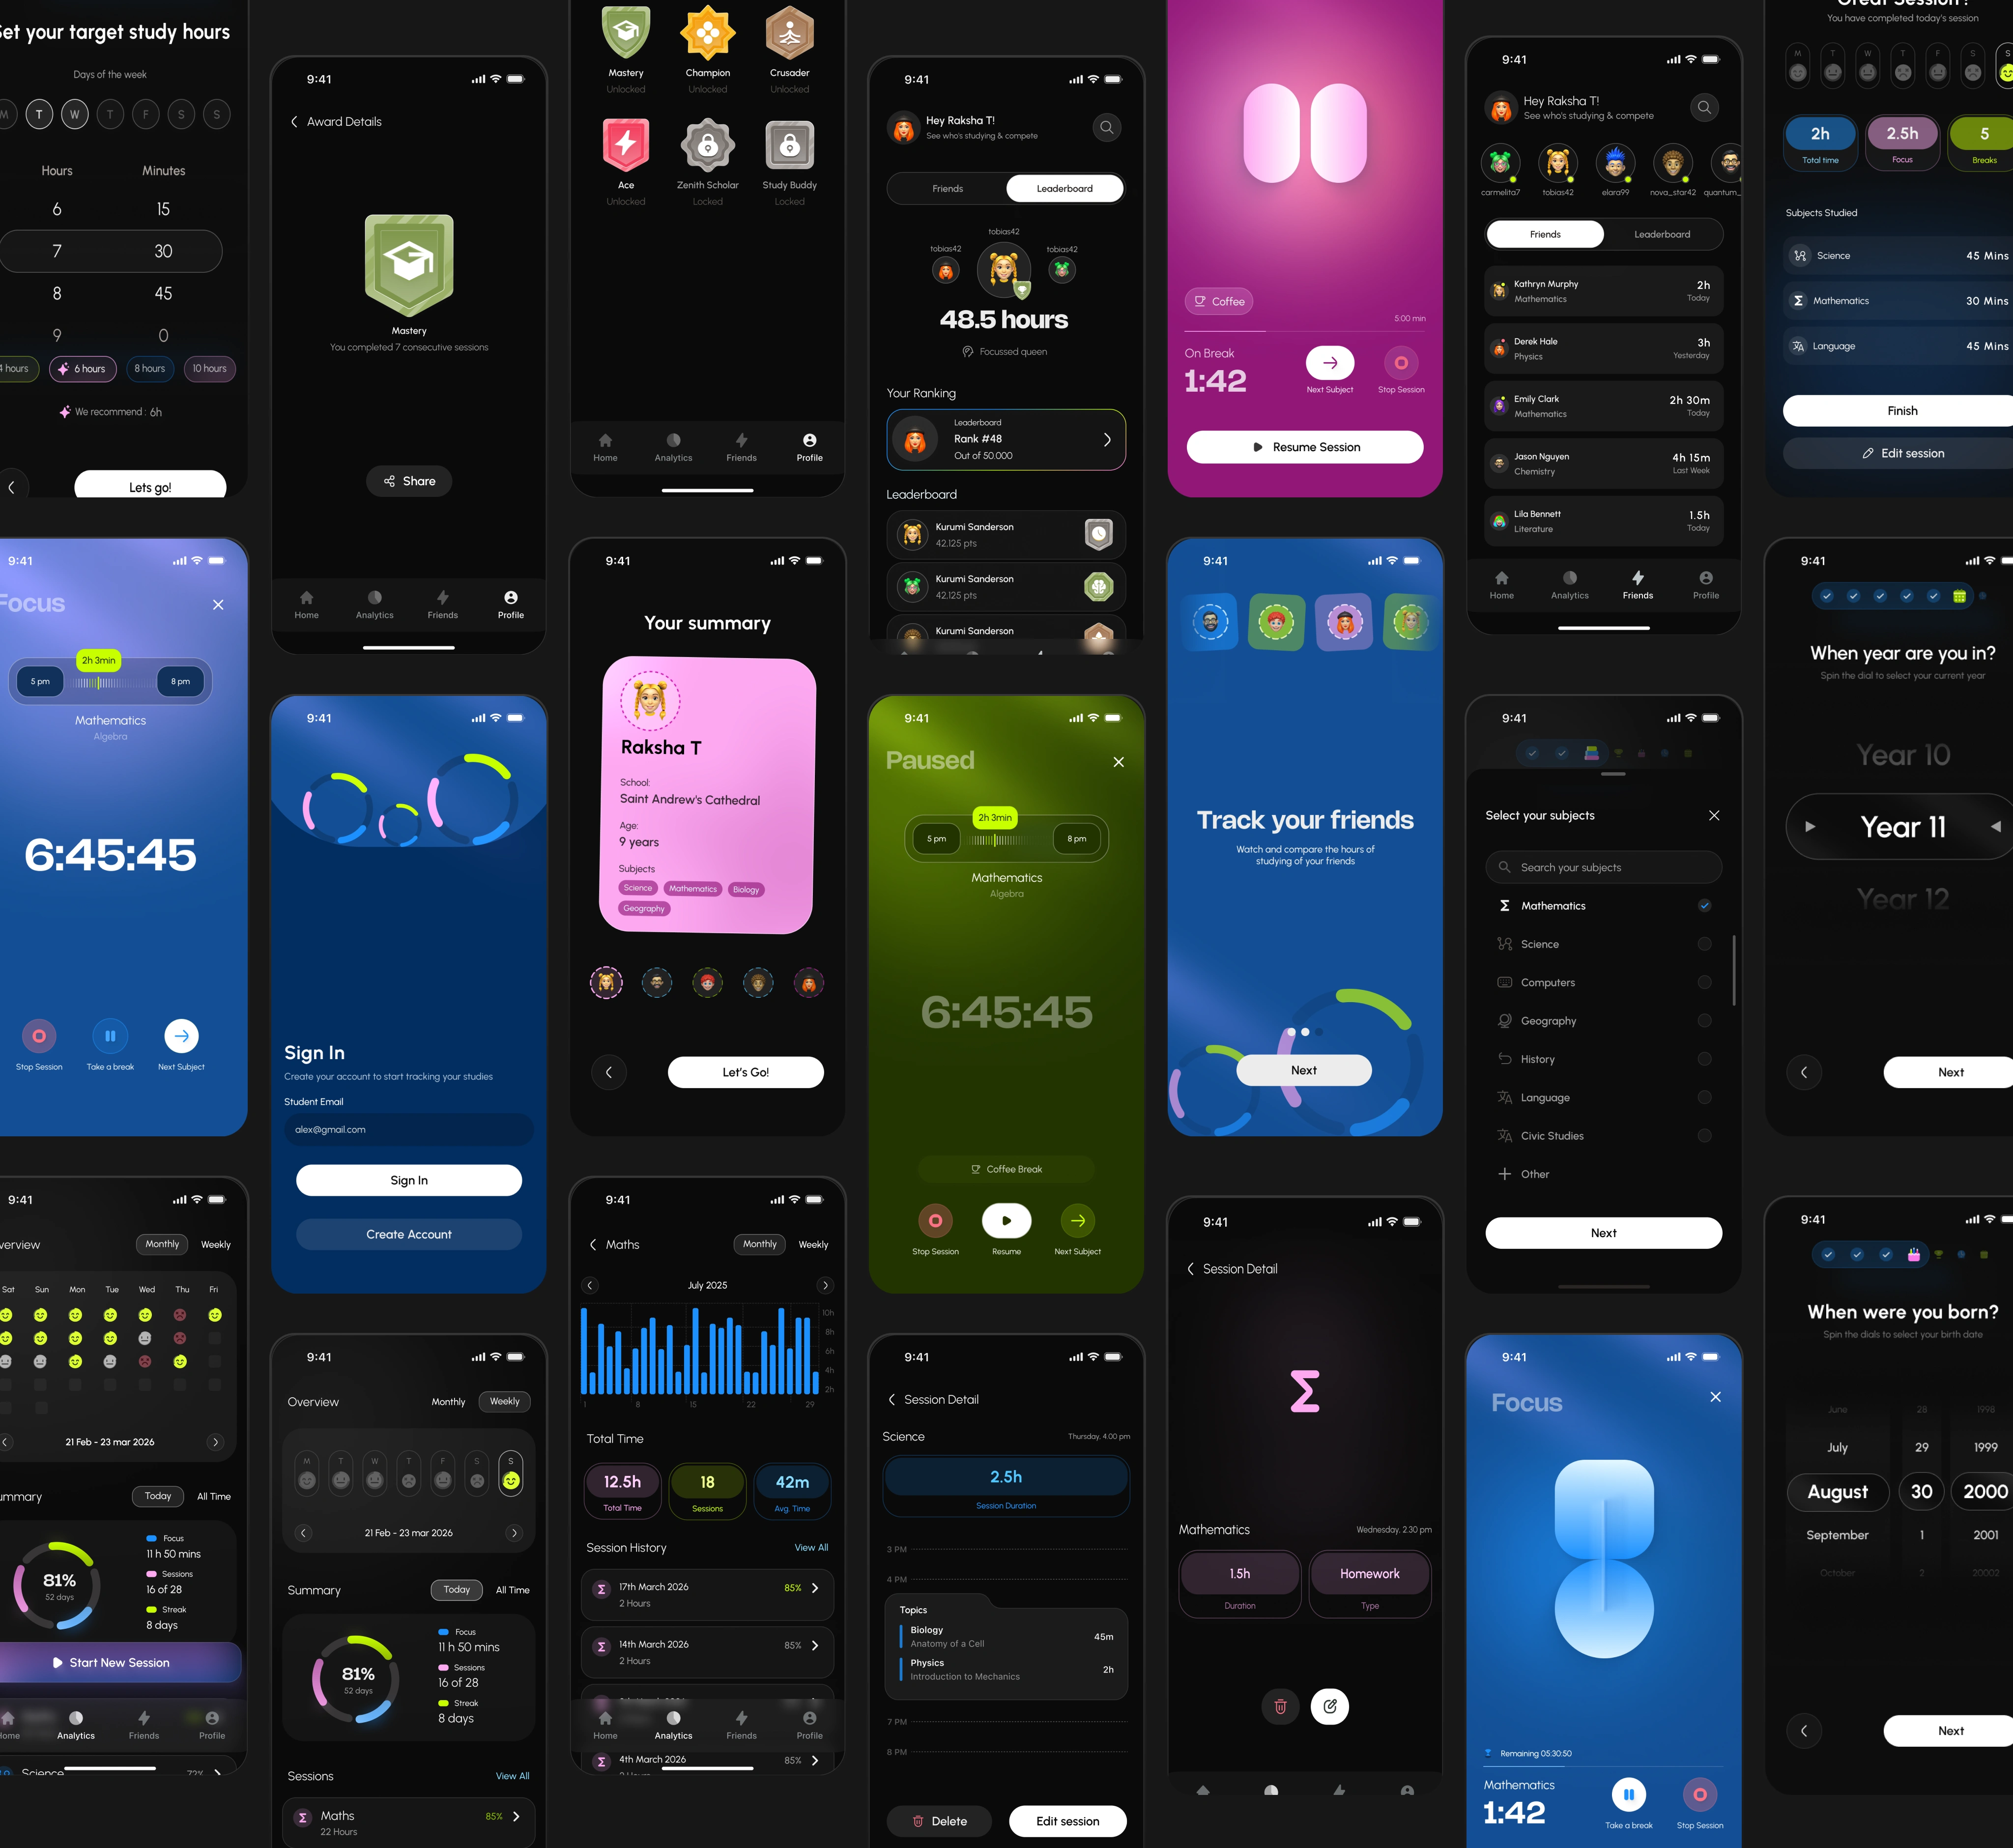
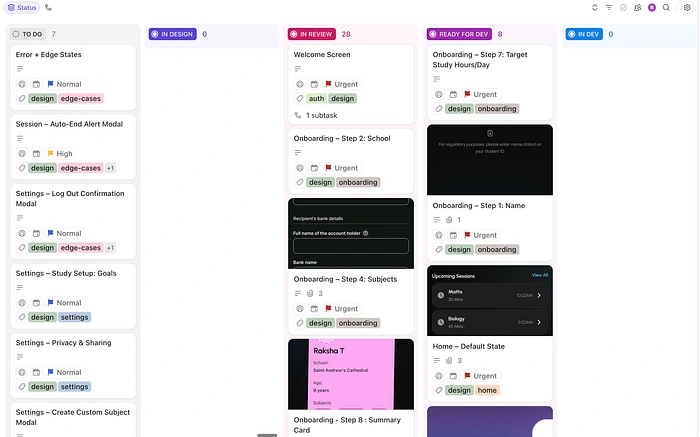
The onboarding had to feel one step at a time. Again keeping in mind these were students we had to make sure each action is a quick tab and move with a progress bar that feels familiar and less “techy”
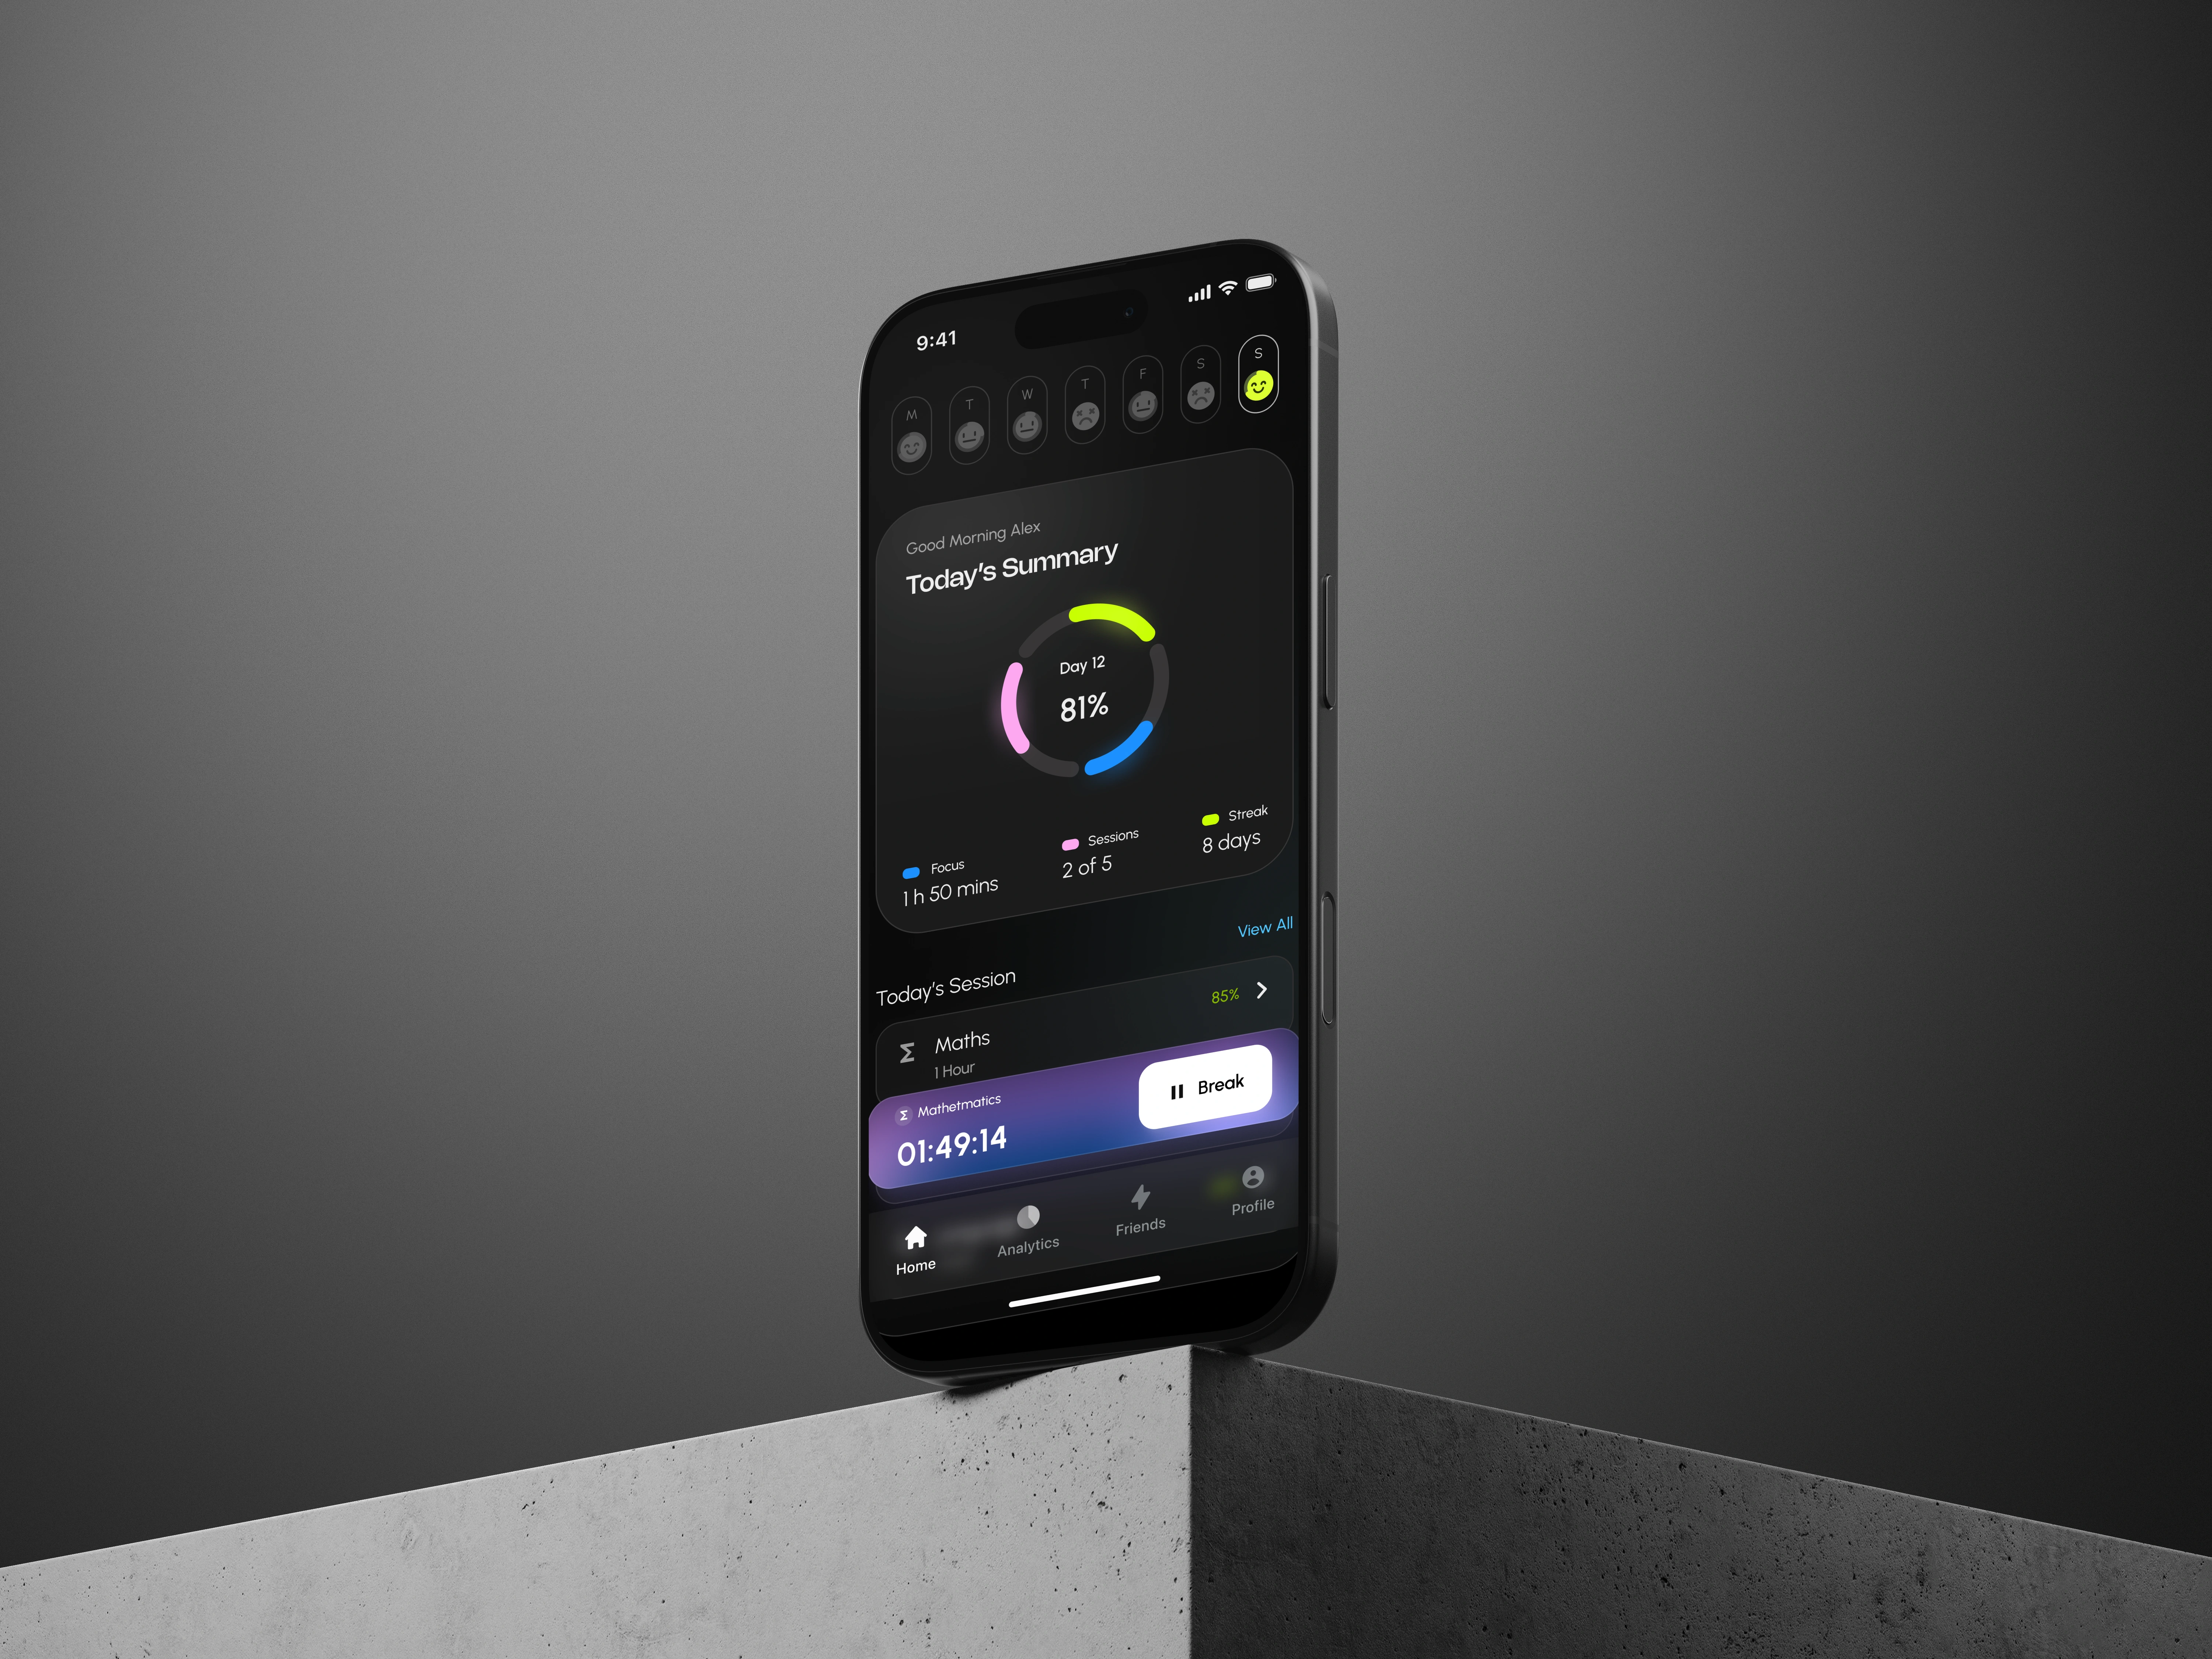
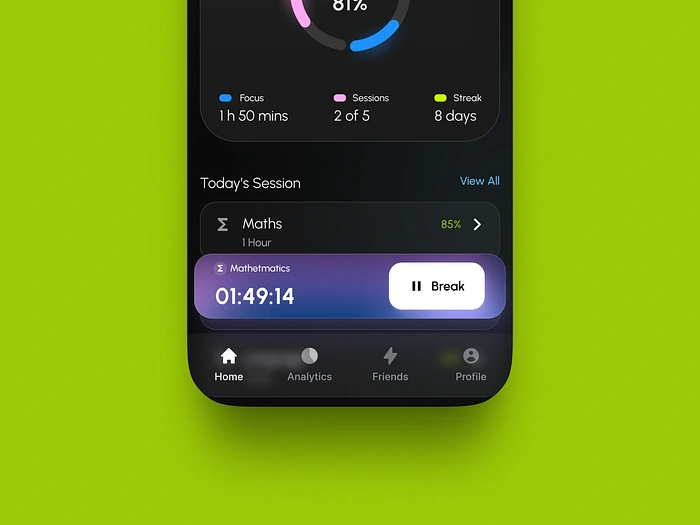
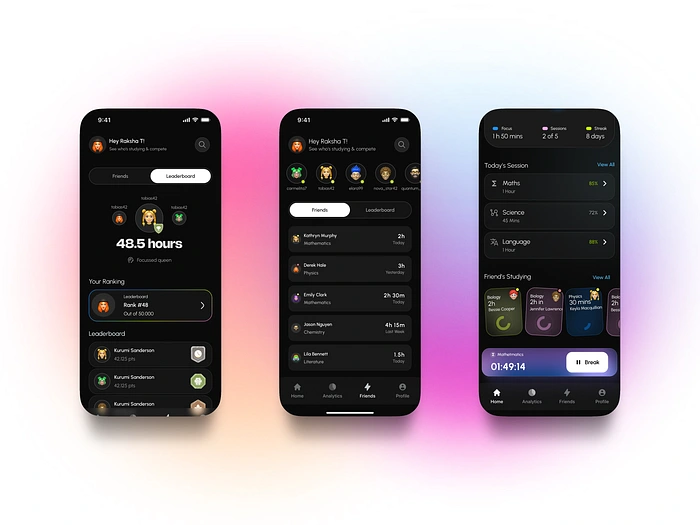
The homescreen should tell the user immediately their progress and allow for the user to start a new session / timer whenever they’re on it. Making the timer widget sticky across all tabs made sense here
Common components like streak, monthly, and weekly analytics should not only track their regularity but also their quality.
Instead of multiple rings like what Apple health does I chose to combine 3 metrics into a singular ring divided into 3 arcs. This data visualisation seemed simpler and easy to scan.
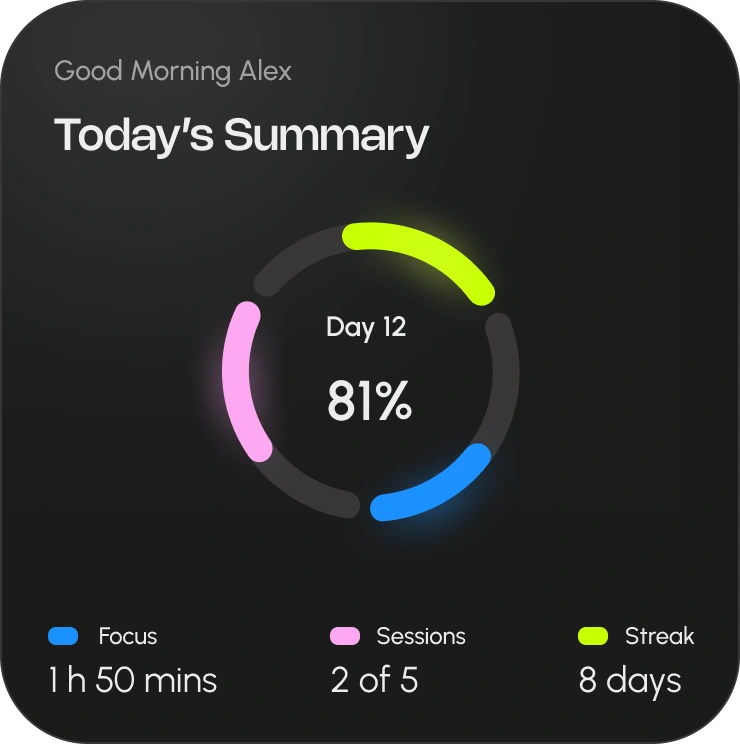
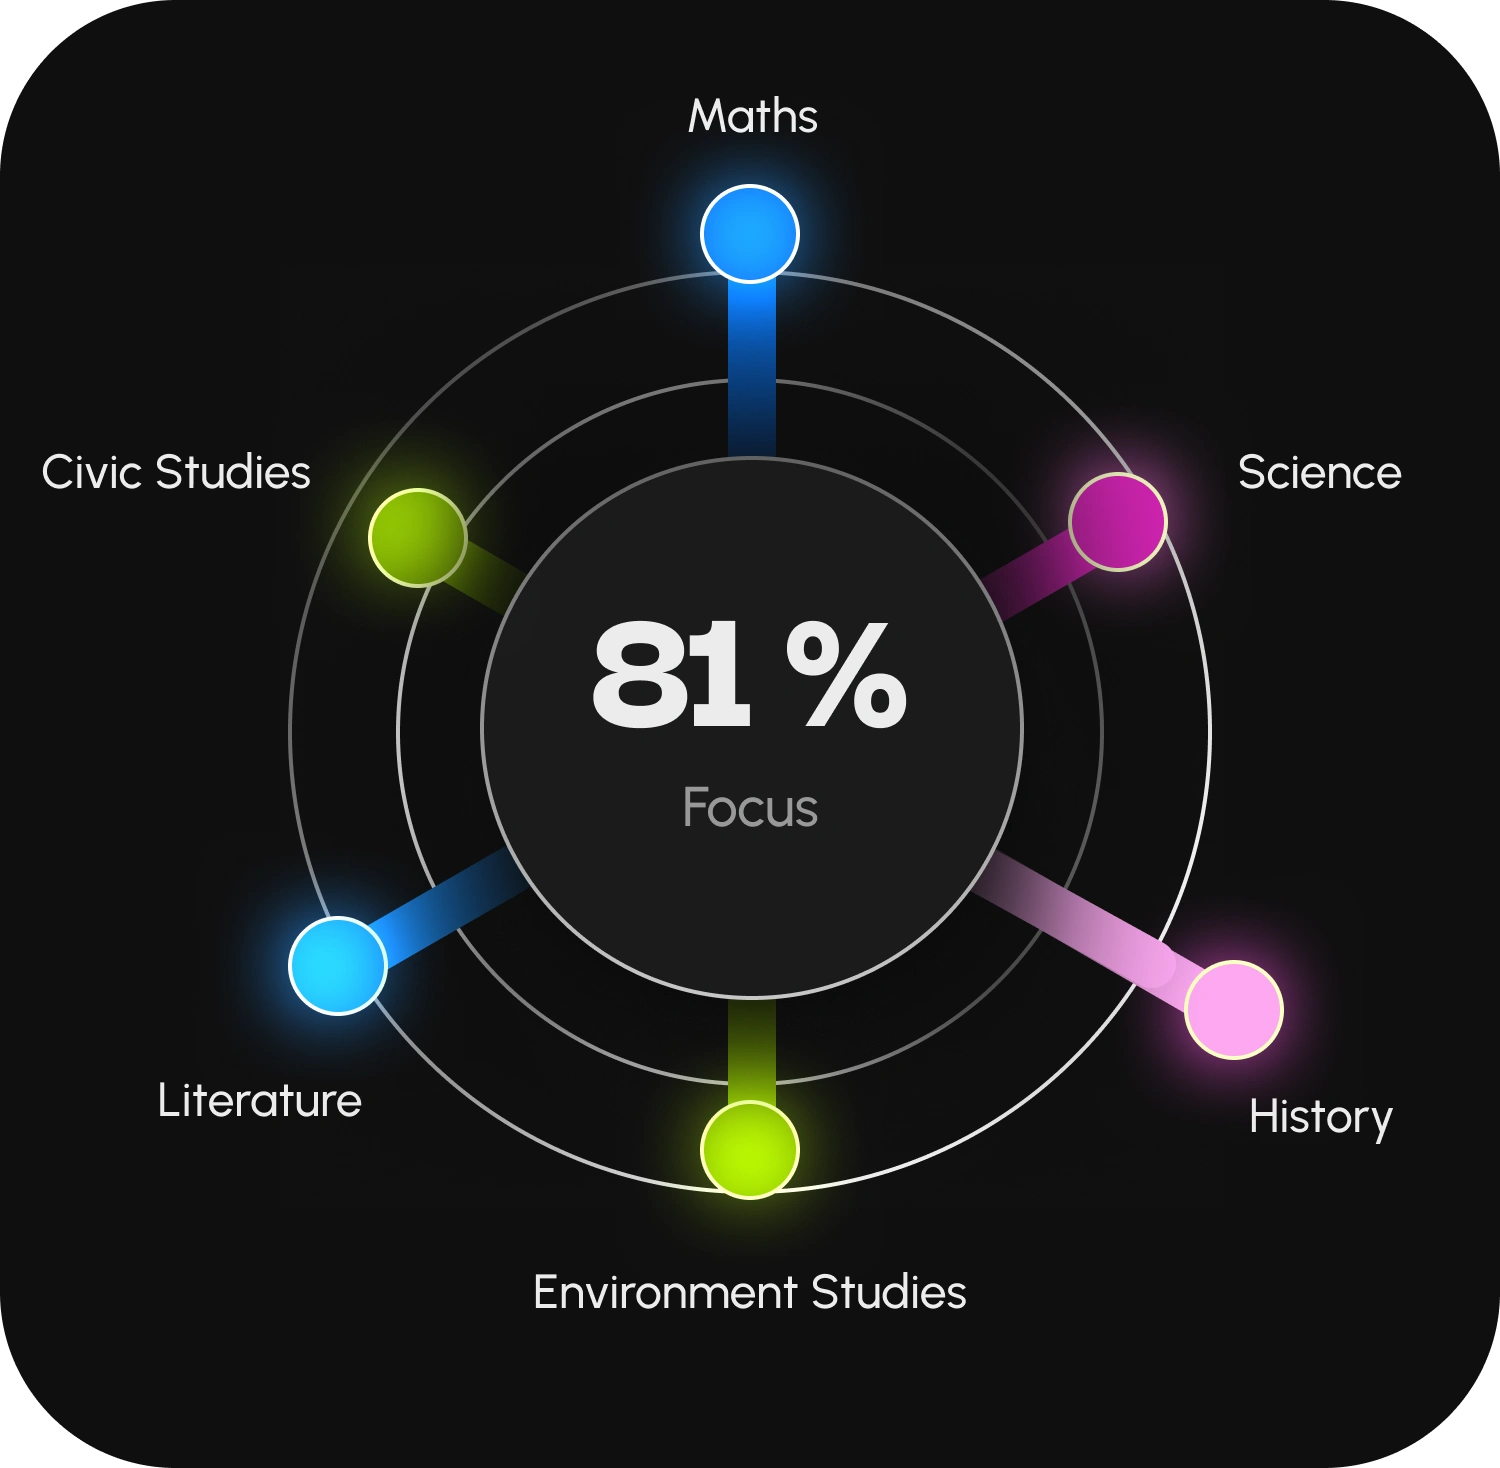
This data viz got rejected due to its complexity.
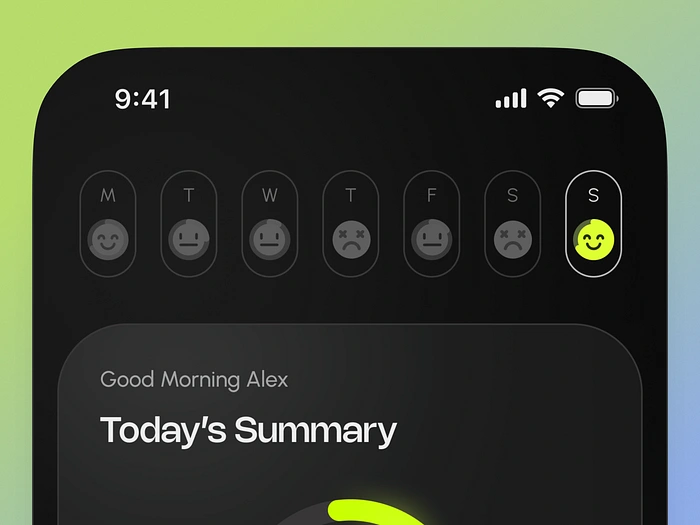
After all, valuable data is more informative when it conveys more with less. To achieve this, we’ve incorporated playful smileys (sessions) on weekdays to represent the quality of the streak and analytics. The percentage completion ranges from sad to happy, providing a visual representation of the data’s quality.
Another key feature we wanted to introduce was friends and leaderboards. We subtly foster a sense of friendly competition among users and their friends. With permission, users can view how long their friends have studied today, which subjects they’re focusing on, and who’s participating in more competitions. This information will be accessible on the homepage and the friends section.
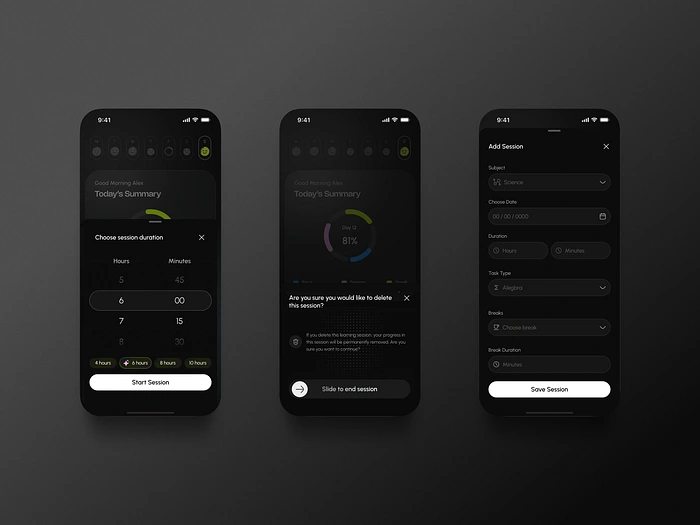
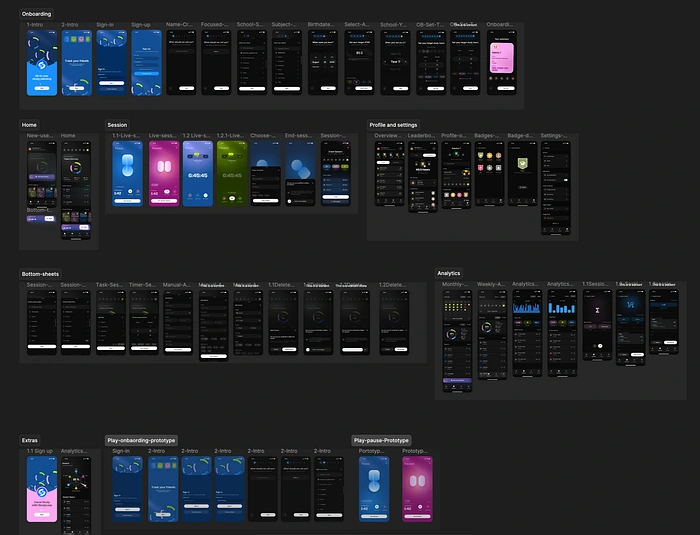
Secondary features included editing sessions , manually adding new ones or deleting old ones. Viewing session history and sharing it. Adding new subjects and breaks.
We completed design for the entire app in a 3-week sprint, which included 2 weeks of design and 1 week of reviews and feedback. They’re set to launch mid year 2026. This project was yet another fun addition to my roster of IOS apps!
Thanks to Yahya and Mazen for bringing this project to me!
Thanks for watching! Reach me at hey@raksha.design or DM on X
Like this project
Posted Apr 14, 2026
Designed UI for Studyloop, a student focus app, enhancing user engagement.
Likes
1
Views
11