VANTA - Business Analytics Dashboard

Odama Studio

VANTA — Business Analytics Dashboard
For enterprise leaders and growth-stage companies, tracking financial and operational metrics across fragmented tools often causes friction, delayed insights, and strategic inertia.
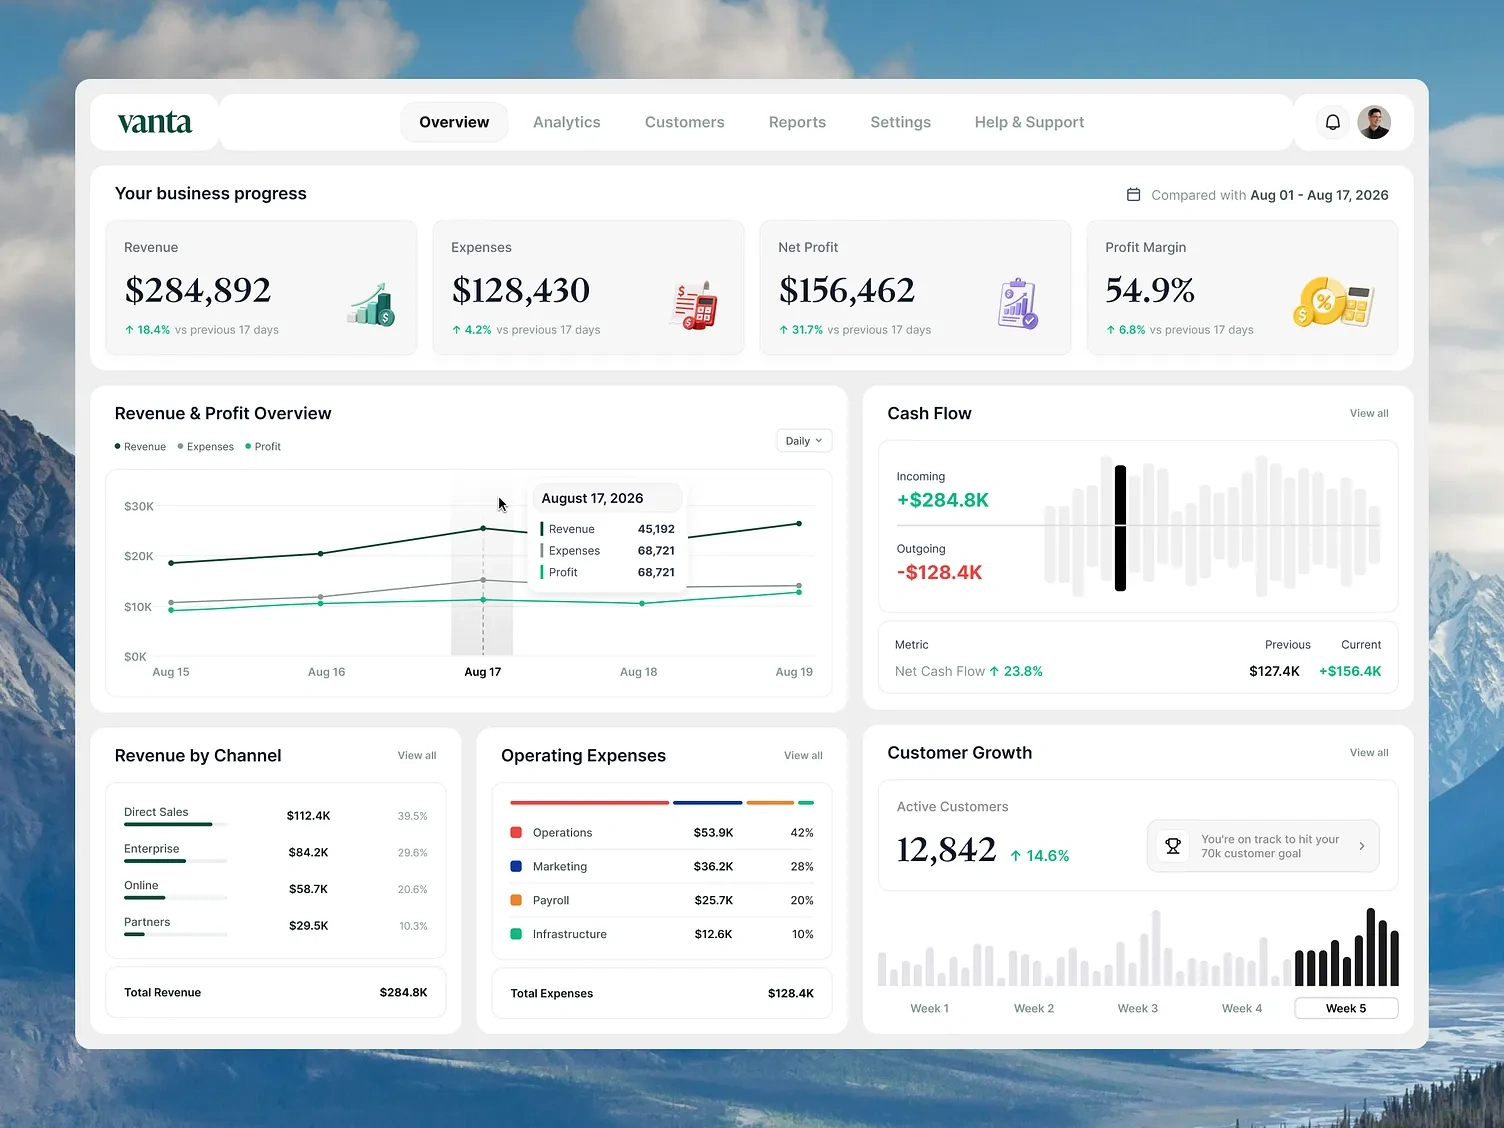
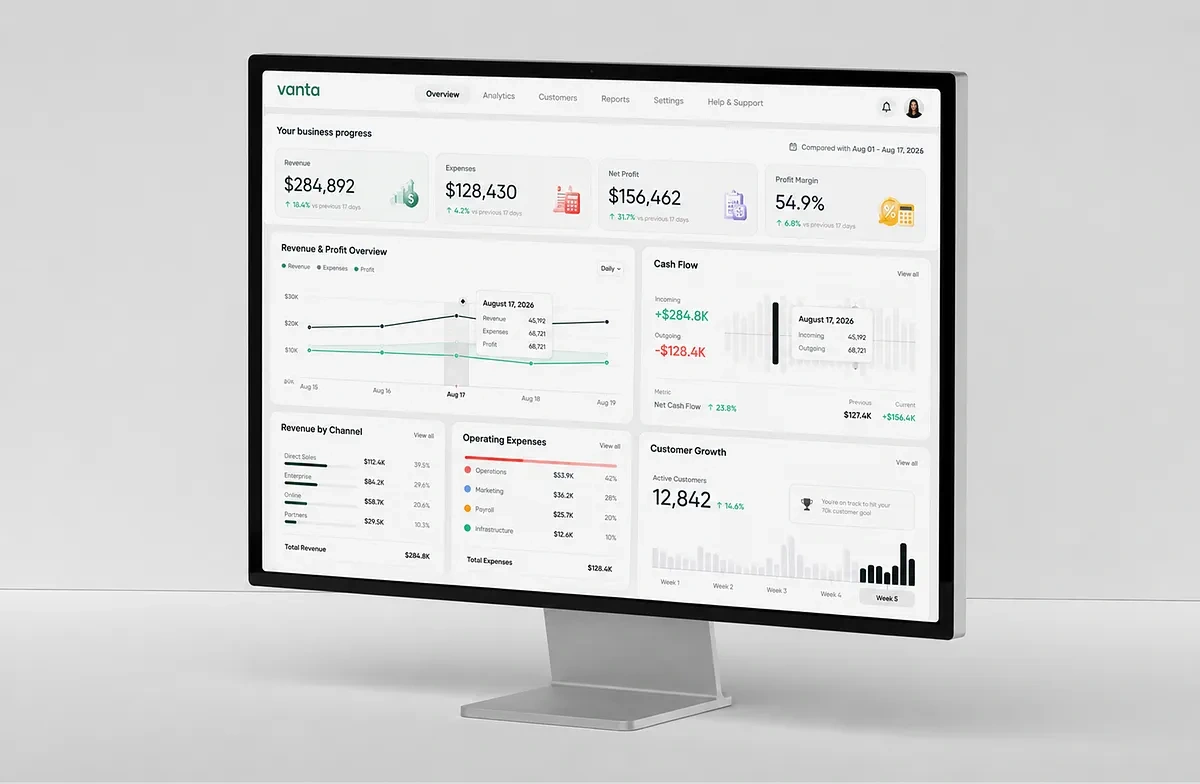
VANTA was designed to consolidate key performance drivers revenue stream, operational expenses, net profitability, cash flow velocity, and customer growth into a unified visual intelligence experience. The goal of this project was to transform complex multi-source data into an intuitive, decision-ready dashboard that feels less like static reporting and more like an actionable business co-pilot.
The Problem & Challenge
Traditional enterprise BI (Business Intelligence) dashboards commonly suffer from three core issues:
Siloed Data Metrics: Disconnect between financial performance (cash flow/expenses) and customer acquisition trends.
Cognitive Overload: Dense data grids and poorly layered visual hierarchies that cause fatigue among C-suite executives.
Lack of Decision Context: Raw metric callouts missing comparative baselines, directional sparklines, or historical context.
Core UX & Dashboard Architecture Solutions
A. Unified Multi-Metric Hub
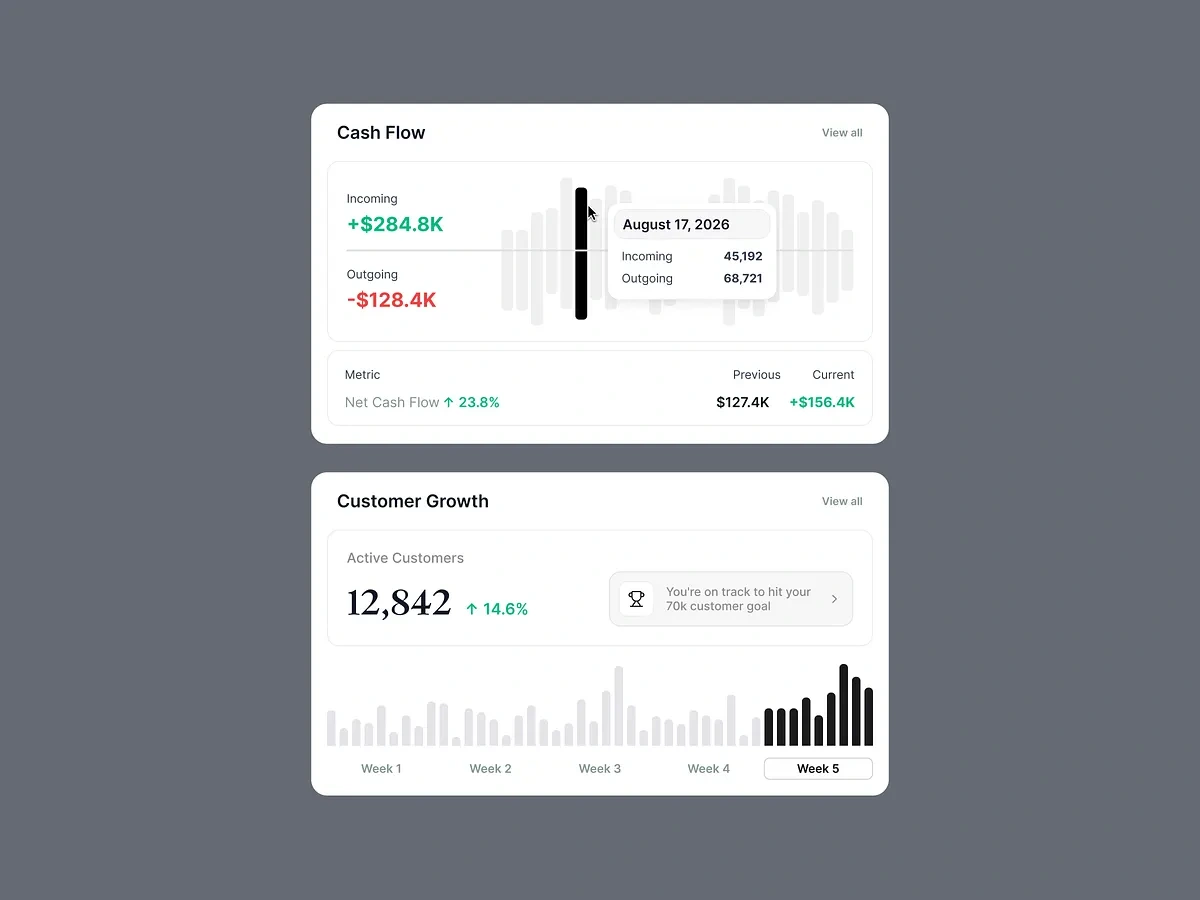
Synthesized 5 critical operational verticals into a scannable grid layout, enabling decision-makers to correlate revenue spikes directly with customer growth metrics.
B. Context-Rich Interactive Charts
Embedded comparative baseline overlays and trend indicators into chart cards to show real-time variance without cluttering the screen.
C. Scannable KPI Cards with Sparklines
Designed compact metric cards featuring inline directional micro-charts to provide instant visual context on historical performance.
Impact & Professional Takeaway
VANTA redefines enterprise data interaction by turning high-density business analytics into a clear visual dialogue. By prioritizing clarity, visual hierarchy, and contextual charts, the dashboard empowers teams to spend less time parsing numbers and more time driving strategic growth.
Like this project
Posted Aug 27, 2026
Running a business means constantly connecting the numbers. VANTA is designed to make those connections easier to see.
Likes
1
Views
13