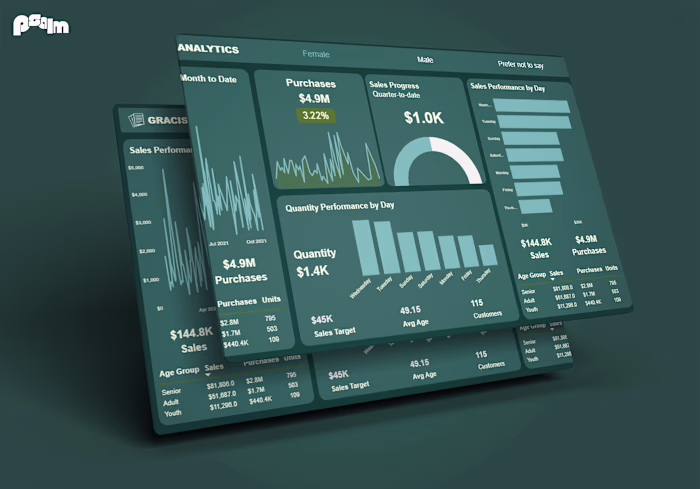
Power BI Performance Insights Dashboard
Samuel Precious
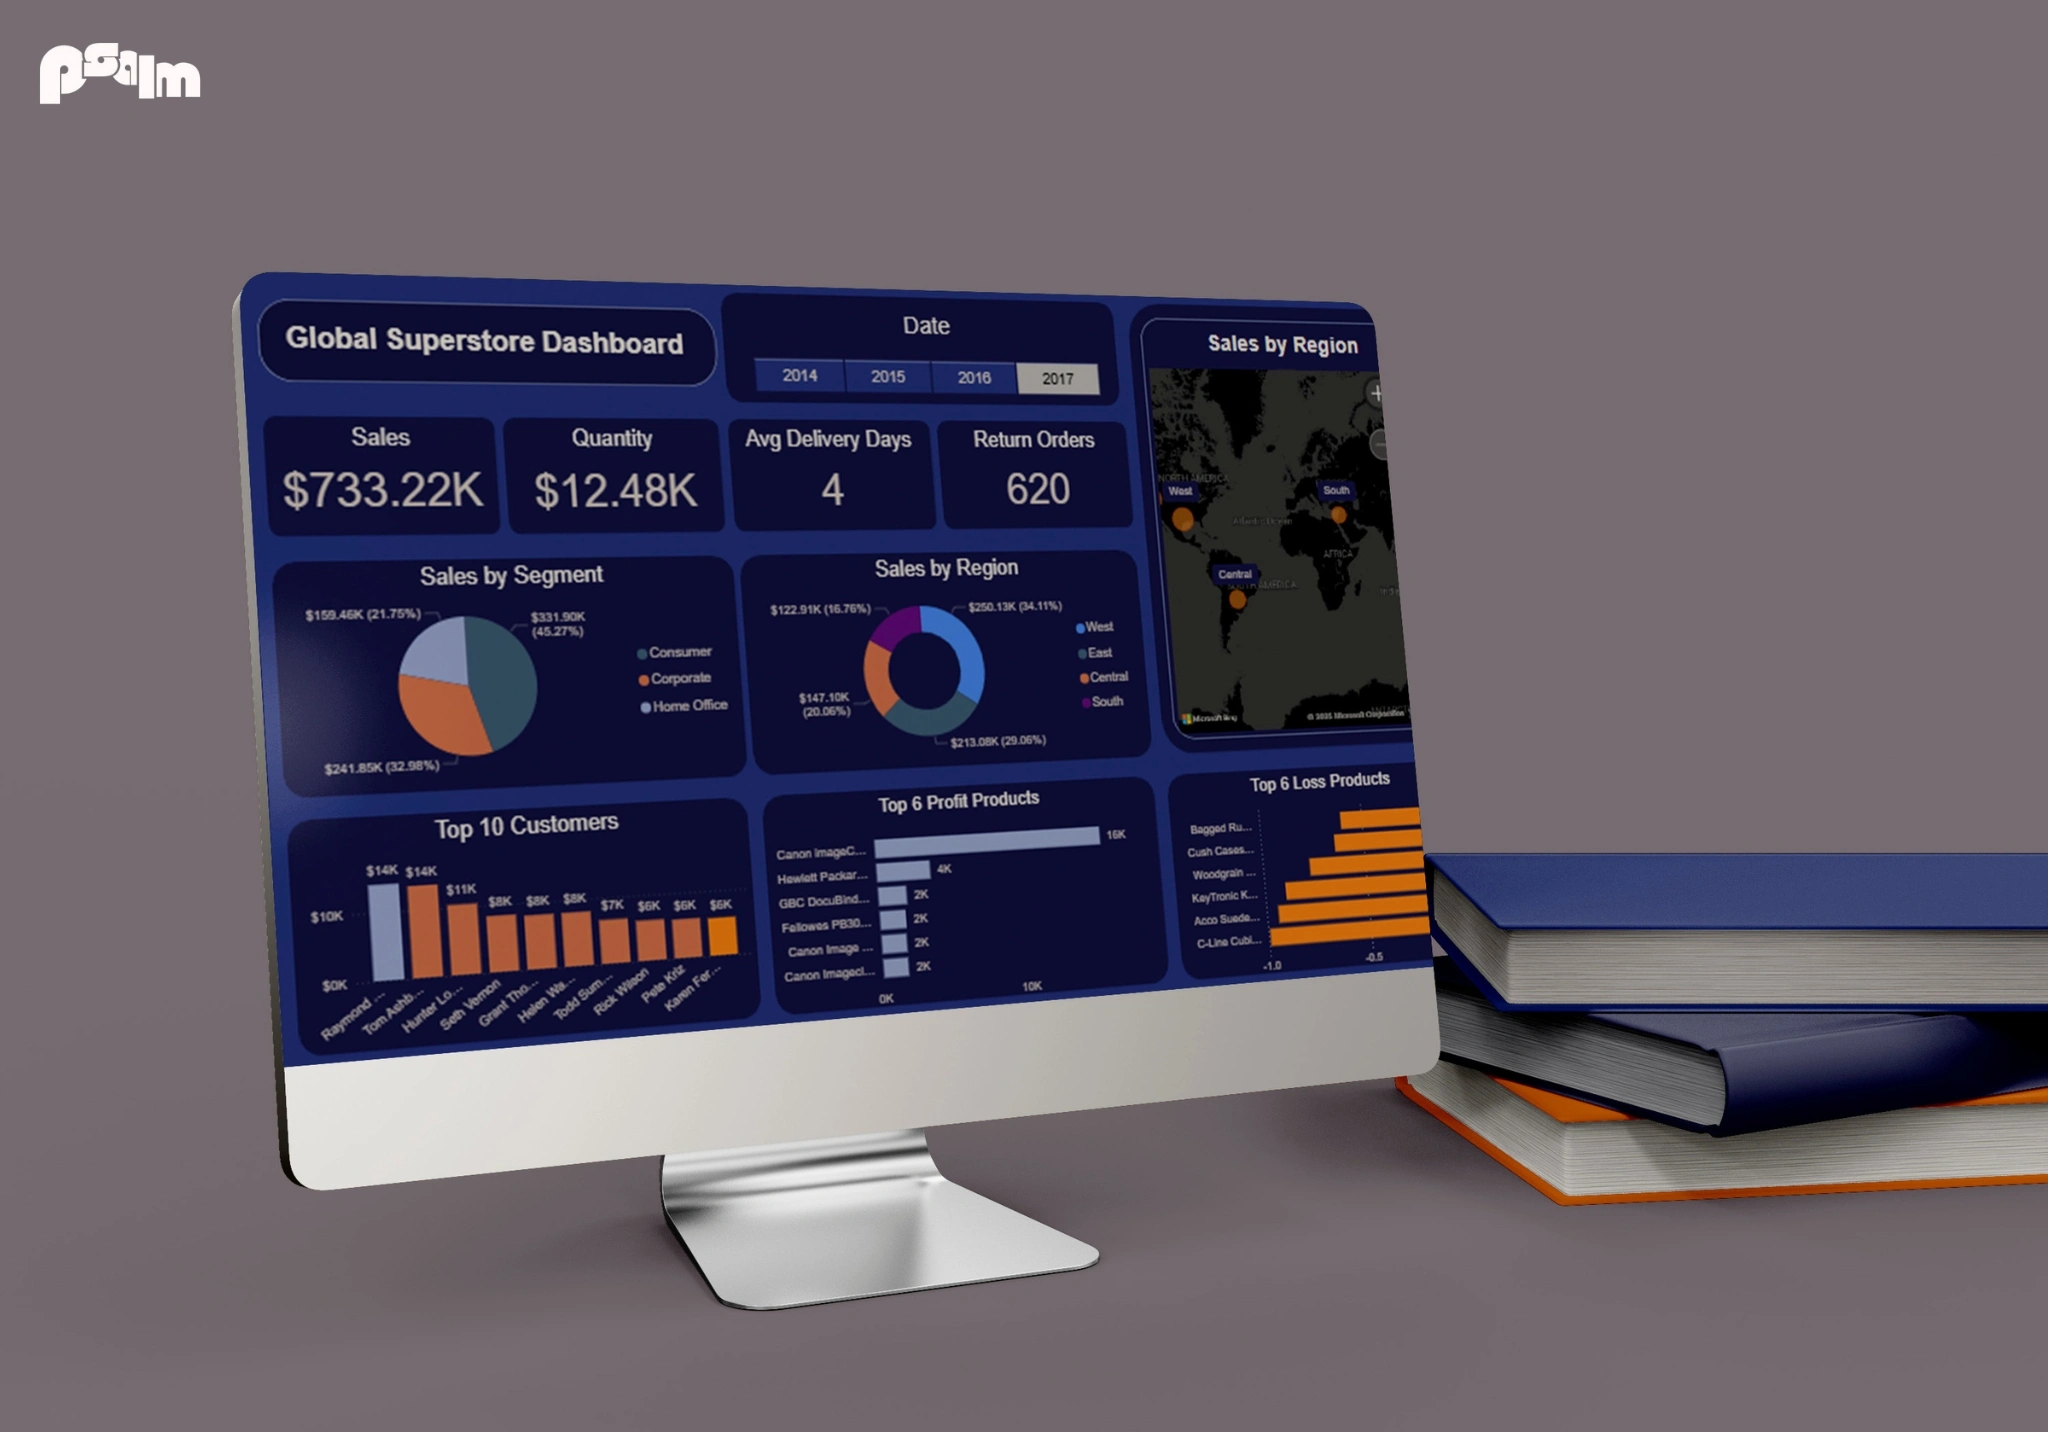
Global Superstore Dashboard Overview
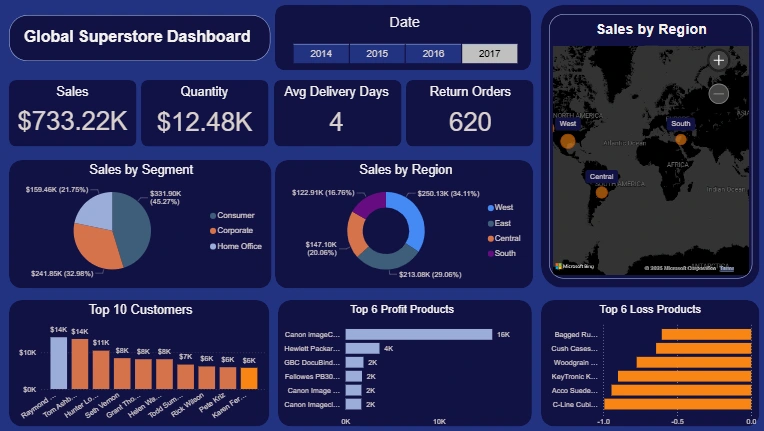
From the above dashboard, the store achieved $733.22 in total sales across 12.48K units, with an average delivery time of four days and only 620 returns in the year 2017. Consumer accounts drove nearly half the revenue at 45%, followed by corporate at 33% and Home Office at 22%. Geographically, the West led the way with 34% of sales, trailed by the East at 29%, the Central at 19%, and the West at 17%.
The store's top customer alone contributed $14K in purchases, while the Canon product delivered the highest profit of $16K. On the flip side, Bagged Rubber Bands recorded a $1K loss, pinpointing an opportunity for cost optimization. This concise overview captures the critical insights and lays out a clear path for driving future growth.
Like this project
Posted Jul 22, 2025
There was a problem with the sales, and units changed. built a clear data model in Power BI, wrote DAX formulas, and designed an interactive dashboard.
Likes
1
Views
9
Timeline
Jun 17, 2025 - Jun 21, 2025