
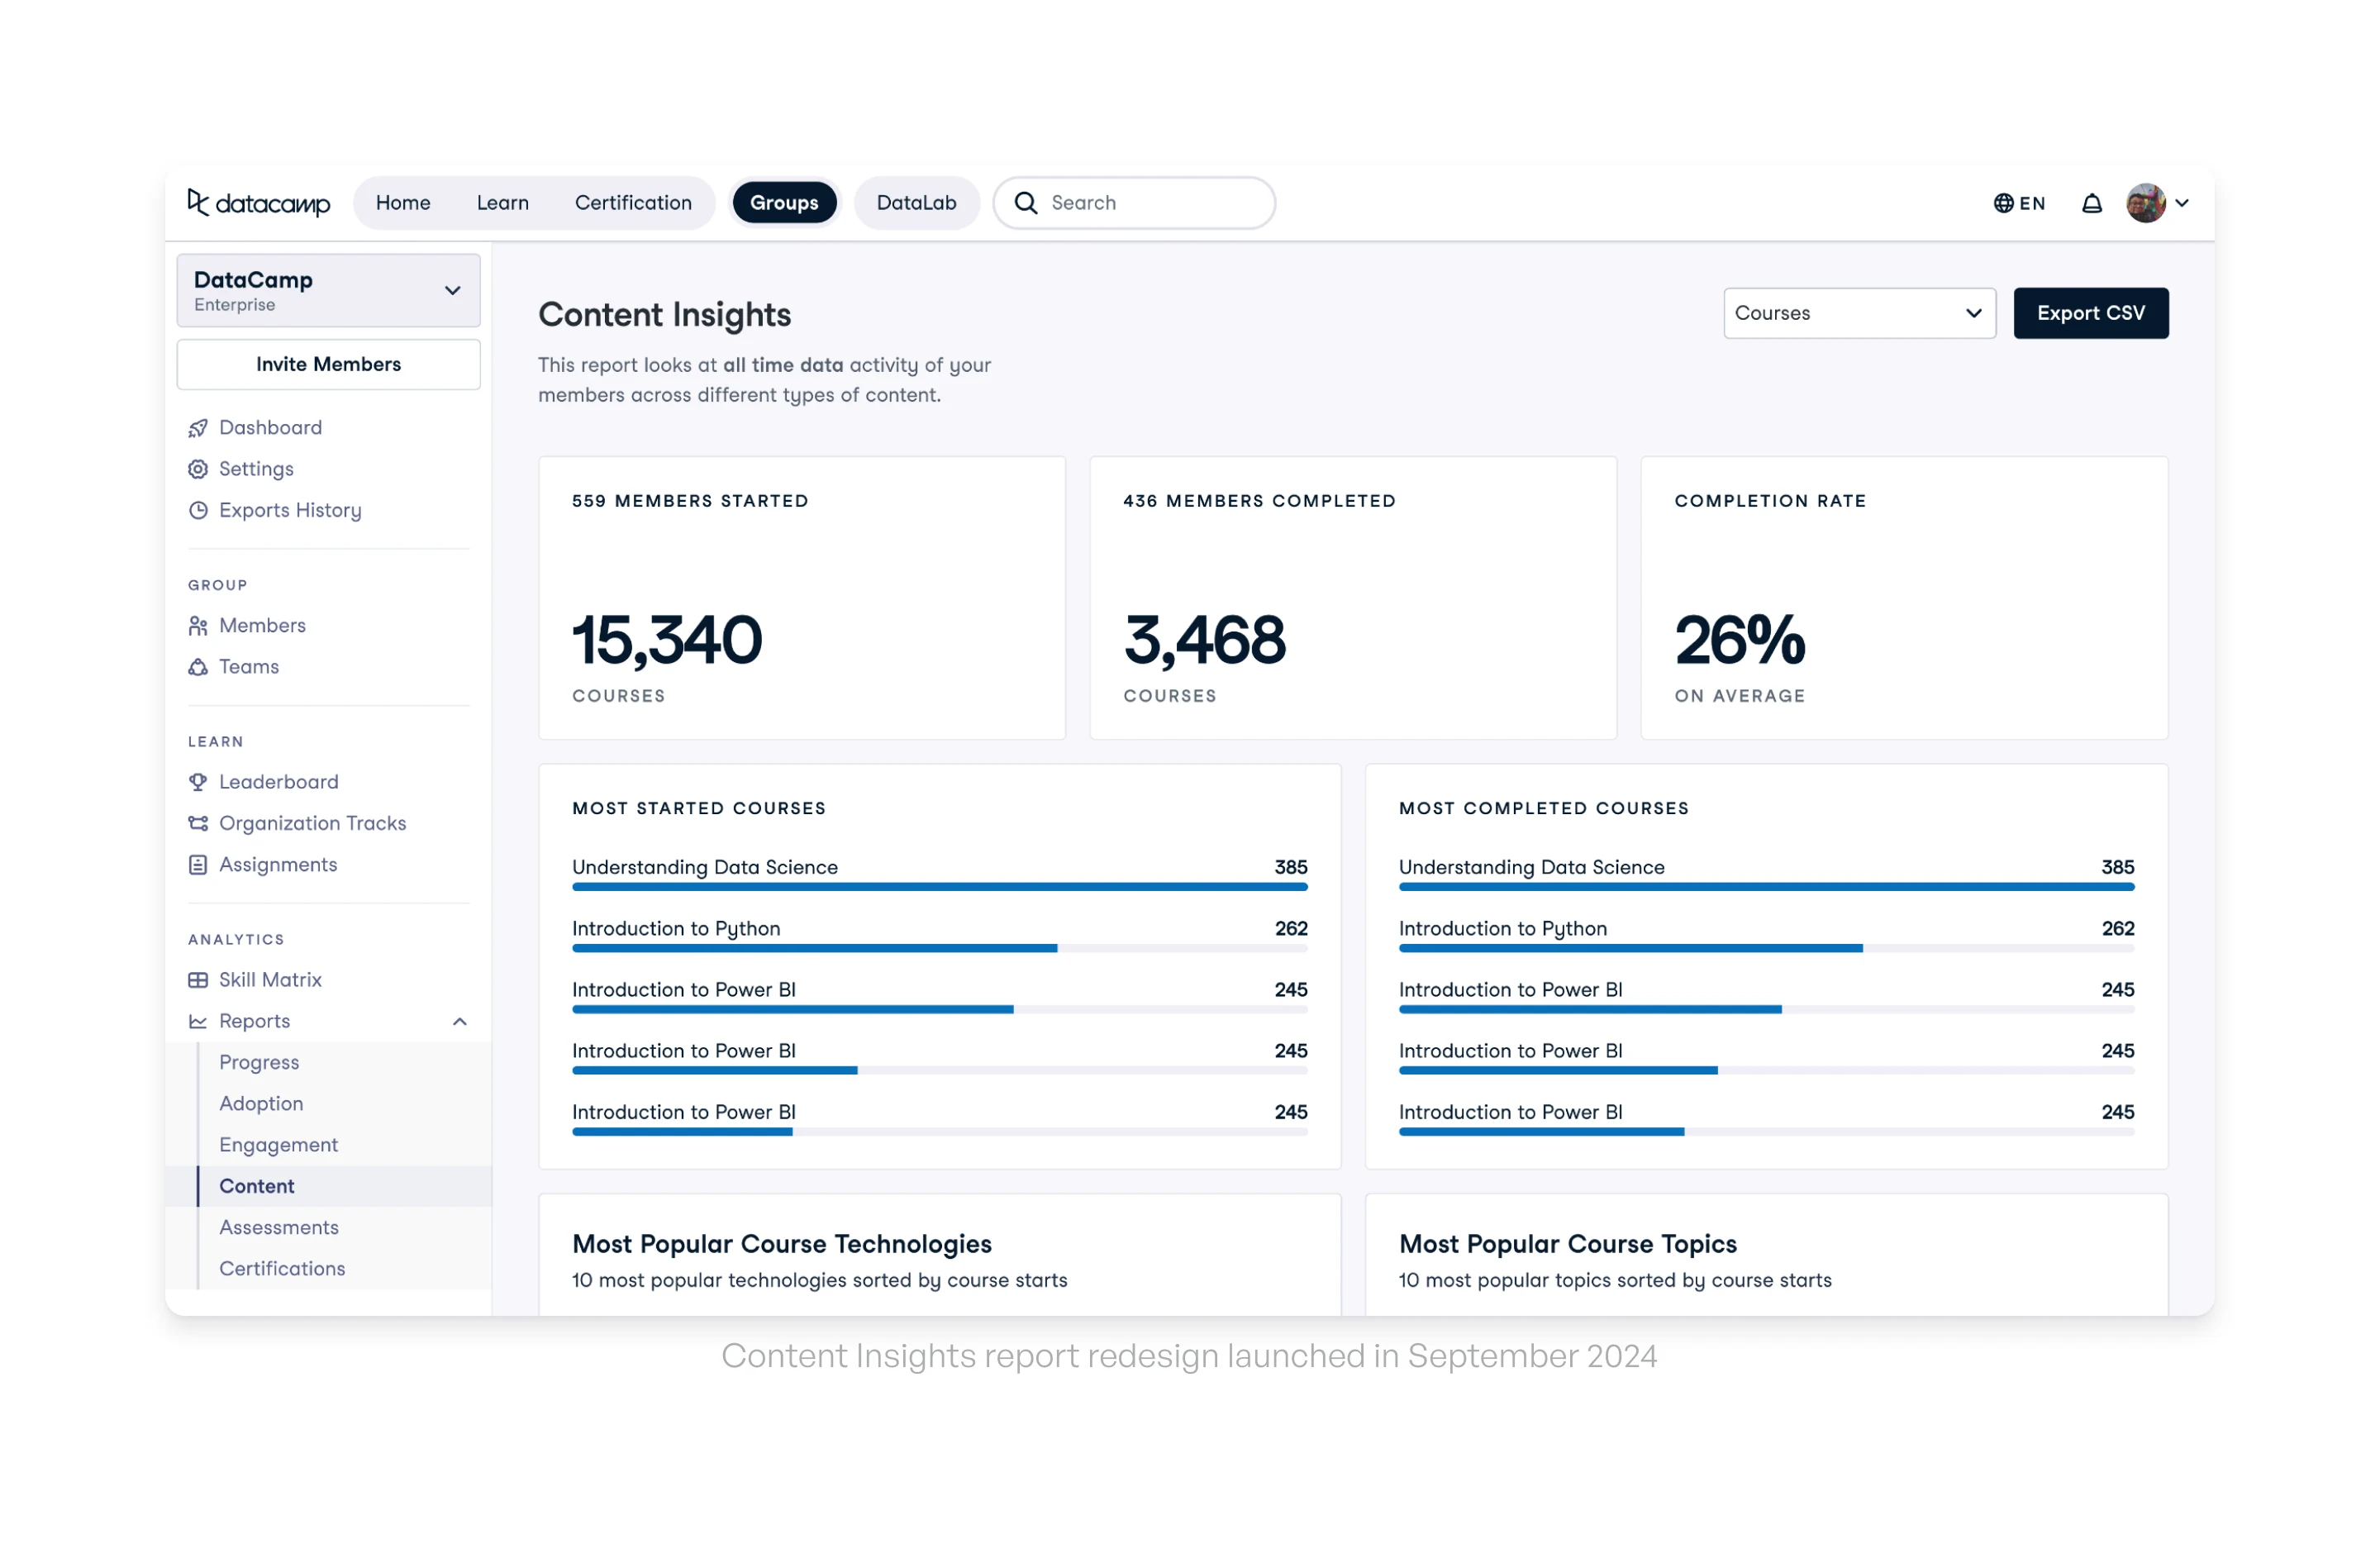
Content Insights report redesign
Increased B2B customer retention by 8% by redesigning in-app reports
Increased B2B customer retention by 8% in the US by identifying underutilized learner insights and redesigning in-app reports, enabling customers to make data-driven decisions about engagement and training effectiveness, while also equipping the account management team to proactively engage at-risk accounts.
Problem
Challenges in tracking employee training: limited insights and technical barriers
Customers wanted to track the effectiveness of their learners' training to measure ROI and confidently present program progress to their leadership team while advocating for DataCamp’s product.
However, the in-app reports provided by DataCamp lacked meaningful insights. A key frustration was that most content-related data was buried within a complex technical workflow, requiring assistance from their IT department to access.
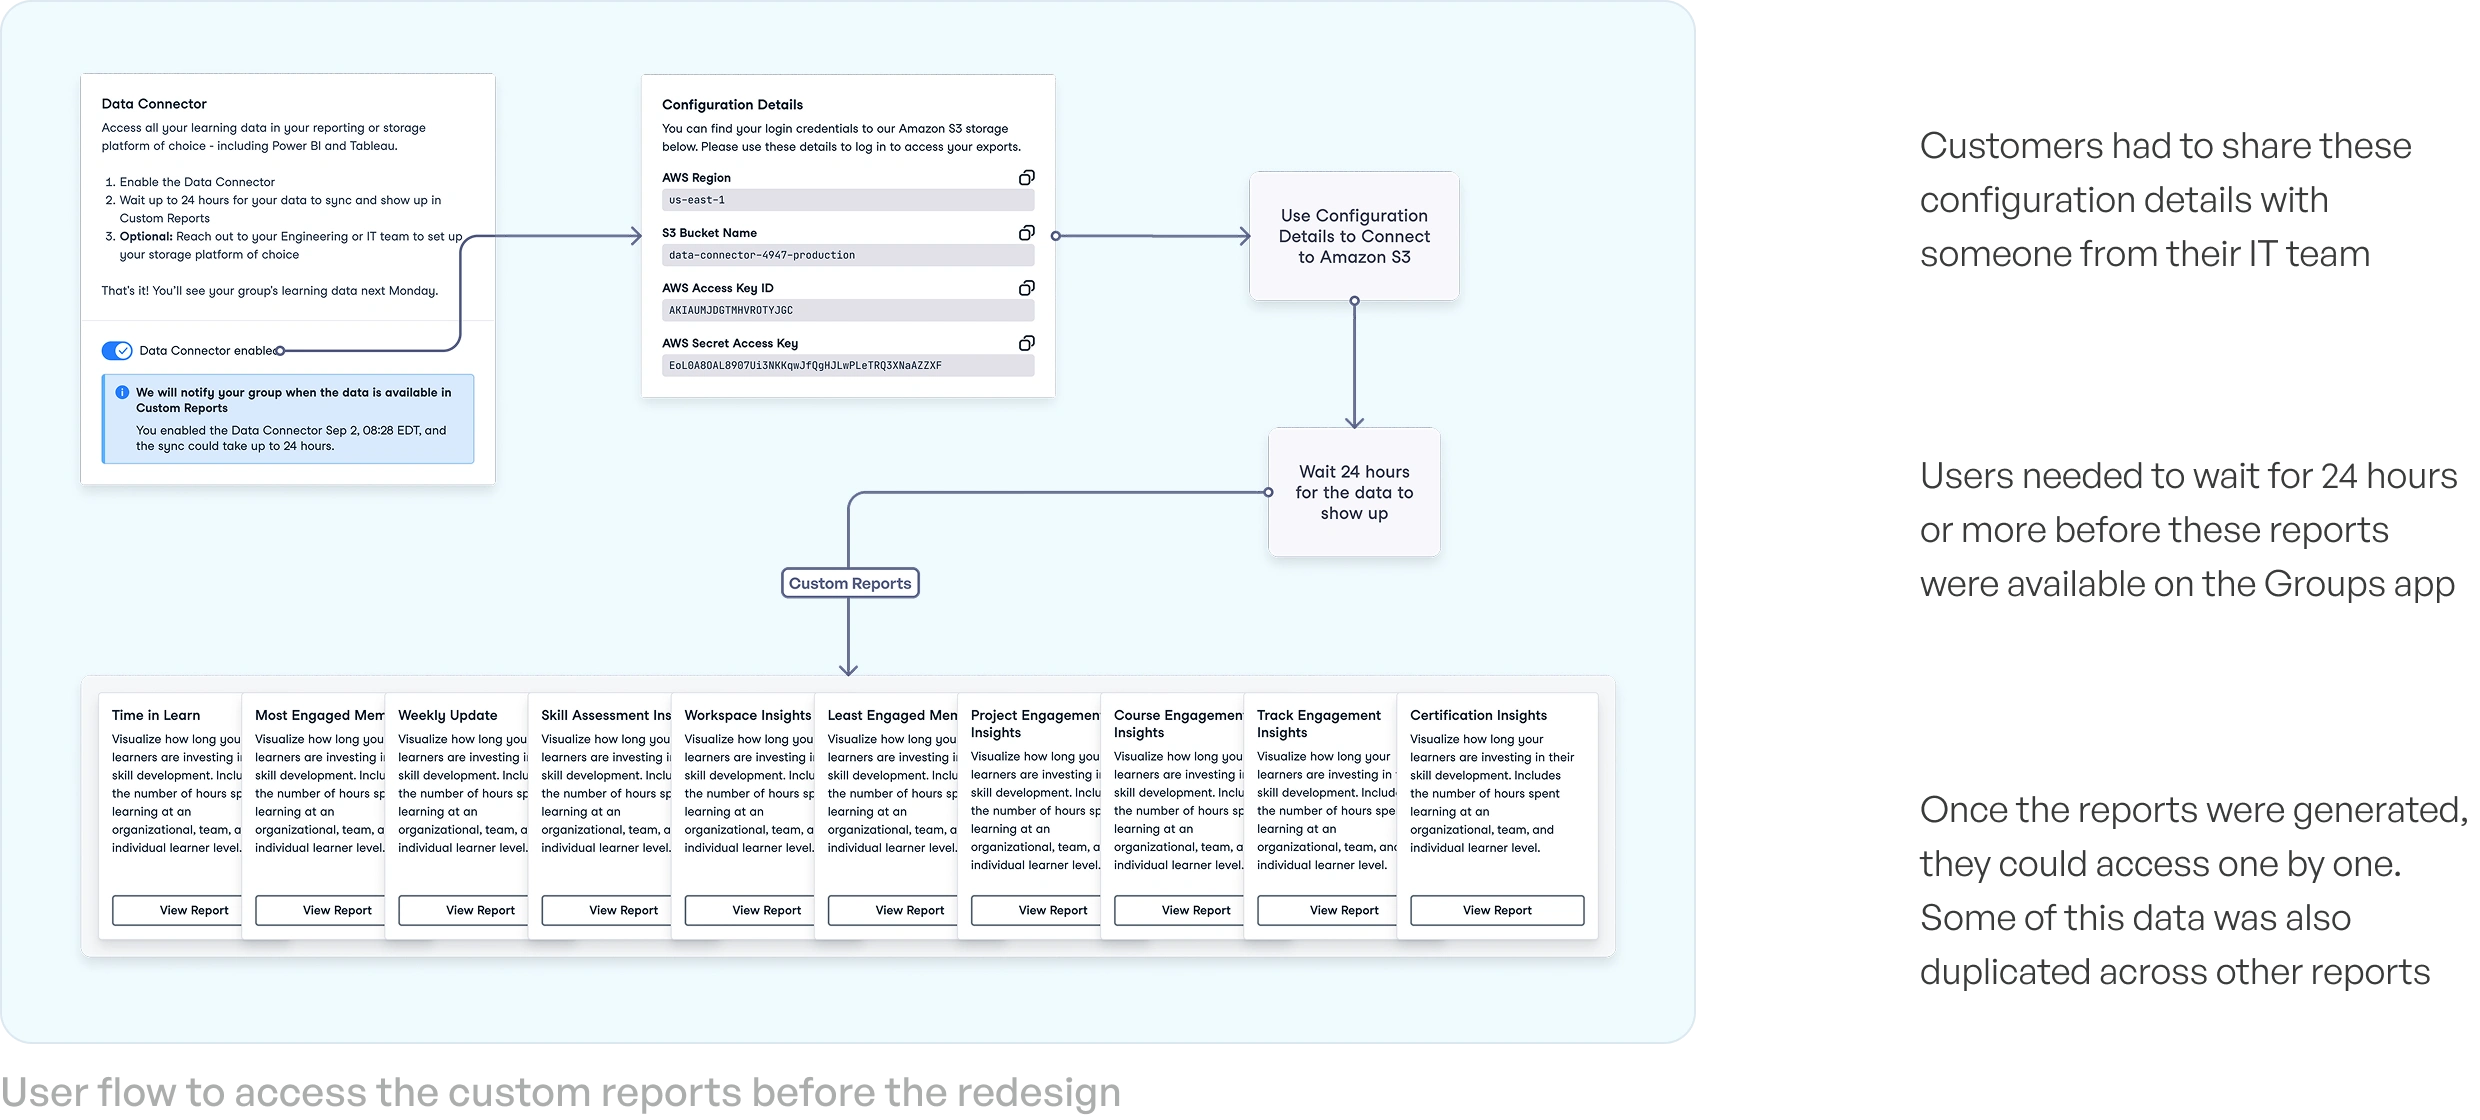
User flow to access custom reports before the redesign
Design principles
Designing insightful in-app reports
While interviewing users during my time at DataCamp, it was evident there were three key principles I needed to base my designs on.
01. Shorten time to value
The soonest we could help customers find the data for their QBRs meetings, the higher the chance of retention.
02. Give a sense of control
Customers expressed the need to have control over their learning data from each of the reports.
03. Consistency above all
To keep building trust with our customers, it was key to be consistent with the data and the user interface.
Process
How might we improve in-app reports to increase customer retention?
Enhancing in-app reports was a complex, cross-functional initiative with many moving parts. Given that reports constitute 60% of DataCamp’s B2B app, we recognized the project's scale and significance.
Following the loss of a major customer, the business could not afford to lose another key player. Strengthening reporting capabilities, providing actionable insights, and empowering customers with greater control over their data were critical to ensuring the success of this redesign.
01. Data Mapping Analysis
The first phase of the project focused on analyzing data and mapping it to either existing or new reports. To accelerate delivery, I minimized engineering effort by identifying data points that could be integrated into existing reports and prioritizing high-impact, low-risk changes.
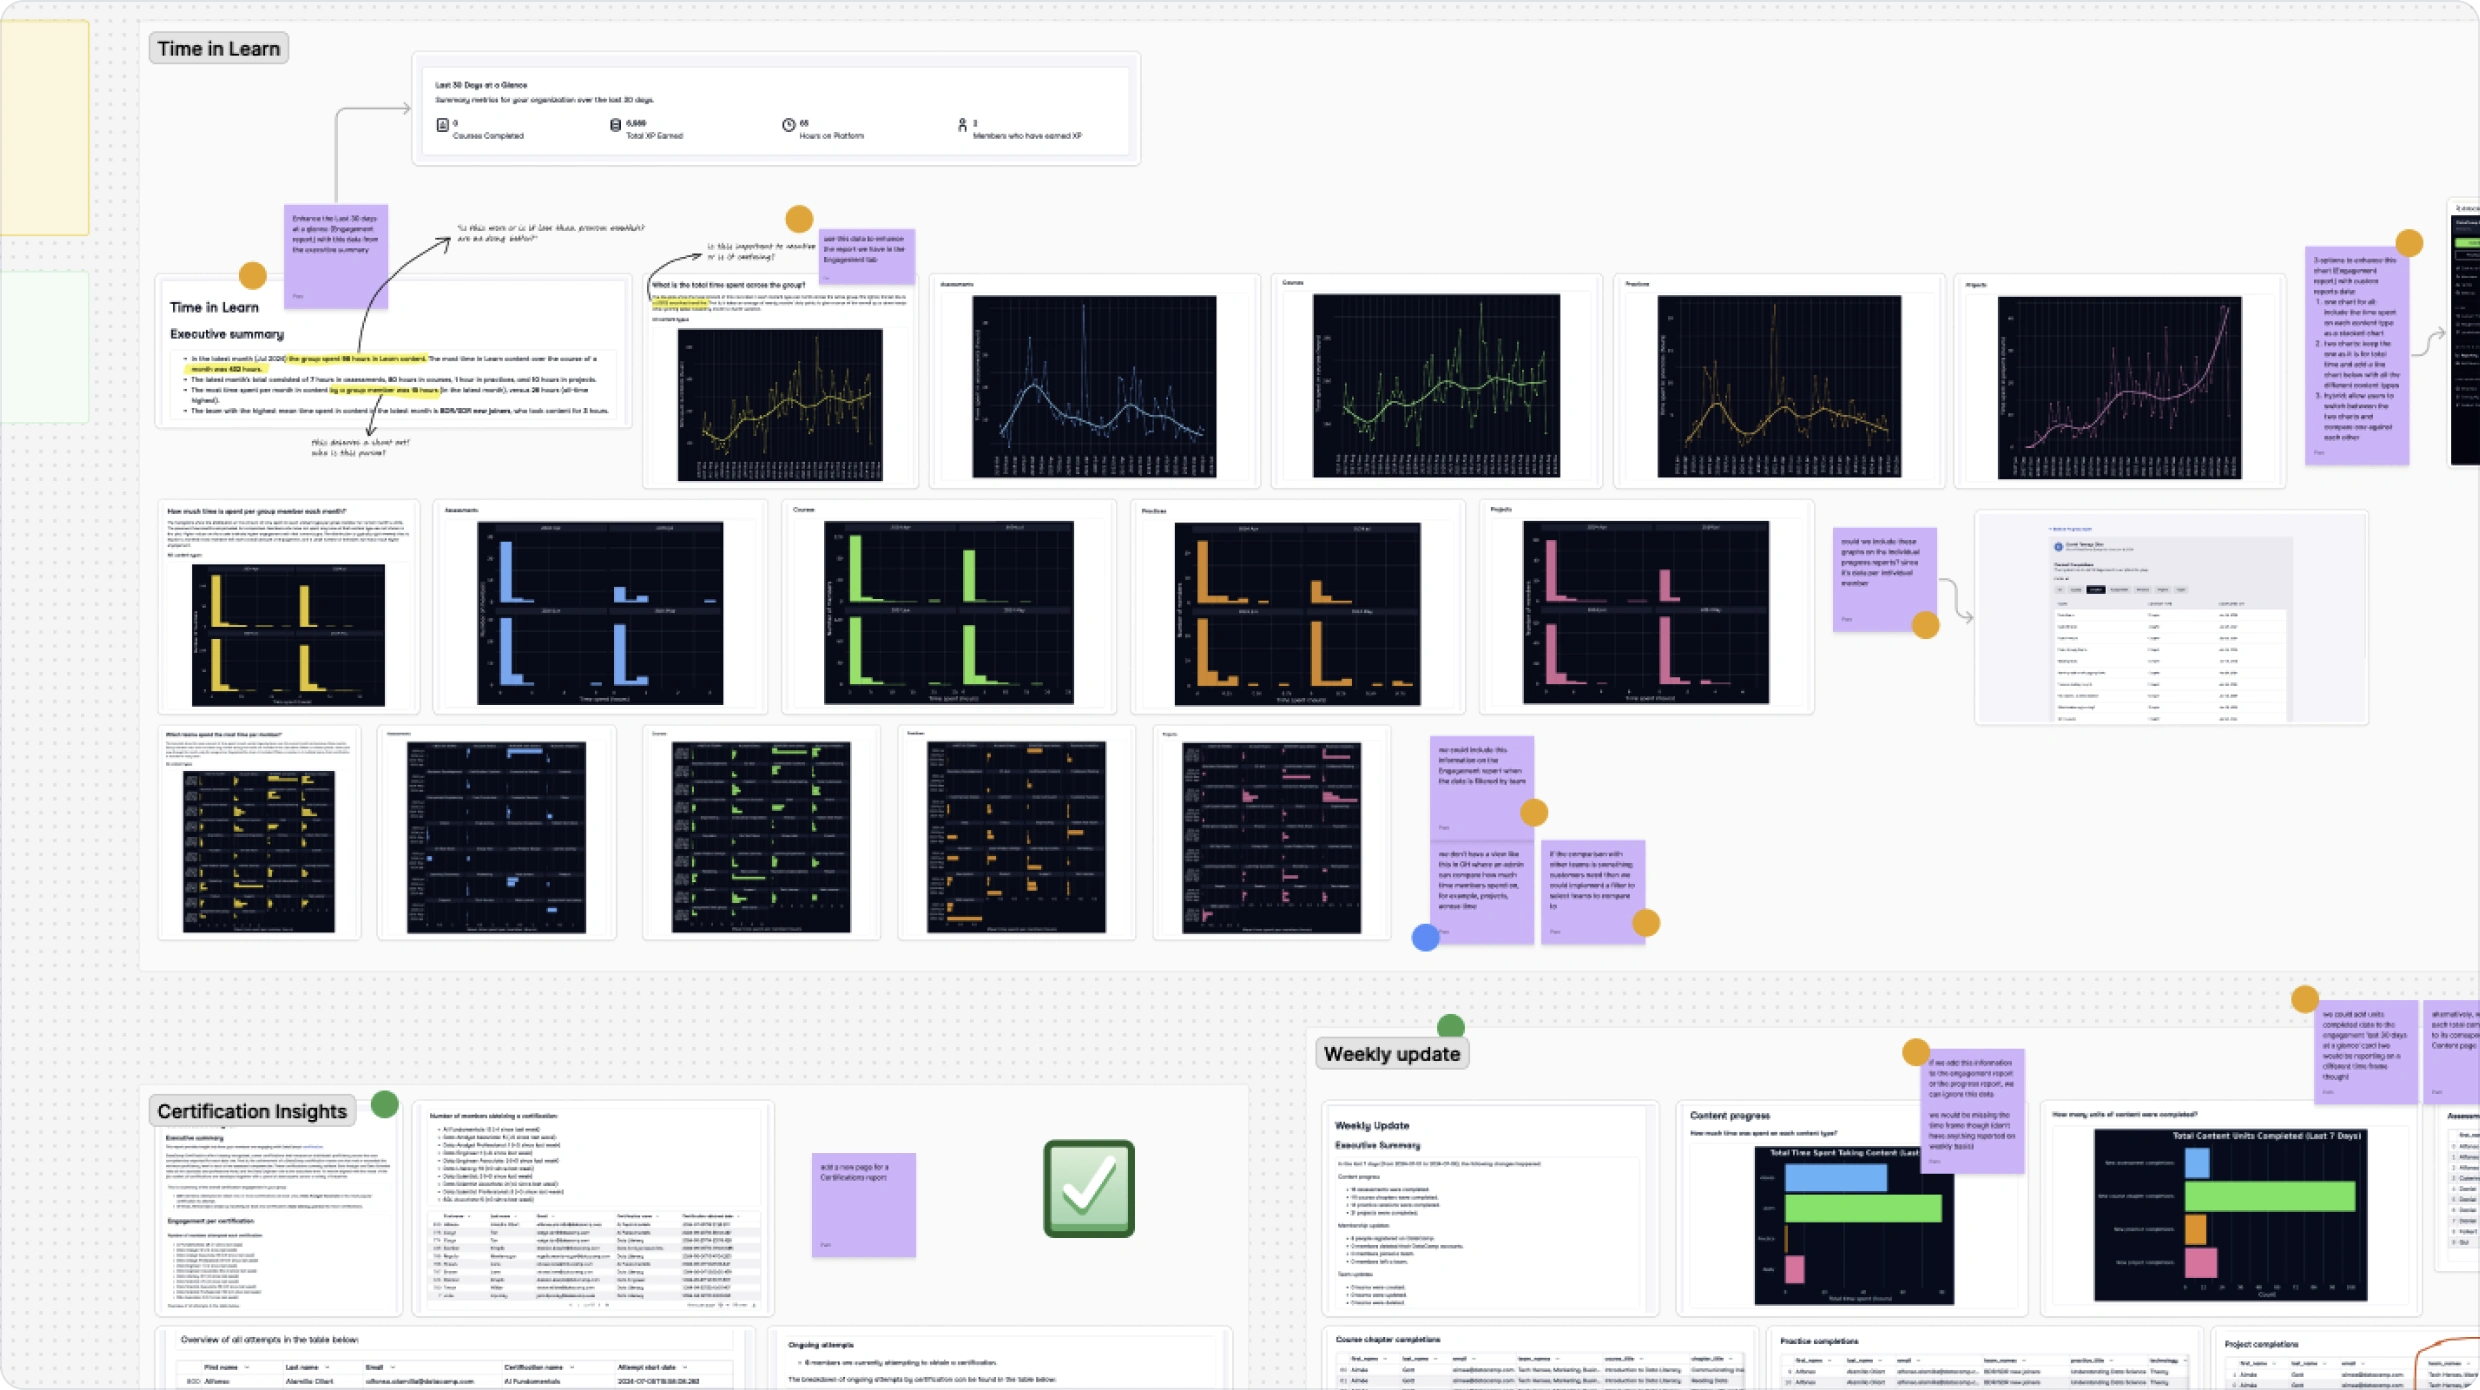
Data analysis
02. Designs and iterations
Given the project's complexity and risk, I ensured that design iterations were communicated to stakeholders early and validated with users throughout the process.
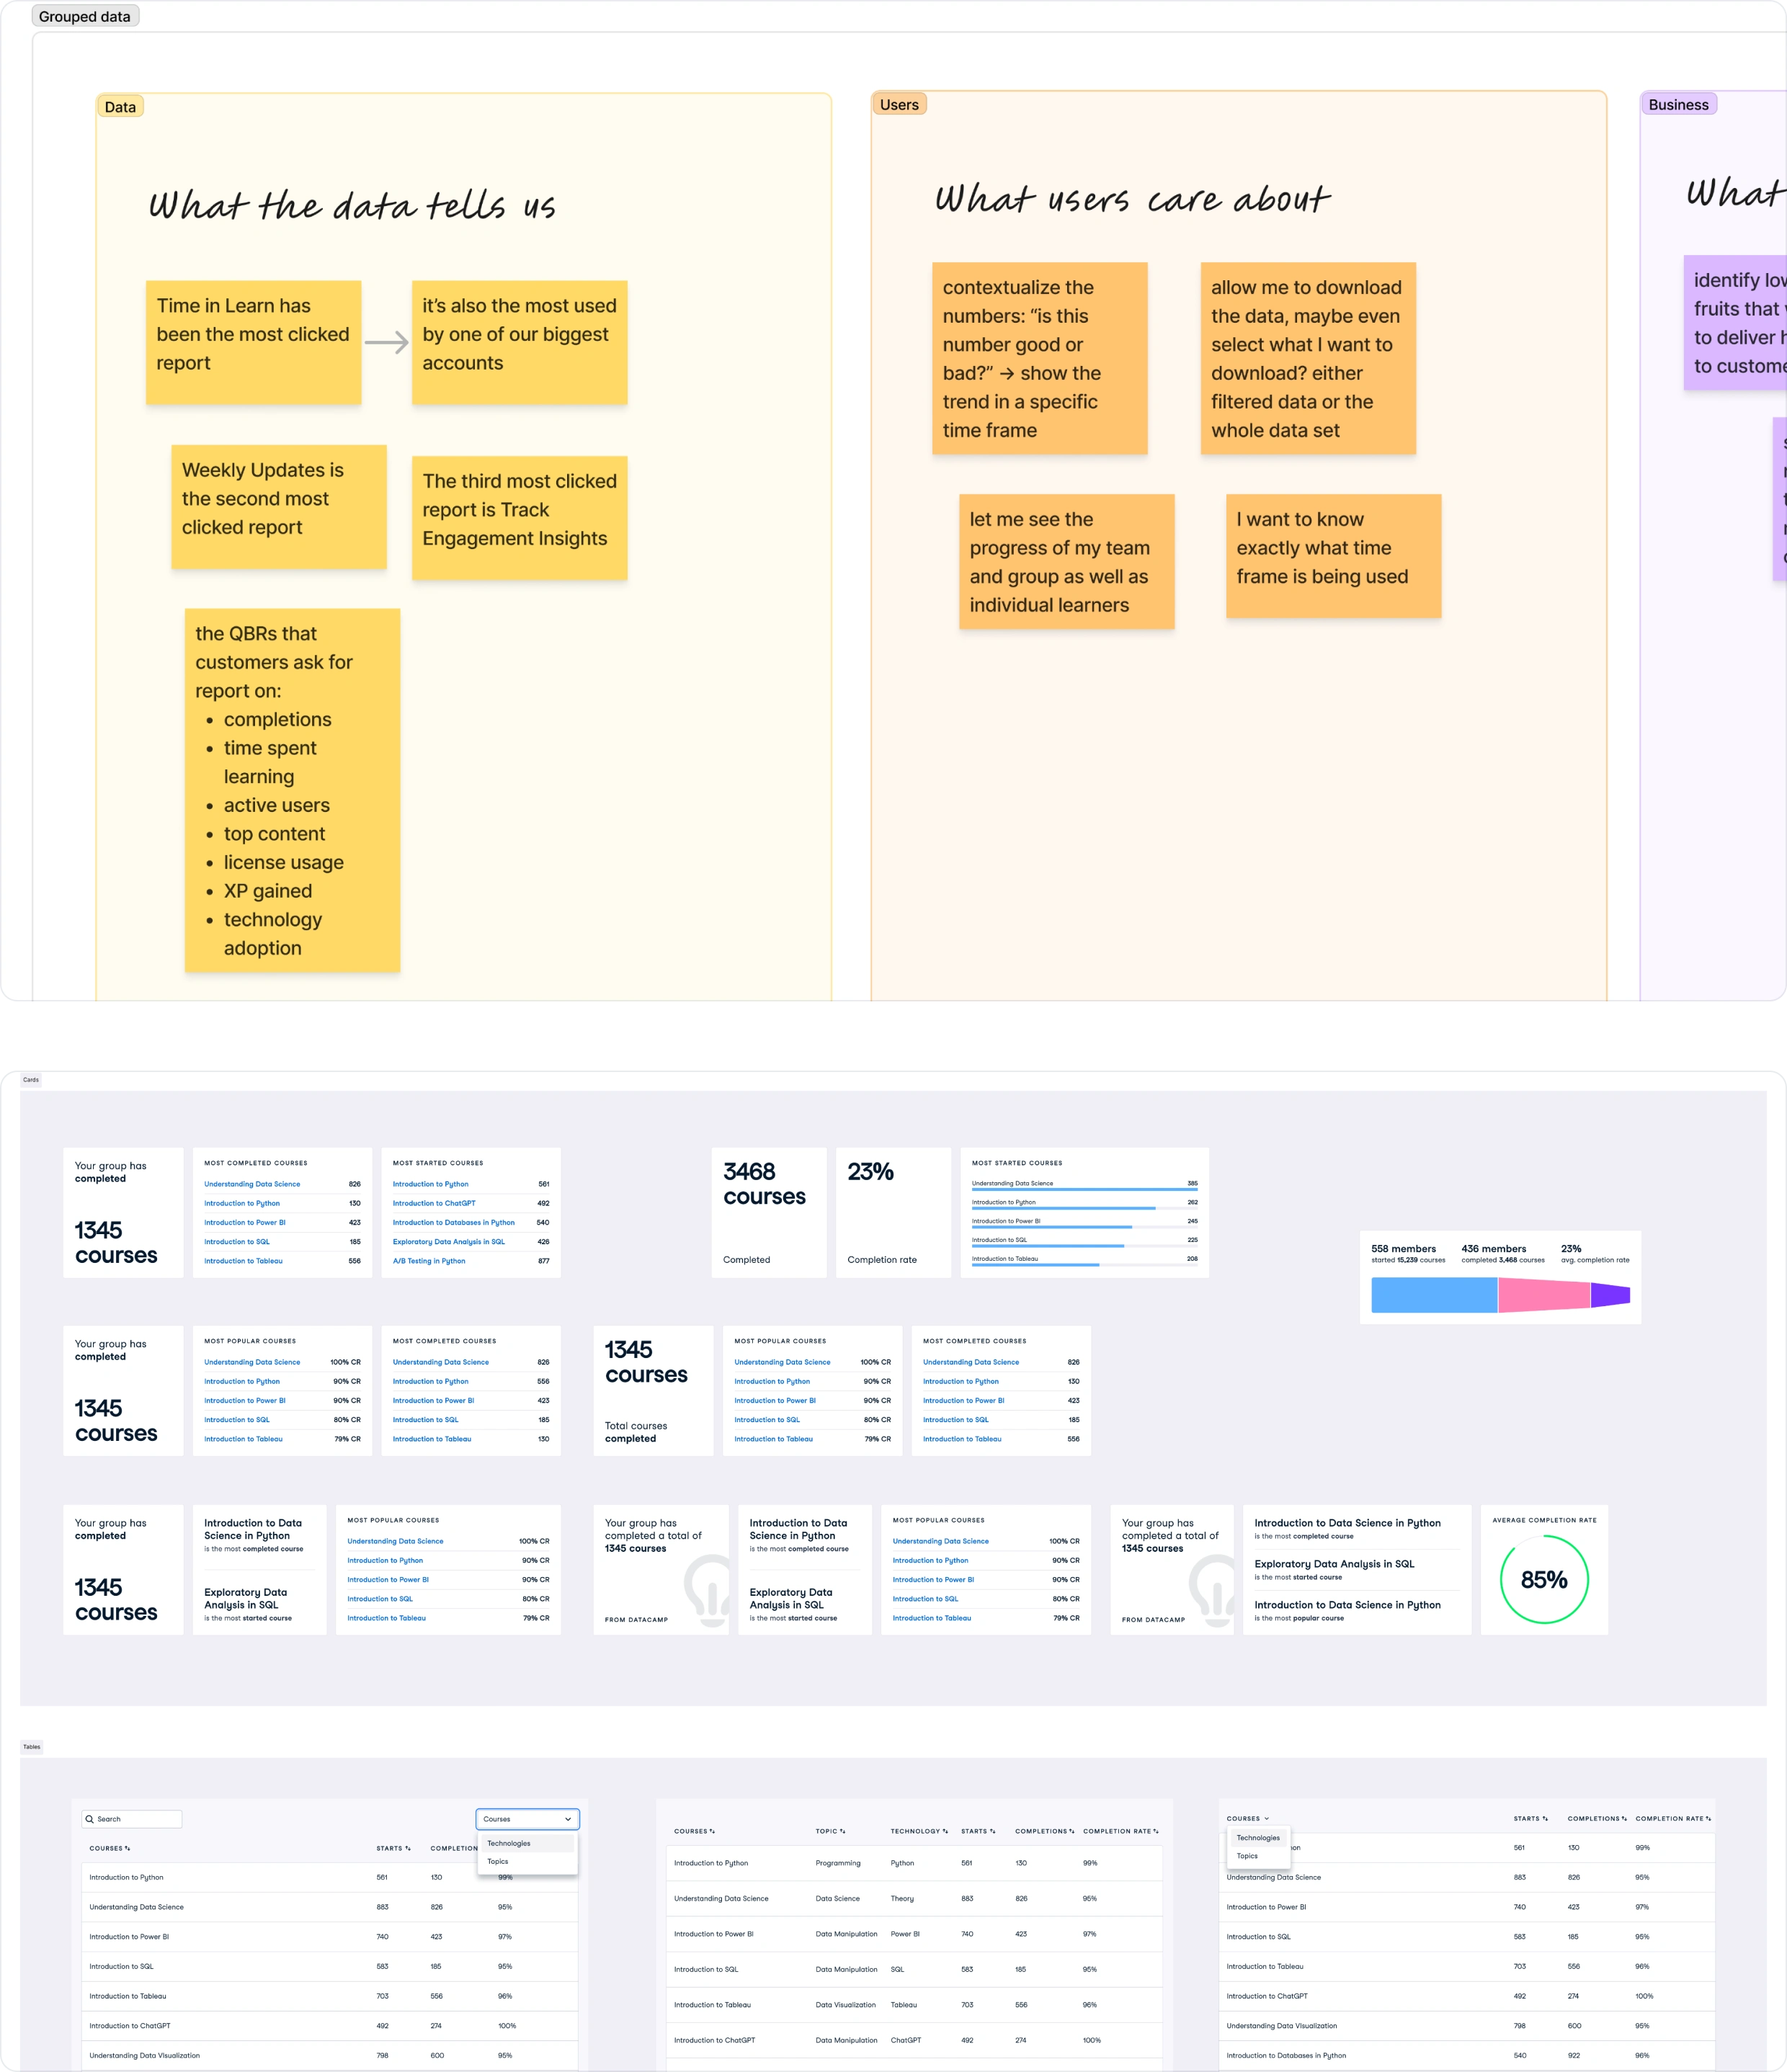
Design iterations
Design nuggets
The compound effect of seemingly small design choices
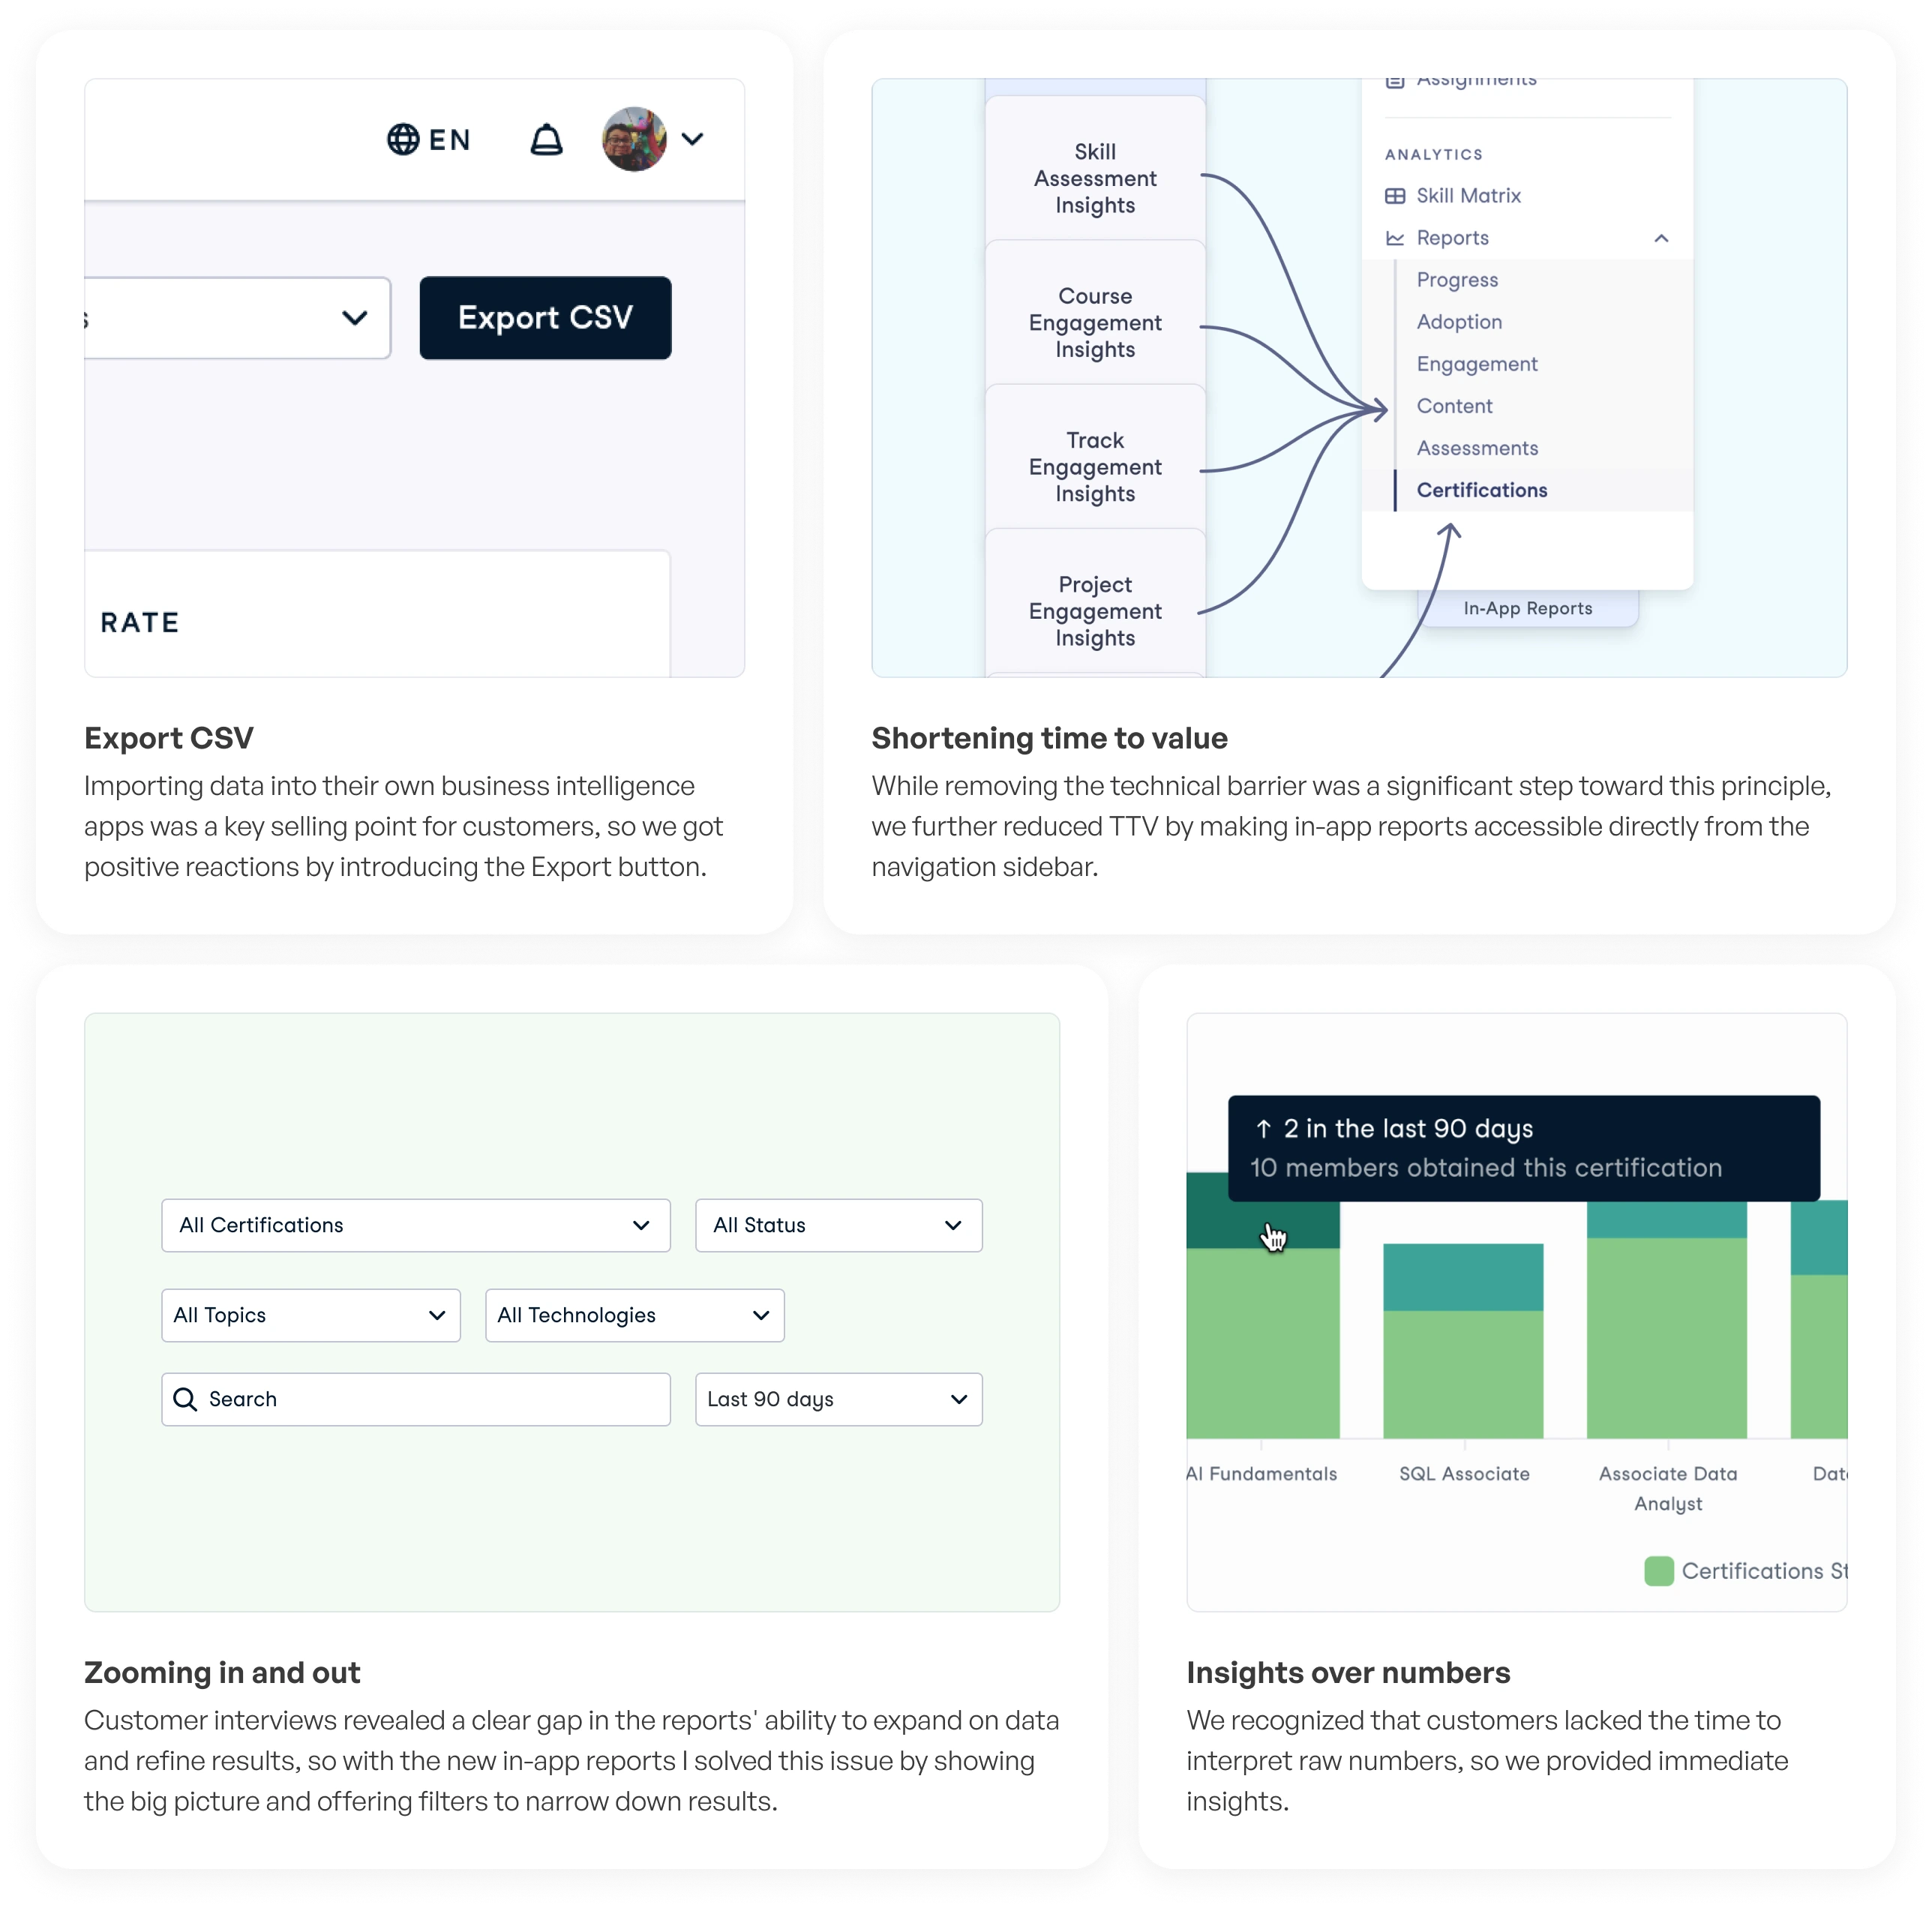
Design components
Selection of graphs
Preference for the stacked bar chart was obvious during user testing
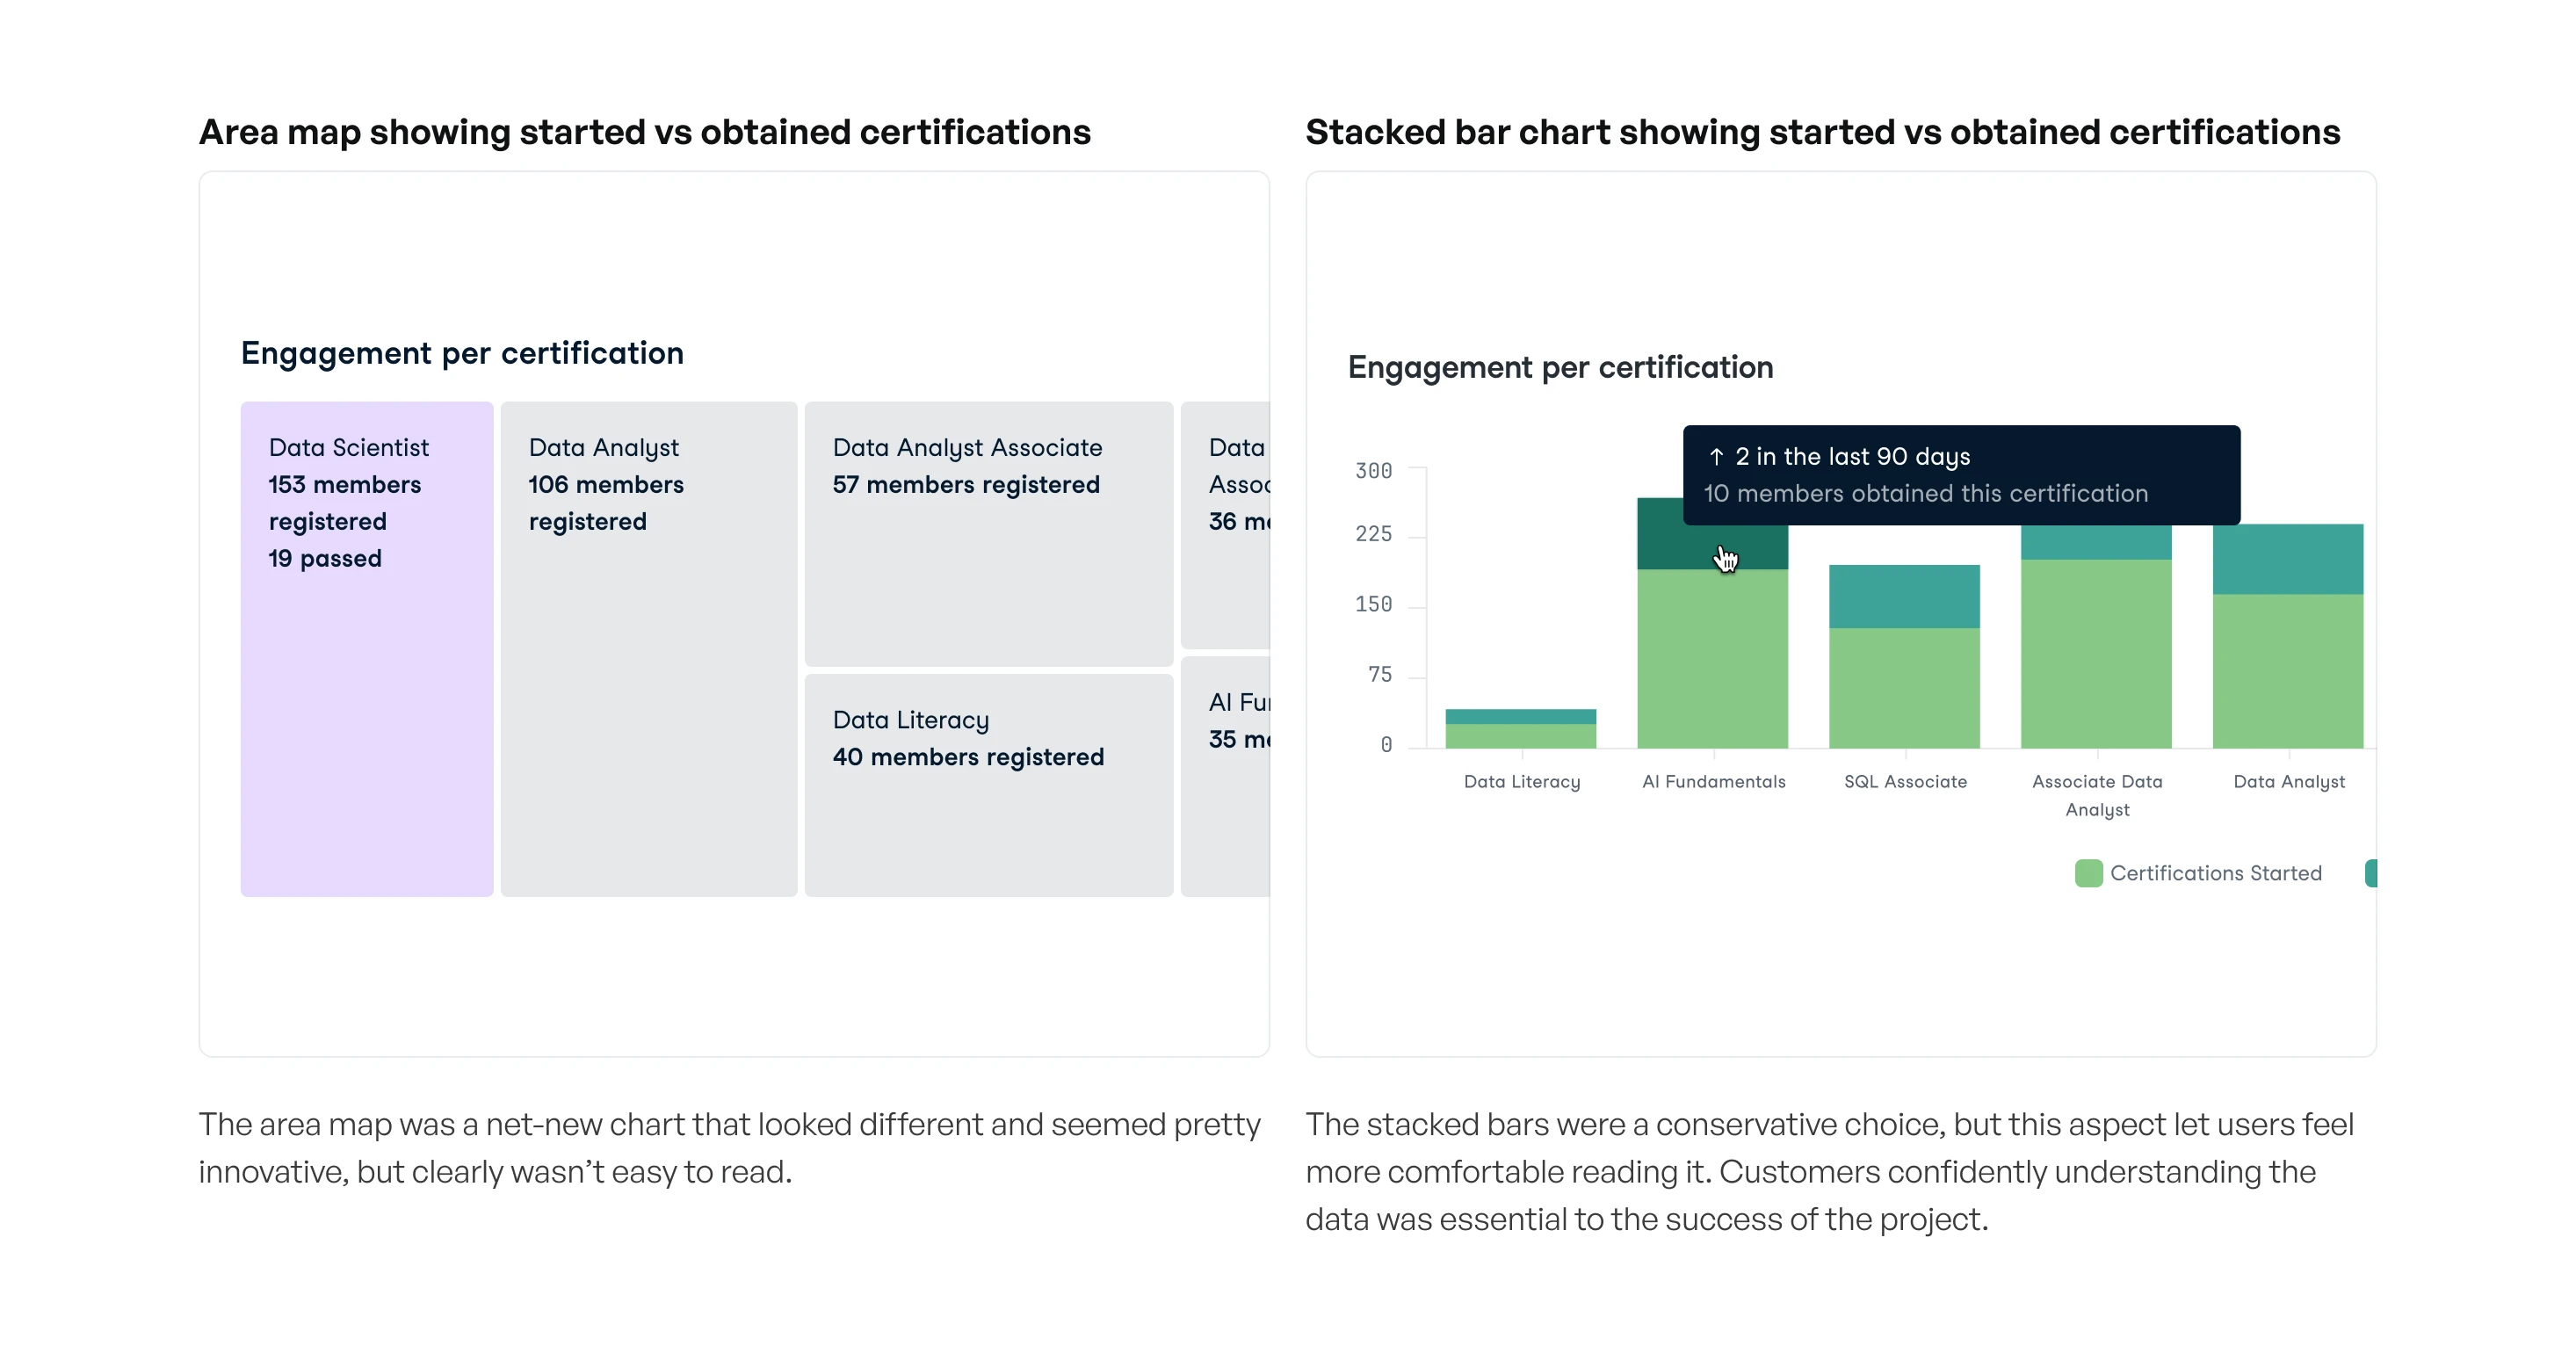
Graph selection
Impact
Bridged design, engineering, and sales to enhance efficiency, retention, and revenue growth
8% increase in customer retention, and:
Increased team work efficiency by involving engineers early on during in the design process
Enabled account managers to engage at-risk accounts and empowered the sales team to secure new contracts
Decreased development costs by improving collaboration and creating common patterns across the app
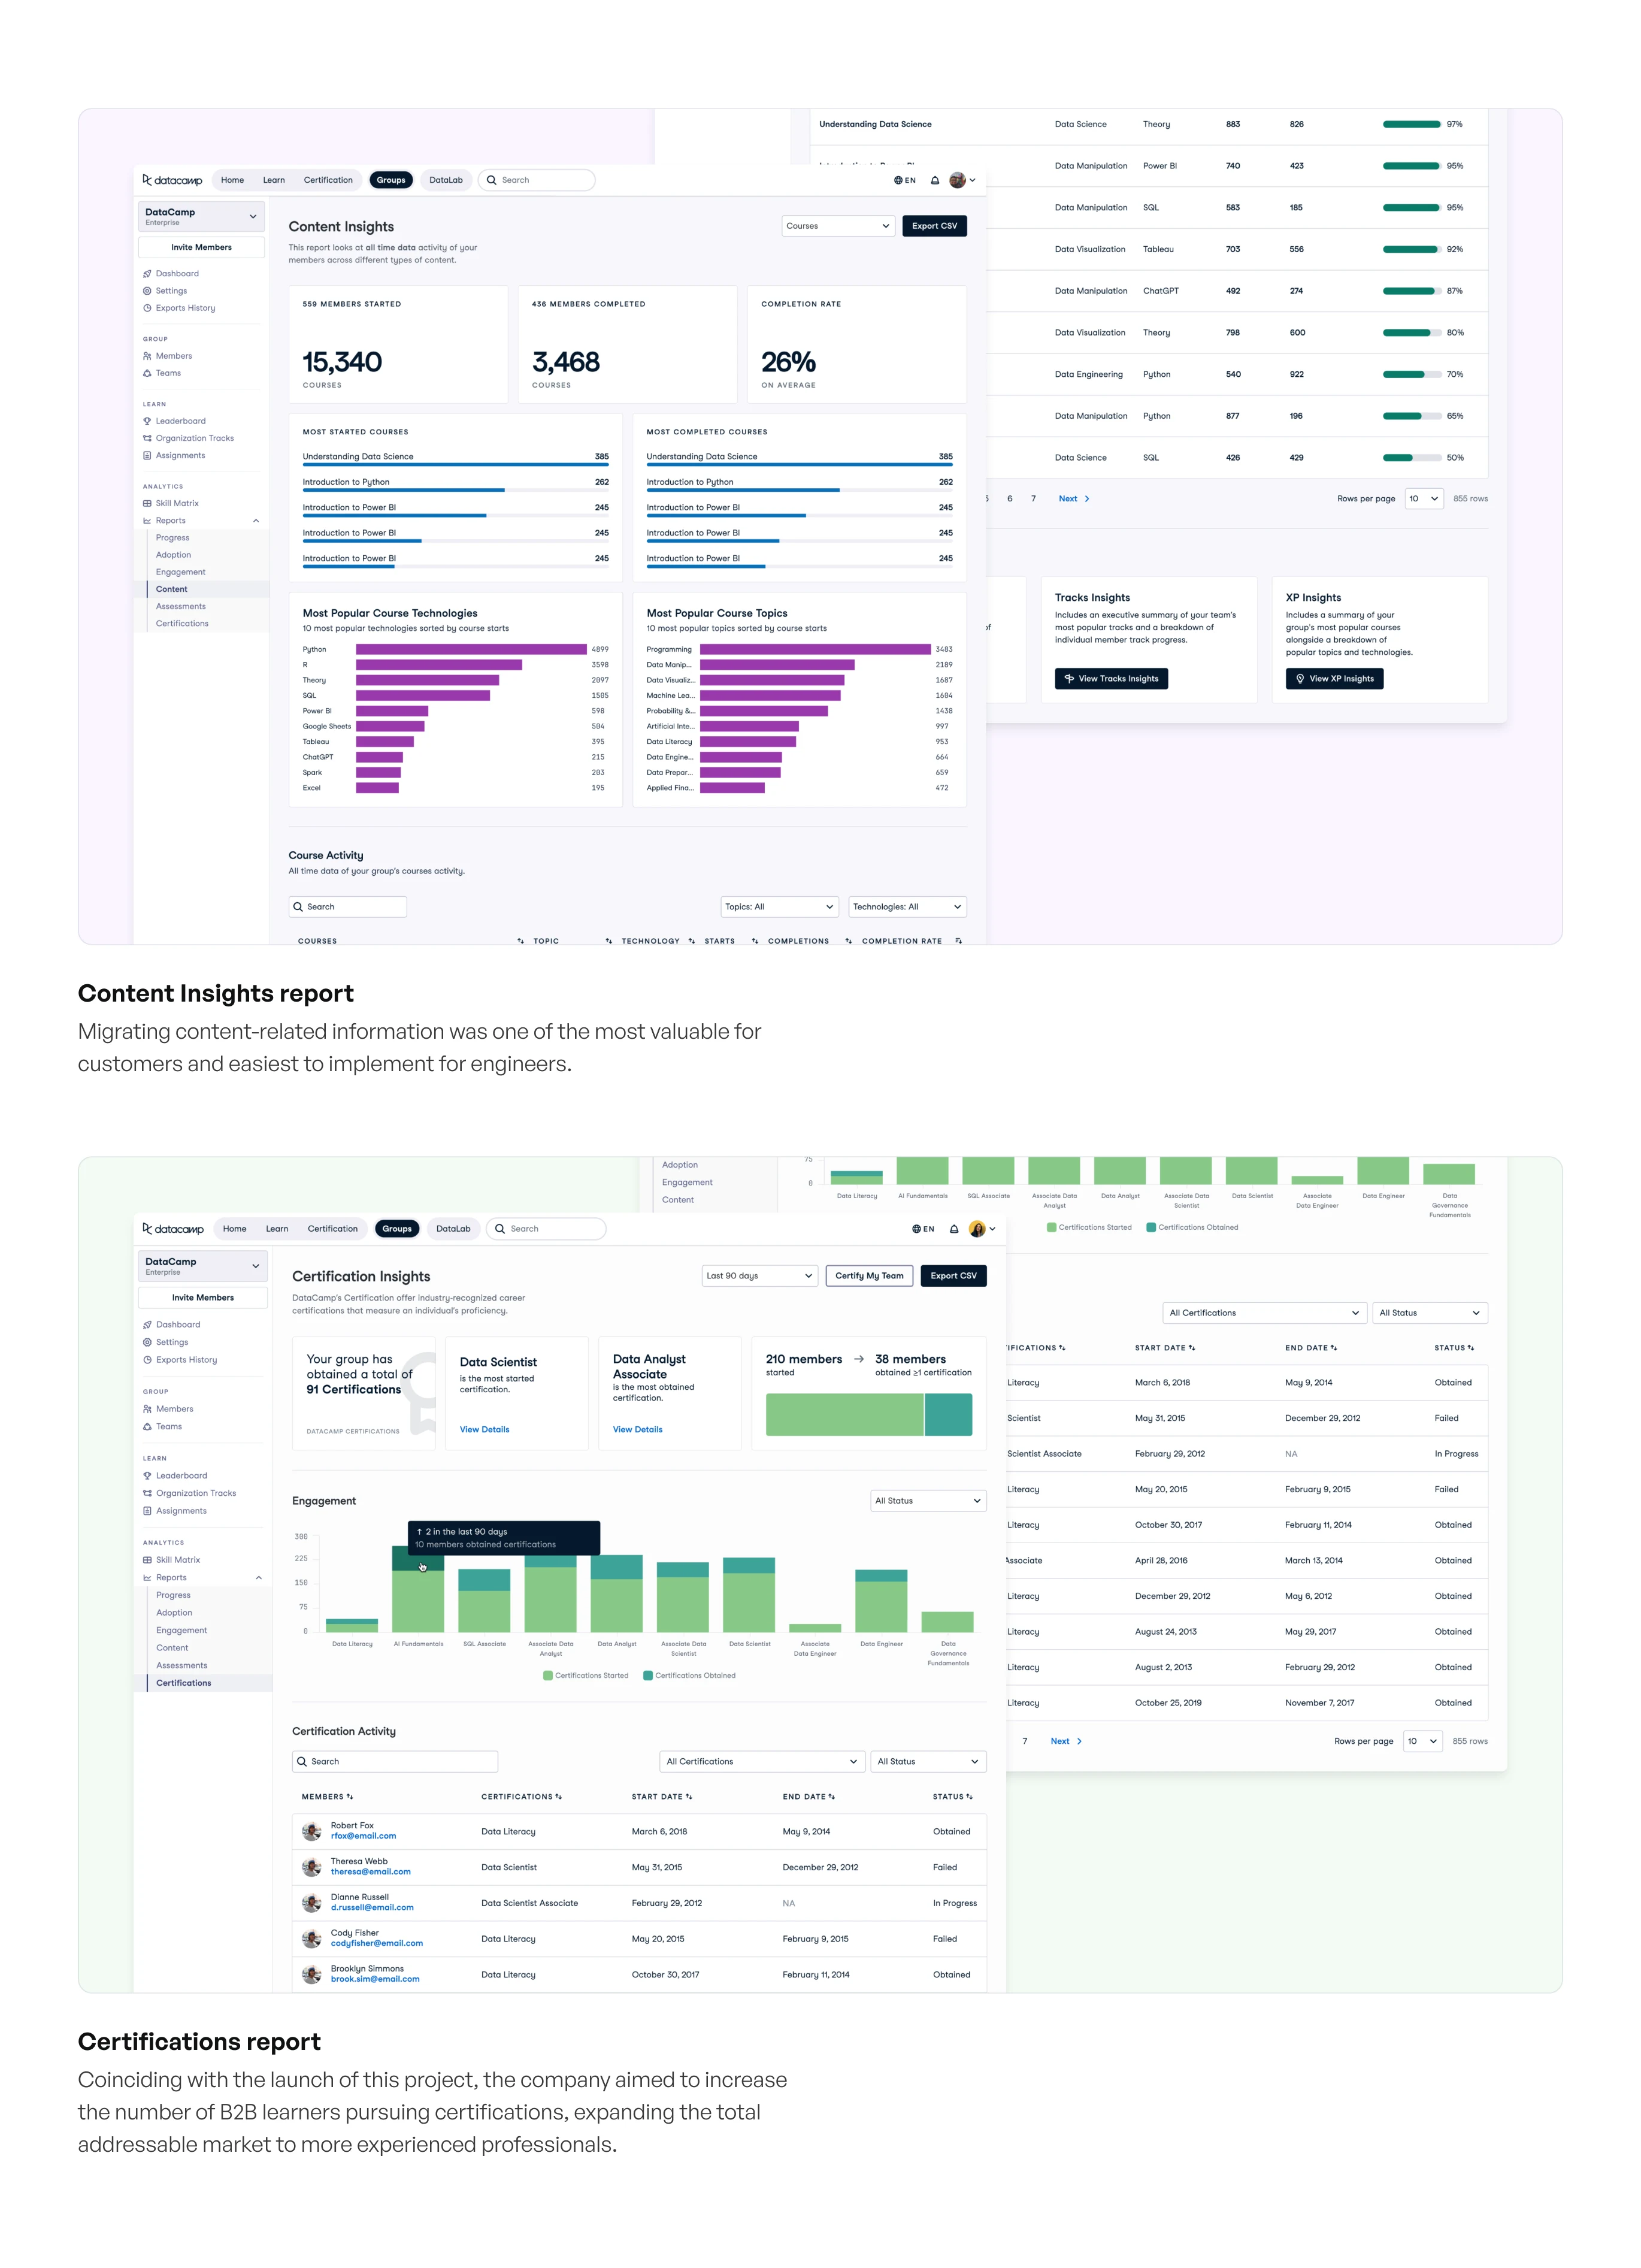
Full screen reports
1 like · 8 views · Mar 21, 2026
Redesigned in-app reports for B2B product, turning underutilized data into actionable insights. Led user research, design, and cross-team collaboration.

