County Health Explorer: Full-Stack Spatial Data Science App
Richard Donohue
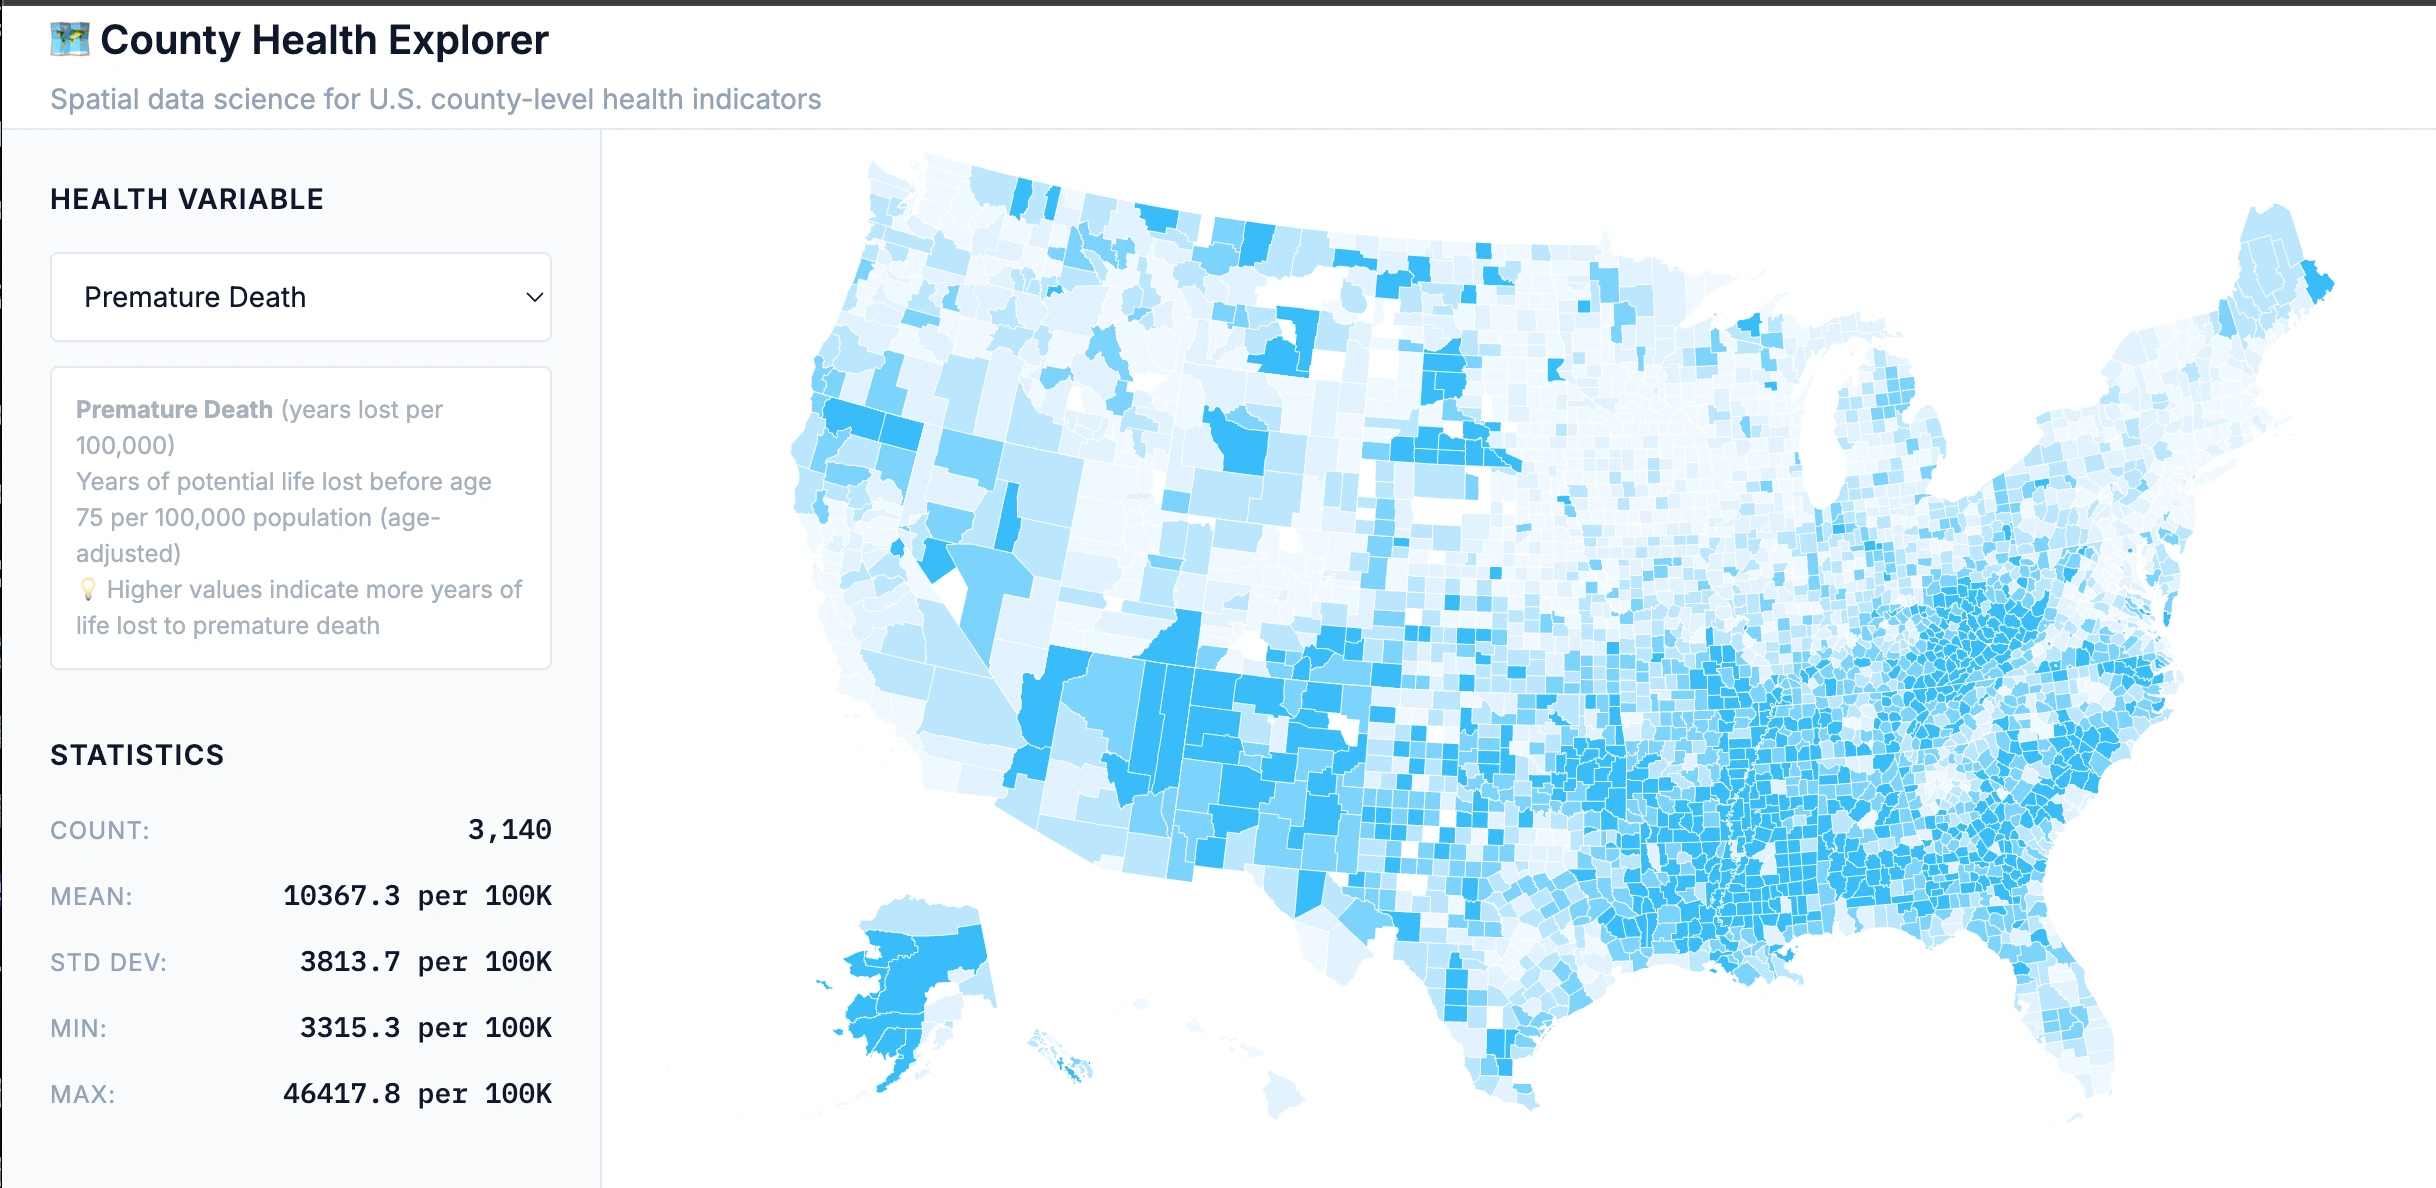
🗂️ County Health Explorer
A minimalist, reproducible, full-stack spatial data science application to explore U.S. county-level health data. This project showcases backend-to-frontend integration using DuckDB, FastAPI, and vanilla JavaScript with Observable Plot for cartographically accurate mapping and statistical charting.
⚠️ Status: Backend and frontend servers are fully functional, but other features are still in development
🧱 Tech Stack
Backend
Language: Python 3.10+
Framework: FastAPI
Database: DuckDB (with spatial extension)
Spatial Libraries: GeoPandas, PySAL
Frontend
Language: Vanilla JavaScript (ES6)
Mapping & Charts: Observable Plot (UMD) with D3 projections
Projections: Albers Equal Area for accurate spatial representation
UI: Plain HTML/CSS (no frameworks)
📁 Project Structure
🎯 Features
Cartographically Accurate Maps: County-level choropleth maps with Albers Equal Area projection via Observable Plot
Dynamic Variable Selection: Switch between health indicators via dropdown
Statistical Analysis: Summary statistics, spatial autocorrelation (Moran's I), correlations
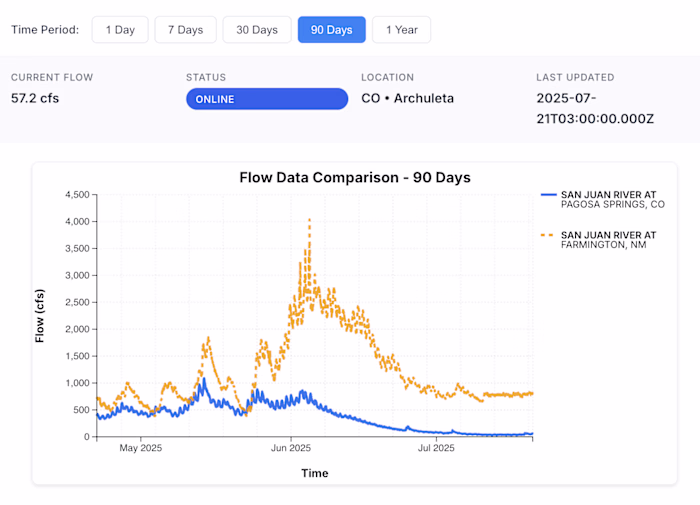
Real-time Charts: Histograms and scatter plots with Observable Plot
Spatial Analysis: County neighbors and local spatial statistics
Responsive Design: Mobile-friendly interface with progressive enhancement
Performance: Optimized spatial queries and SVG rendering
🚀 Quick Start
Prerequisites
Python 3.10+
pip
Installation
Clone or navigate to the project directory
Install dependencies:
Set up virtual environment:
Run ETL pipeline (first time only):
Development (Recommended)
Start both servers individually:
Terminal 1 - Backend server:
Terminal 2 - Frontend server:
Alternative: Use the development script (may require debugging):
Production
Start the main application server:
Access Points
🌐 Frontend Application: http://localhost:3000
📚 API Documentation: http://localhost:8000/docs
🔍 Health Check: http://localhost:8000/health
📊 Example API Call: http://localhost:8000/api/stats?var=premature_death
🔗 API Endpoints
Core Endpoints
GET /api/vars - List available health variables and metadataGET /api/variables/categories - Variables grouped by health domainGET /api/choropleth?var=<variable> - GeoJSON with joined data and class breaksGET /api/stats?var=<variable> - Summary statistics (count, mean, std, min, max)GET /api/moran?var=<variable> - Moran's I spatial autocorrelationGET /api/corr?vars=var1,var2 - Correlation between variablesCounty-Specific
GET /api/counties/{fips} - Individual county detailsGET /api/neighbors/{fips} - Spatial neighbors for local analysisExample API Responses
🏗️ Development
Architecture
The application uses a simple but powerful architecture:
DuckDB with spatial extension for fast analytical queries
FastAPI for RESTful API with automatic OpenAPI documentation
Jinja2 for server-side HTML templating
Vanilla JavaScript with ES6 modules for frontend interactions
Observable Plot for cartographically accurate mapping with proper projections
Observable Plot for statistical visualizations (histograms, scatter plots)
State Management
Frontend uses a central
AppState object:ETL Pipeline
Loads
county_health.csv into DuckDBNormalizes column names
Joins county GeoJSON via
fips_codeCreates spatial WKB views
Validates output (3142 counties, data integrity)
📊 Data Sources
This application utilizes data from the following authoritative sources:
Health Data
County Health Rankings & Roadmaps: https://www.countyhealthrankings.org/
Provides comprehensive county-level health indicators including health outcomes, health factors, and social determinants
2025 Annual Data Release with measures for all U.S. counties
Data includes premature death rates, preventable hospital stays, health behaviors, clinical care access, and social & economic factors
Geographic Data
U.S. Census Bureau Cartographic Boundary Files: https://www.census.gov/geographies/mapping-files/time-series/geo/carto-boundary-file.html
County boundary shapefiles optimized for thematic mapping
1:500,000 scale resolution for detailed visualization
Simplified representations from the Census Bureau's MAF/TIGER geographic database
🎨 Design Principles
Minimalist: No external JS frameworks or build tools
Reproducible: Fixed seeds and idempotent ETL
Progressive: Graceful degradation without JavaScript
Cartographically Accurate: Albers Equal Area projection for proper spatial representation
Performant: Optimized spatial queries and efficient SVG rendering
Accessible: Mobile-friendly with accessible color palettes
🧪 Testing
Run the test suite:
📈 Performance Metrics
Time-to-First-Map: <2s
API Latency: <150ms
DuckDB File Size: <50MB
Codebase: <2,000 LOC
🤝 Contributing
This project is designed for agentic development and reproducible science. Contributions should maintain:
Zero external JS frameworks
Minimal dependencies
Full test coverage for core logic
API documentation via OpenAPI
📄 License
MIT License
"Simplicity is an antidote to confusion; when the mind is clear, action is precise."
Built for public-serving clarity and repeatable science.
Like this project
Posted Jul 21, 2025
Developed a full-stack app for exploring U.S. county health data using DuckDB, FastAPI, and JavaScript.
Likes
0
Views
9