
🌊 Water Watcher — Interactive Freshwater Health Explorer
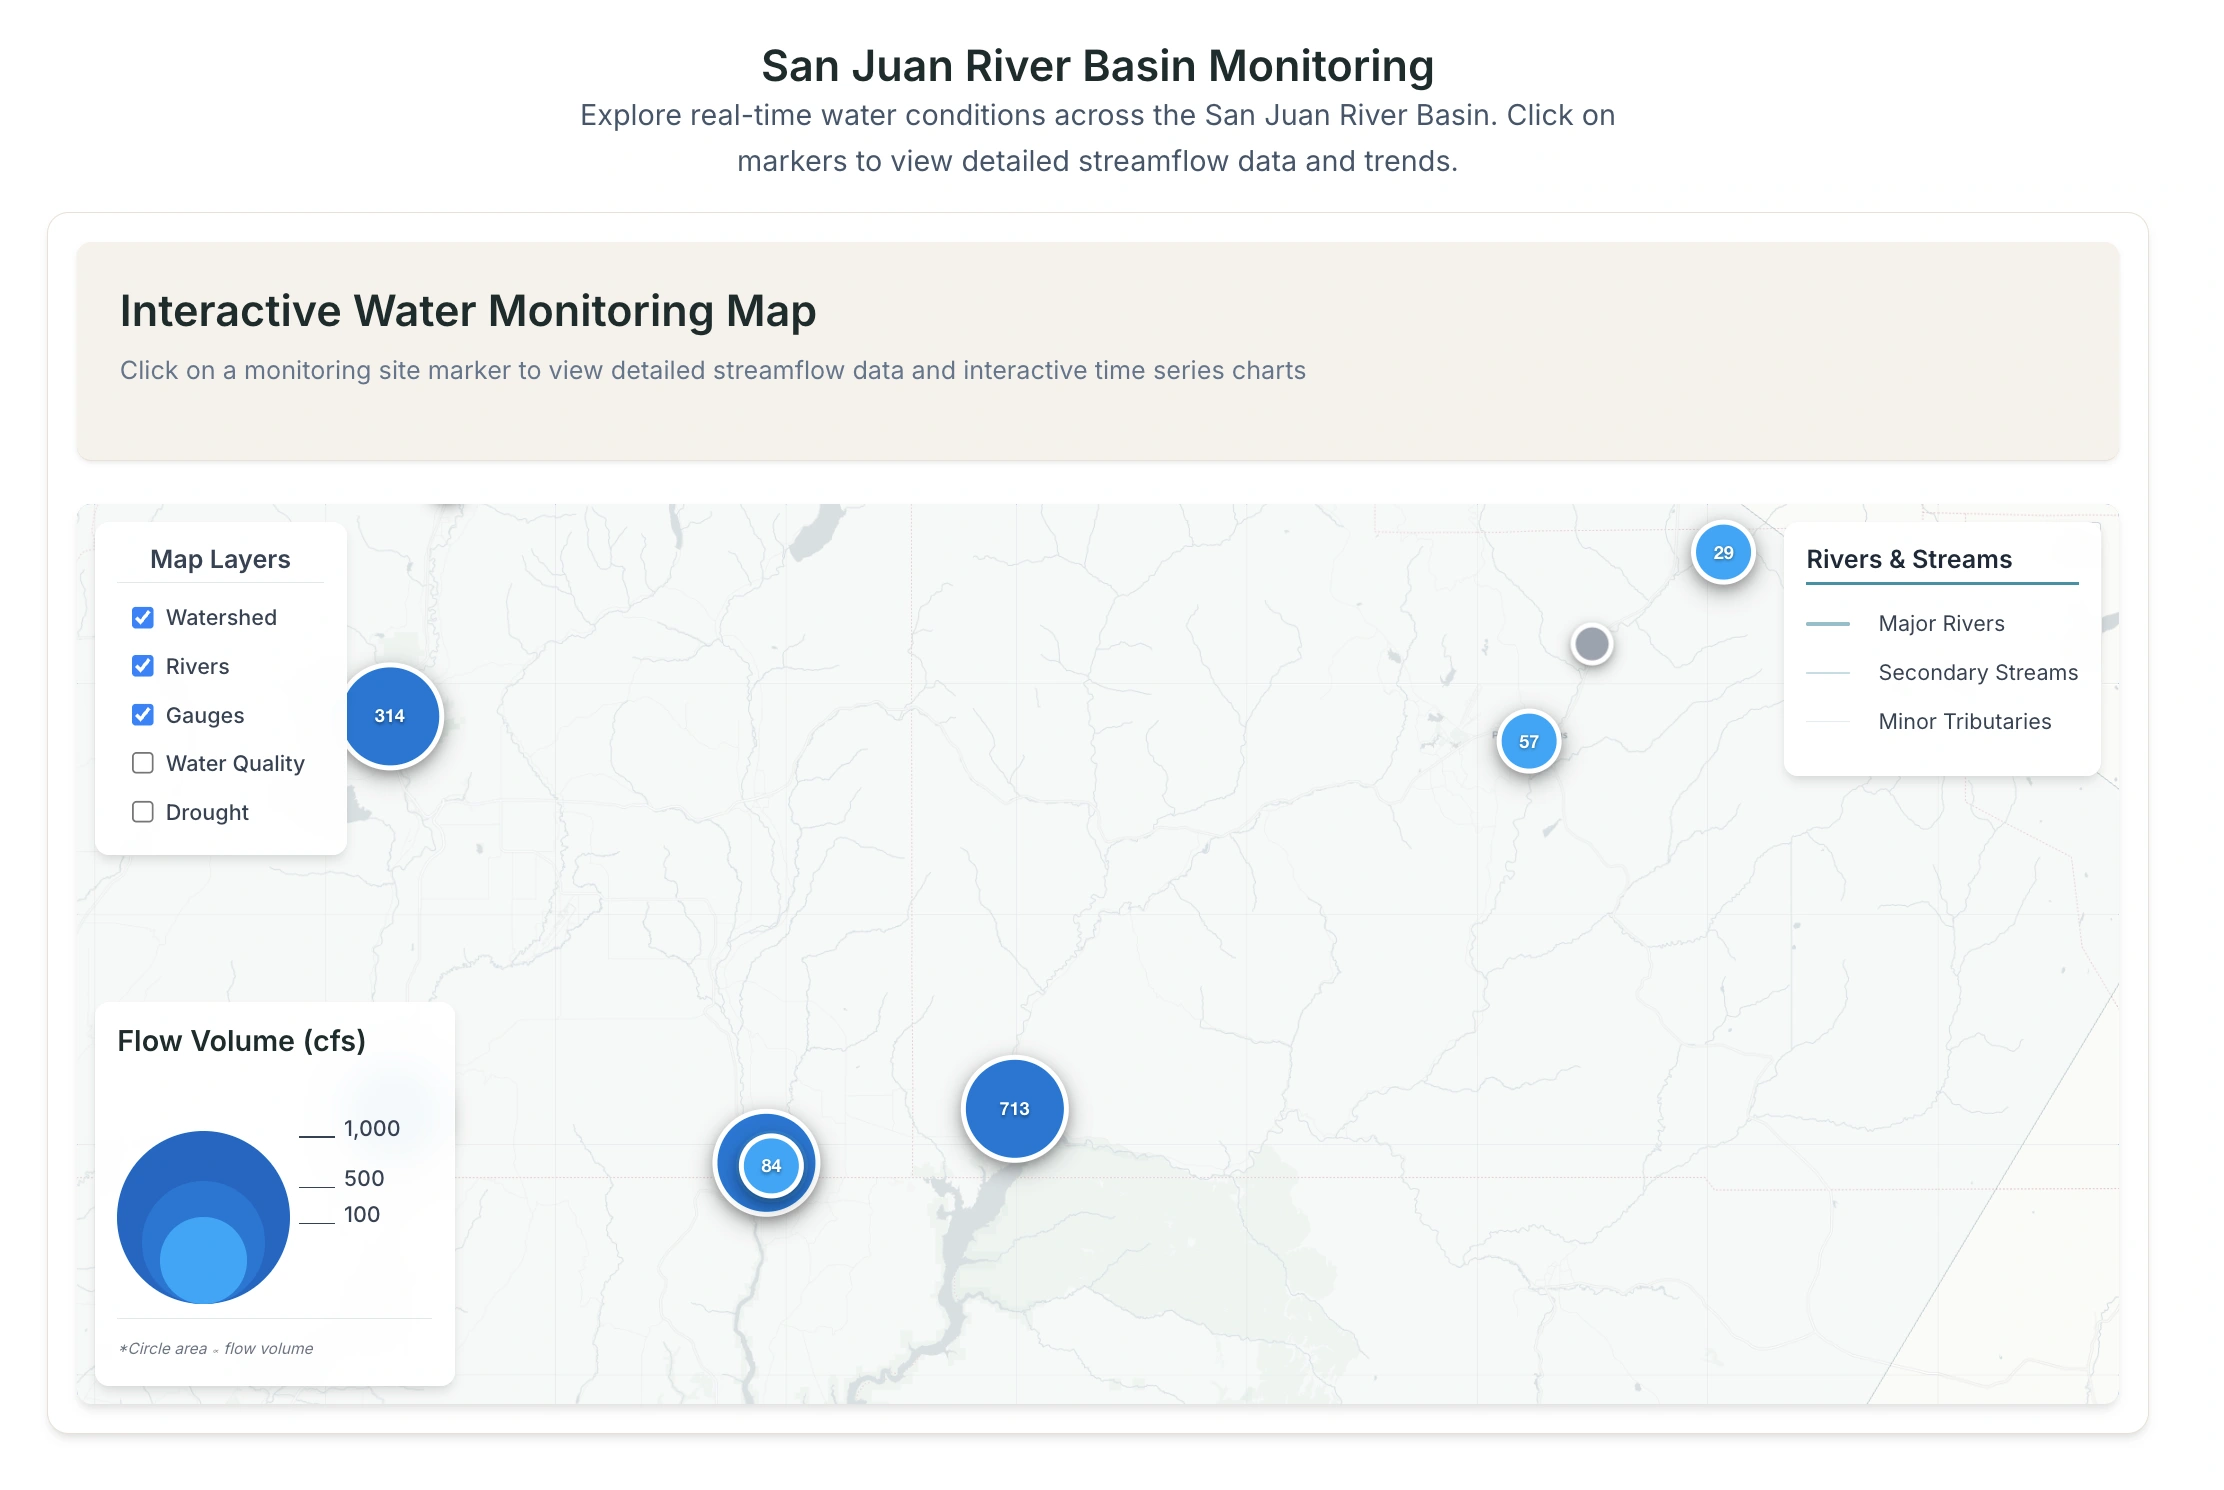
A lightweight, web-based map application that visualizes freshwater health indicators across the Colorado Plateau (CO, NM, AZ, UT). This tool democratizes access to water health data by providing an intuitive interface for exploring water quality metrics, streamflow data, and drought conditions.
Features
Interactive map showing watersheds, stream gauges, and water quality metrics
Real-time data visualization including:
Water quality metrics (pH, dissolved oxygen, nitrates)
USGS streamflow data
NOAA drought severity overlays
Interactive popups with:
Current water quality ratings
Latest streamflow data
7-day historical trends
Layer toggles for different data types
Mobile-responsive design
Accessibility features (color contrast, keyboard navigation)
Tech Stack
Frontend: React + Vite
Mapping: Leaflet.js
Charts: Chart.js
Testing: Jest, React Testing Library
Linting: ESLint
Getting Started
Clone the repository
Install dependencies:
Start the development server:
Development
npm run dev - Start development servernpm run build - Build for productionnpm run lint - Run ESLintnpm run test - Run testsData Sources
USGS National Water Dashboard API
EPA Water Quality Portal
NOAA Drought Monitor
USGS HUC boundaries
Contributing
This project follows test-driven development practices. Please ensure all new features include appropriate tests before submitting pull requests.
License
MIT License
0 likes · 8 views · Jul 21, 2025
A lightweight, web-based map application that visualizes freshwater quality metrics, streamflow data, and drought conditions across the Colorado Plateau.


