Interactive Sales Dashboard Development

Onanibosi Babajide

Sheet Descriptions
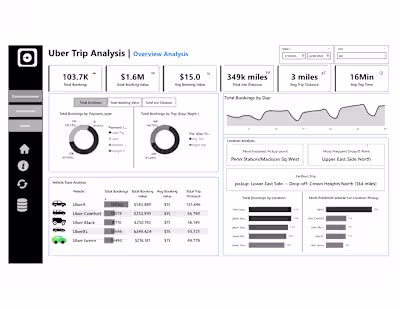
1. Total Sales
Aggregates key metrics such as total revenue, total orders, and number of unique customers.
Useful for a quick snapshot of business performance.
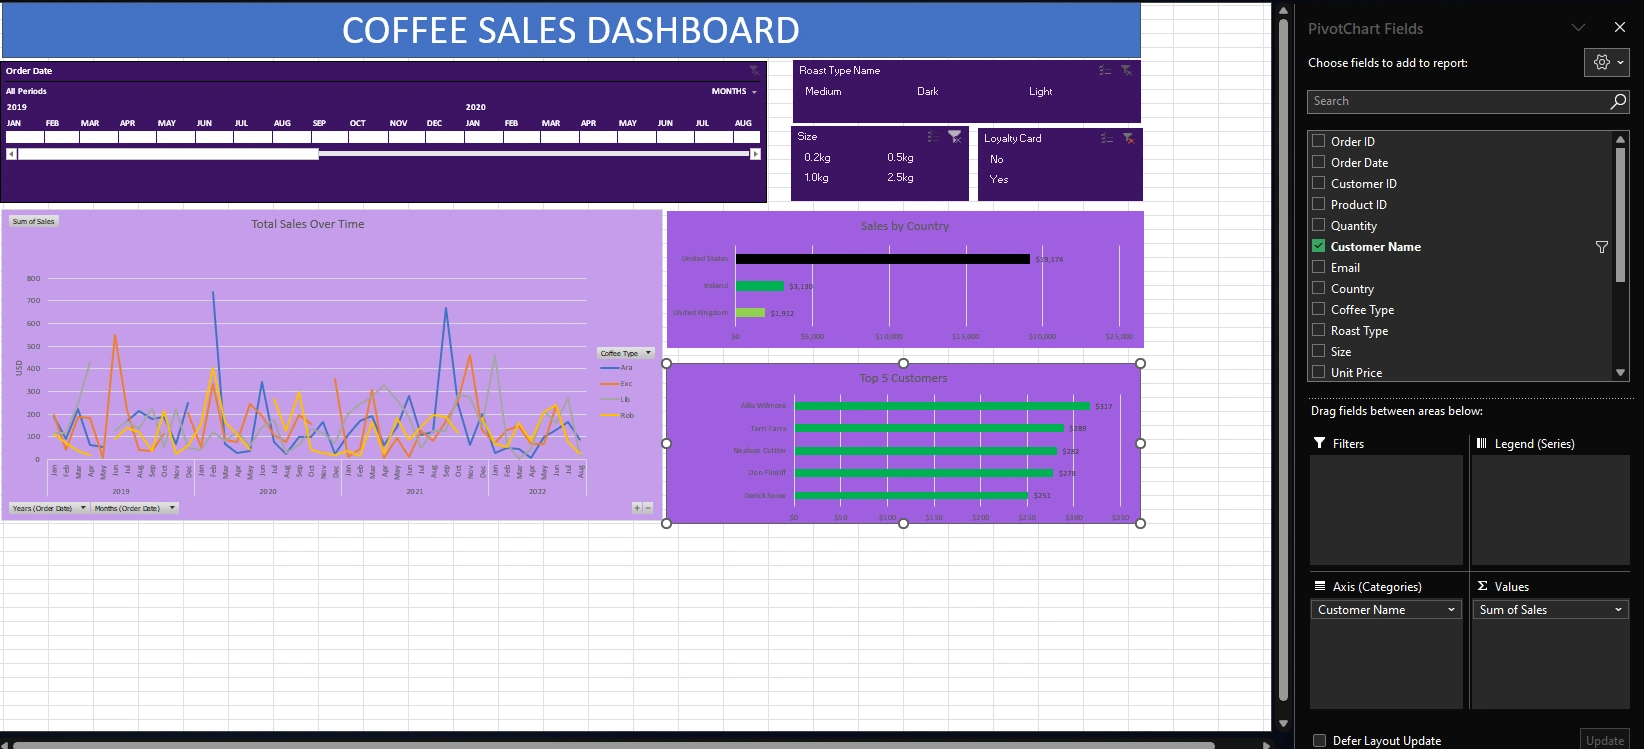
2. Sales Visualization
Time series analysis showing sales over months or quarters.
Includes line and bar charts for trend analysis.
3. Top 5 Customers
A Pareto-style visualization focusing on high-value customers.
Helps identify where most of your revenue comes from.
4. Dashboard
Fully interactive Excel dashboard.
Contains slicers for filtering by country, product category, and time.
Combines KPIs, charts, and tables in a single view for stakeholders.
5. Country Bar Chart
Visual comparison of sales by country.
Helps identify geographical strongholds and underperforming regions.
6. Orders
Raw transaction-level data, including order date, amount, and customer ID.
Feeds into pivot tables and charts.
7. Customers
Customer information including names, regions, and loyalty segments.
Enables customer segmentation analysis.
8. Products
Product catalog with names, categories, and unit prices.
Used to assess product performance and trends.
Key Features
Pivot Tables for dynamic aggregation
Multiple chart types (bar, line, pie)
Slicers for interactivity
KPI panels
Clean layout and user-friendly navigation
Tools Used
Microsoft Excel 2021
Native Excel features only — No external plugins or macros
Business Applications
This type of dashboard can help:
Small and medium businesses track sales efficiently
Analysts create performance reports without coding
Managers get real-time insights for decision-making
Entrepreneurs visualize trends and opportunities
Getting Started
Clone or download this repository.
Open
data/sales_data.xlsx in Microsoft Excel.Use slicers on the Dashboard sheet to filter by time, country, or category.
Explore different sheets for granular insights.
Preview
*
*
Customization Guide
You can extend this project by:
Adding more regions or product lines to the dataset
Creating additional dashboards focused on marketing, inventory, or logistics
Connecting Excel to a live data source (e.g., SQL Server or Power BI)
Contributions
Pull requests are welcome. If you have improvements or want to localize the dashboard for your own dataset, feel free to fork and build upon it.
Like this project
Posted Jul 3, 2025
Developed an Excel dashboard for sales and customer analysis.
Likes
0
Views
1