Netflix Userbase Analysis - Power BI Dashboard

Onanibosi Babajide

Netflix Userbase Analysis - Power BI Dashboard
Project Overview
This project analyzes Netflix's userbase dataset containing 2,500 subscribers to extract actionable business insights and customer behavior patterns. Using Power BI and DAX measures, I created an interactive dashboard that visualizes subscription trends, revenue patterns, geographic distribution, and demographic insights.
Power BI Dashboard Components
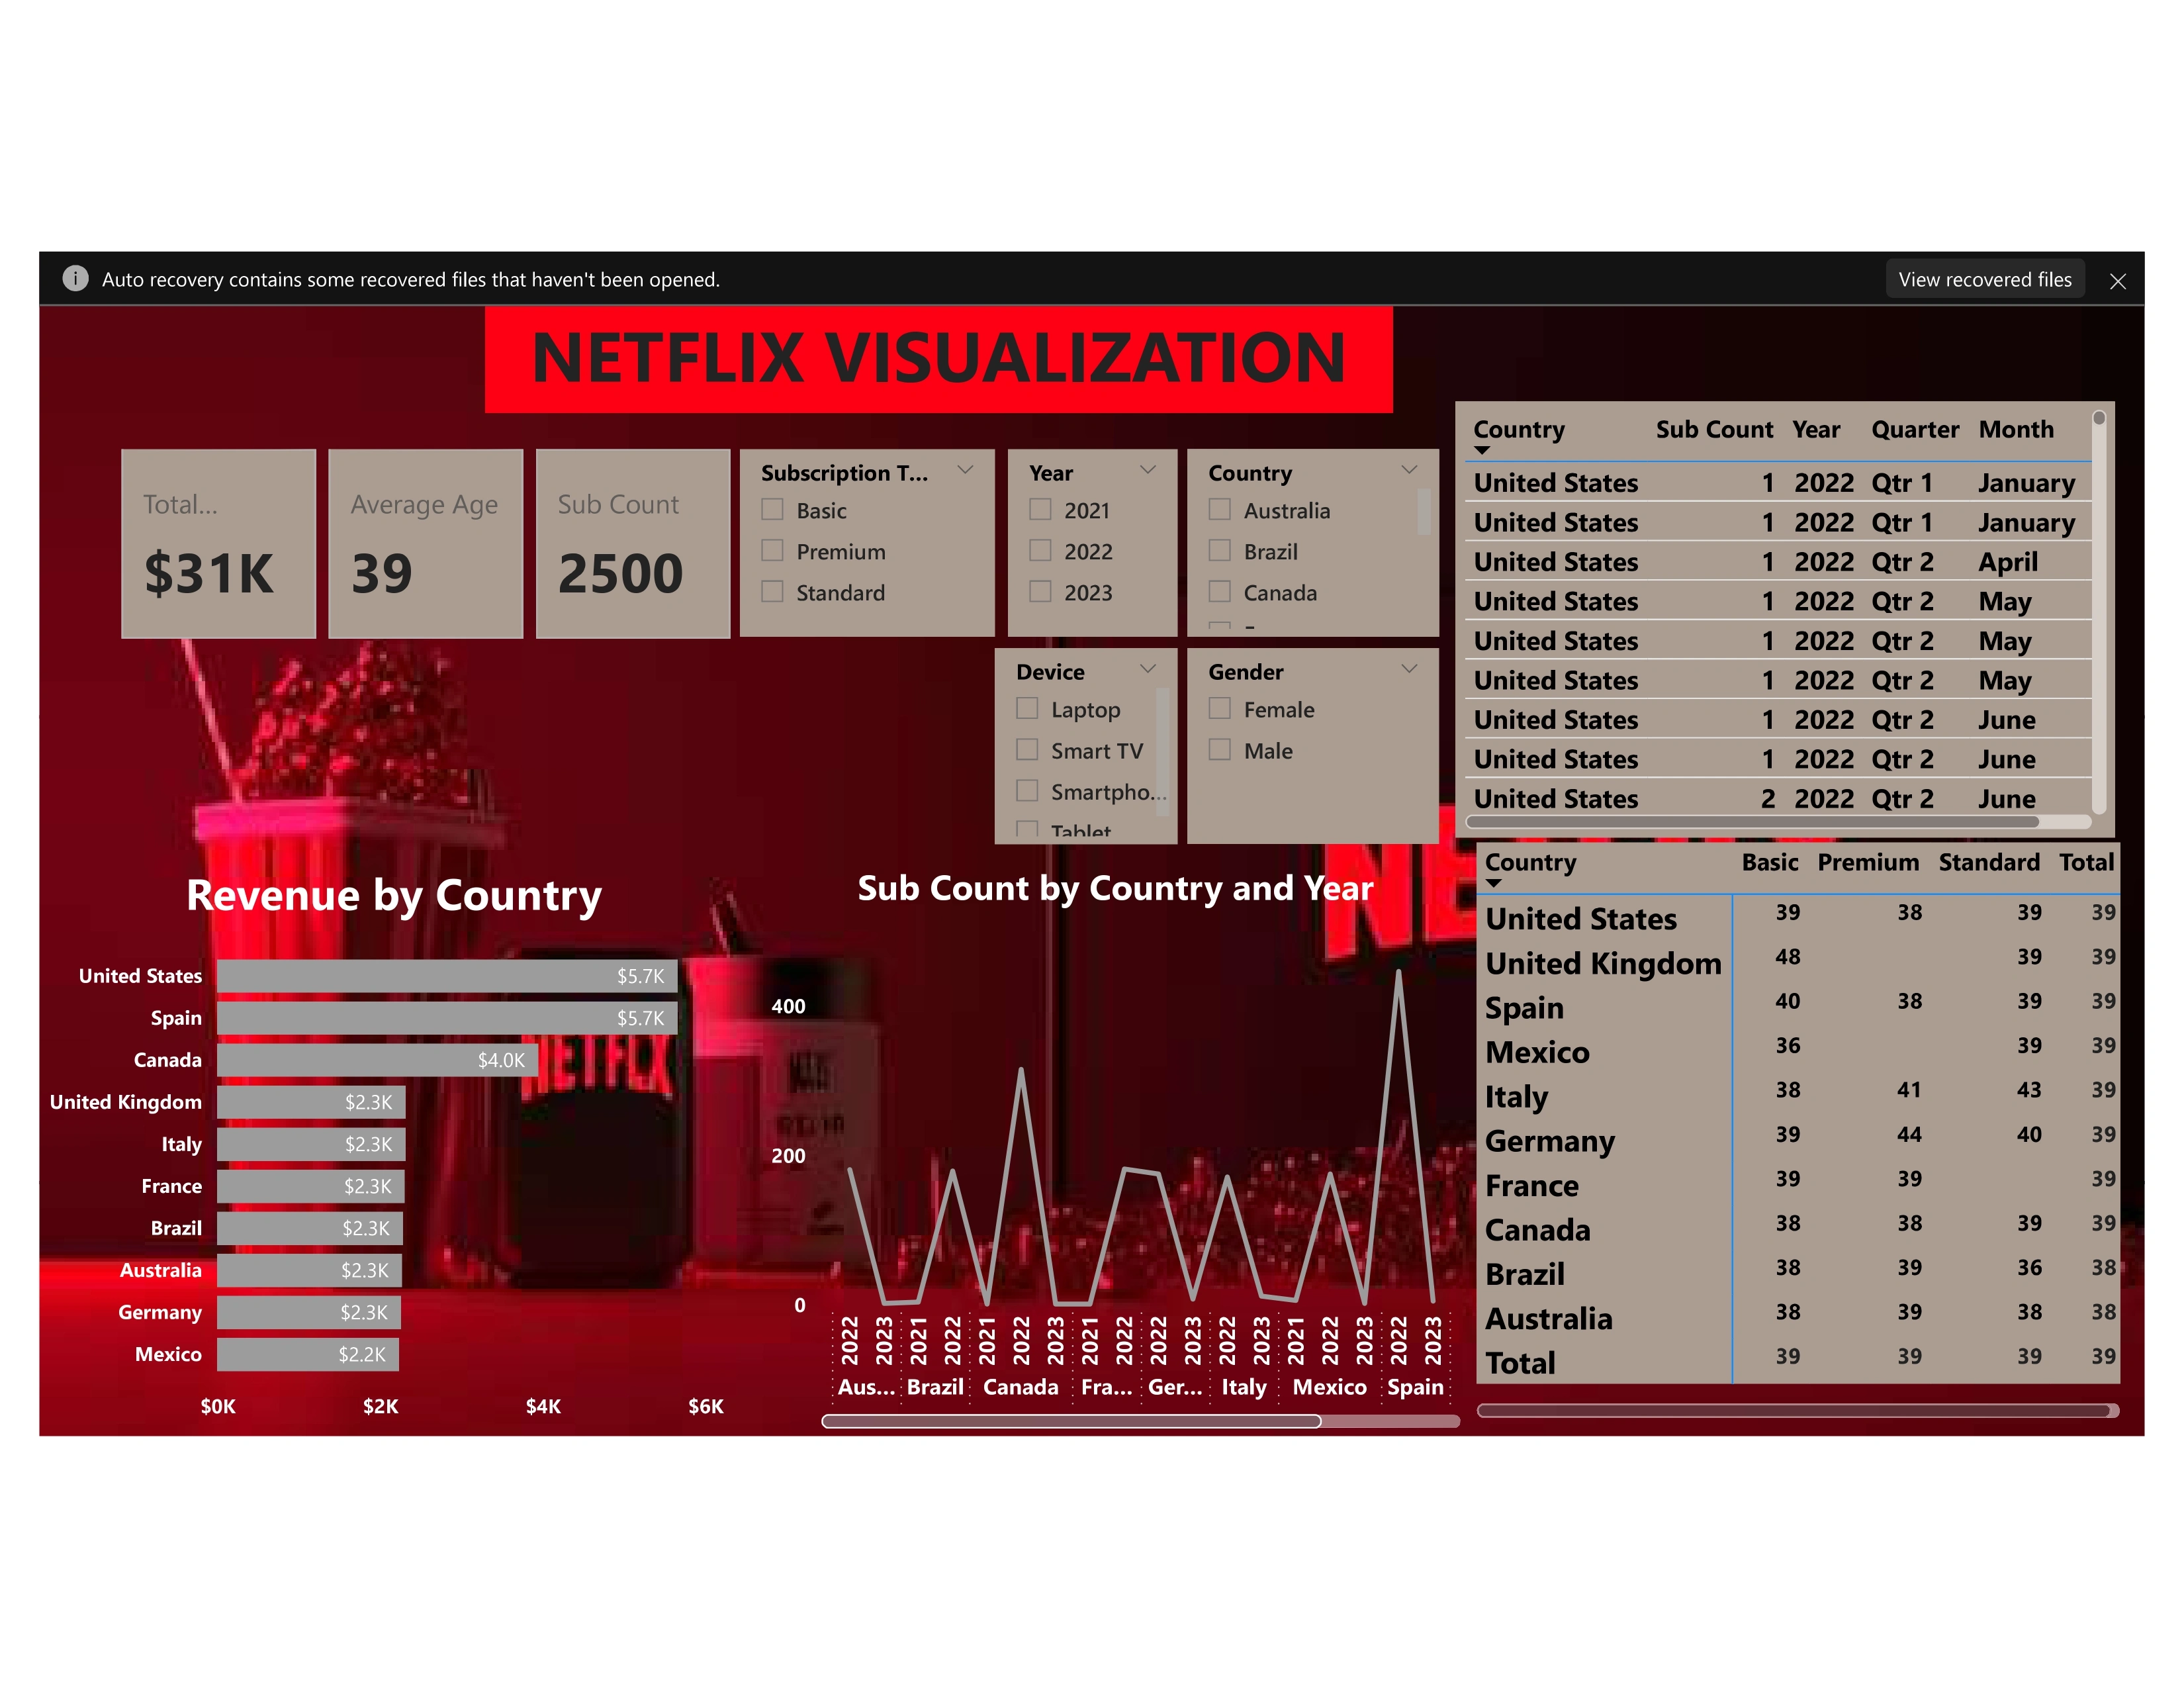
KPI Cards:
Total Monthly Revenue: $31K
Average Age: 39
Total Subscribers: 2500
Slicers for Interactive Filtering:
Subscription Type (Basic, Premium, Standard)
Year (2021, 2022, 2023)
Country selection
Device type (Laptop, Smart TV, Smartphone, Tablet)
Gender (Female, Male)
Bar Chart: "Revenue by Country" showing:
United States: $5.7K
Spain: $5.7K
Canada: $4.0K
United Kingdom: $2.3K
Other markets: ~$2.2K each
Line Chart: "Sub Count by Country and Year" displaying subscriber trend patterns across 2021-2023, revealing peak subscription periods and identifying market growth opportunities.
Tables:
Country/Quarter/Month breakdown showing subscriber counts
Country/Subscription Type matrix displaying distribution of subscription plans across markets
Key Business Insights
Revenue Analysis
Total monthly revenue of $31,271 with an Average Revenue Per User (ARPU) of $12.51
Despite having fewer subscribers (29.3%), Premium plans generate almost the same revenue share (29.5%) as the more numerous Basic subscribers (40% of users, 39.9% of revenue)
Geographic analysis reveals United States and Spain as equal revenue leaders ($5.7K each)
Subscription Distribution
Basic plans are most popular (40.0%, 999 users)
Standard plans account for 30.7% (768 users)
Premium plans represent 29.3% (733 users)
Subscription preferences vary by country, with Premium plans showing stronger adoption in certain markets
User Demographics
Average user age is 39 years
35-44 age group represents the largest segment (40.6%)
Gender distribution is balanced (50.3% Female, 49.7% Male)
Device usage is remarkably even across Laptop (25.4%), Tablet (25.3%), Smartphone (24.8%), and Smart TV (24.4%)
Temporal Trends
The line chart reveals subscription growth patterns across 2021-2023
Peak user acquisition occurred in 2022
United States shows consistent quarterly growth in Q1-Q2 2022
Subscription patterns vary by country, with some markets showing steadier growth than others
DAX Measures Implemented
Tools & Technologies Used
Data Visualization: Power BI Desktop and Service
Data Analysis: DAX (Data Analysis Expressions)
Visualization Components: Slicers, Bar Charts, Line Charts, Tables, Matrix visualizations, Cards
Data Processing: Power Query Editor
Data Transformation: M language
Custom Measures: Advanced DAX formulas
Color Theming: Custom Netflix-themed color palette
Interactive Filtering: Cross-filtering and drill-through capabilities
Business Recommendations
Subscription Strategy: Focus marketing efforts on converting Basic subscribers to Premium plans, especially in markets showing higher Premium adoption rates.
Geographic Focus: Maintain strong presence in the United States and Spain while developing targeted strategies for high-ARPU markets like United Kingdom and Italy.
Age-Based Content: Prioritize content appealing to the 35-44 demographic while ensuring adequate representation for the 25-34 age group.
Device Strategy: Continue multi-platform optimization with equal focus across all device types.
Retention Planning: Implement targeted retention campaigns for subscribers approaching the 12-month mark to reduce churn.
Impact & Results
This Power BI dashboard provides Netflix stakeholders with an intuitive interface to explore subscriber patterns, enabling data-driven decision making across content acquisition, marketing strategy, and pricing optimization. The visualization helps identify growth opportunities worth potentially $3.1M+ annually through strategic price adjustments and targeted subscriber conversion.
Like this project
Posted Jul 3, 2025
Created a Power BI dashboard for Netflix to analyze userbase and extract business insights.