Creating Interactive Data Dashboards with Google Data/Looker
Jahanzeb Khan
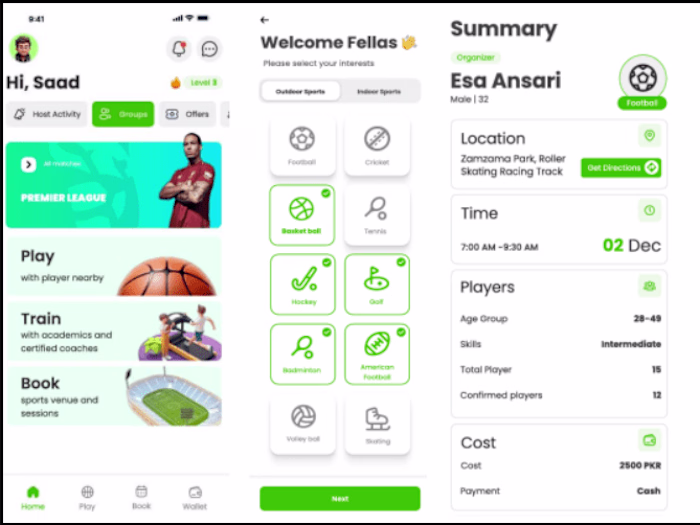
Data Source Integration (Google Data Studio):
We integrated multiple data sources, such as Google Sheets, SQL databases, and APIs, into Google Data Studio, enabling real-time data retrieval for reporting on key metrics like sales and project management.
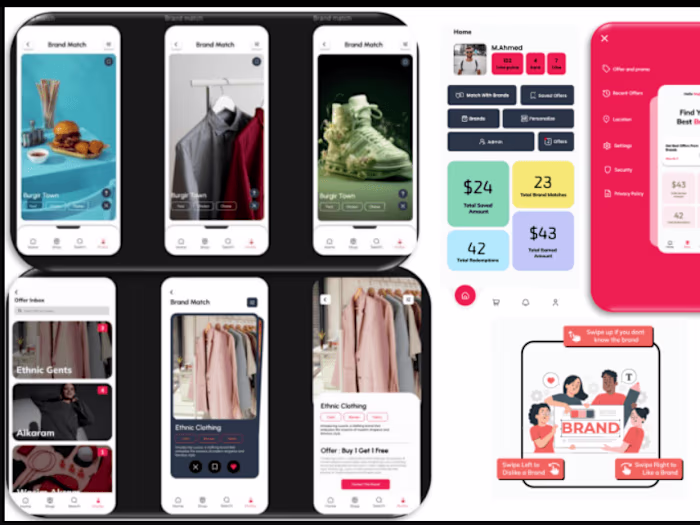
Data Modeling & Transformation (Looker Studio):
Utilizing Looker Studio's data modeling capabilities, we processed and transformed raw data into clean, structured datasets. This ensured consistency across multiple sources, resulting in more accurate and insightful reports.
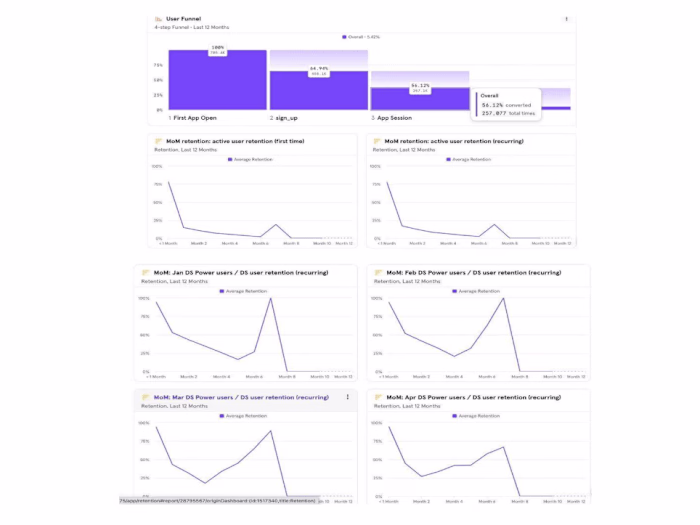
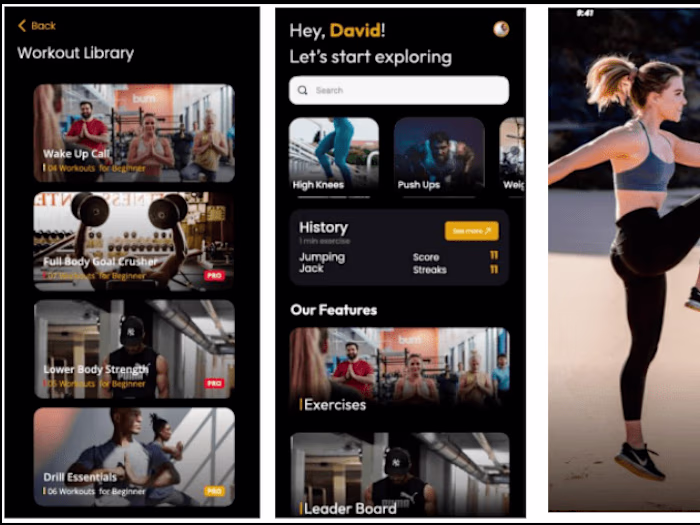
Visualization & Reporting (Google Data Studio):
With Google Data Studio's visualization tools, we created interactive charts, graphs, and tables that allowed stakeholders to track KPIs, analyze trends, and make data-driven decisions in real time.
Like this project
Posted Sep 26, 2024
Google Data/Looker Studio integrates multiple data sources, provides real-time data modeling and transformation, and enables interactive visualizations.