Creating Interactive Data Dashboards with Mixpanel
Jahanzeb Khan
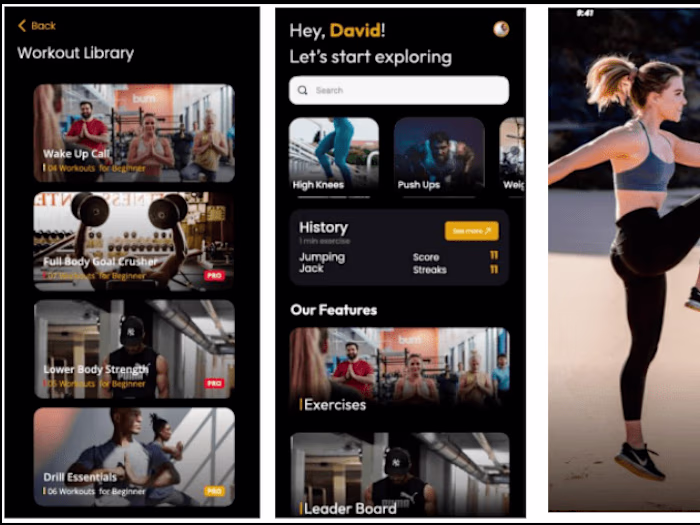
User Behavior Tracking (Mixpanel): We used Mixpanel to track user interactions across the mobile app, capturing events like logins, clicks, and session durations. This helped us gain insights into user behavior and feature usage patterns.
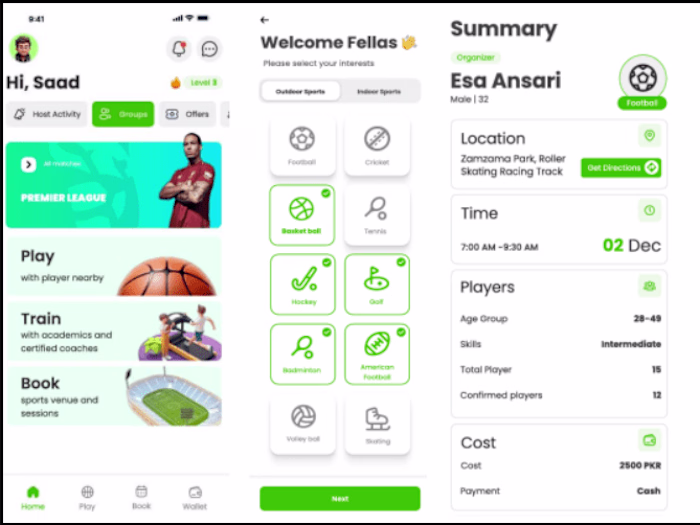
Segmentation & Funnels (Mixpanel): By leveraging Mixpanel’s segmentation and funnel features, we analyzed user behavior by demographics and usage. This allowed us to monitor user journeys and optimize conversion rates at each stage.
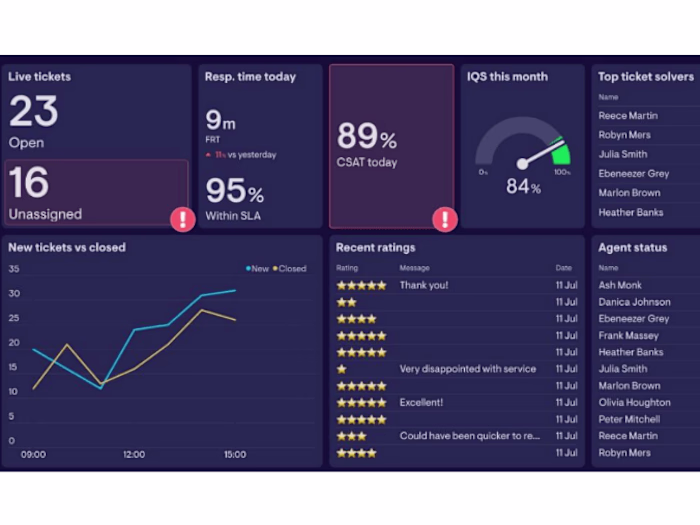
Automated Reporting (Mixpanel): Mixpanel's automated reporting was set up to provide real-time updates on key performance indicators (KPIs), helping our client continually refine their app’s user experience and engagement strategy.
Like this project
Posted Sep 26, 2024
Mixpanel tracked user interactions, analyzed behavior via segmentation and funnels, and provided real-time automated reports, helping optimize user journey.