Design of Serverless Database Monitoring Mobile App
Cansaas Agency
Overview
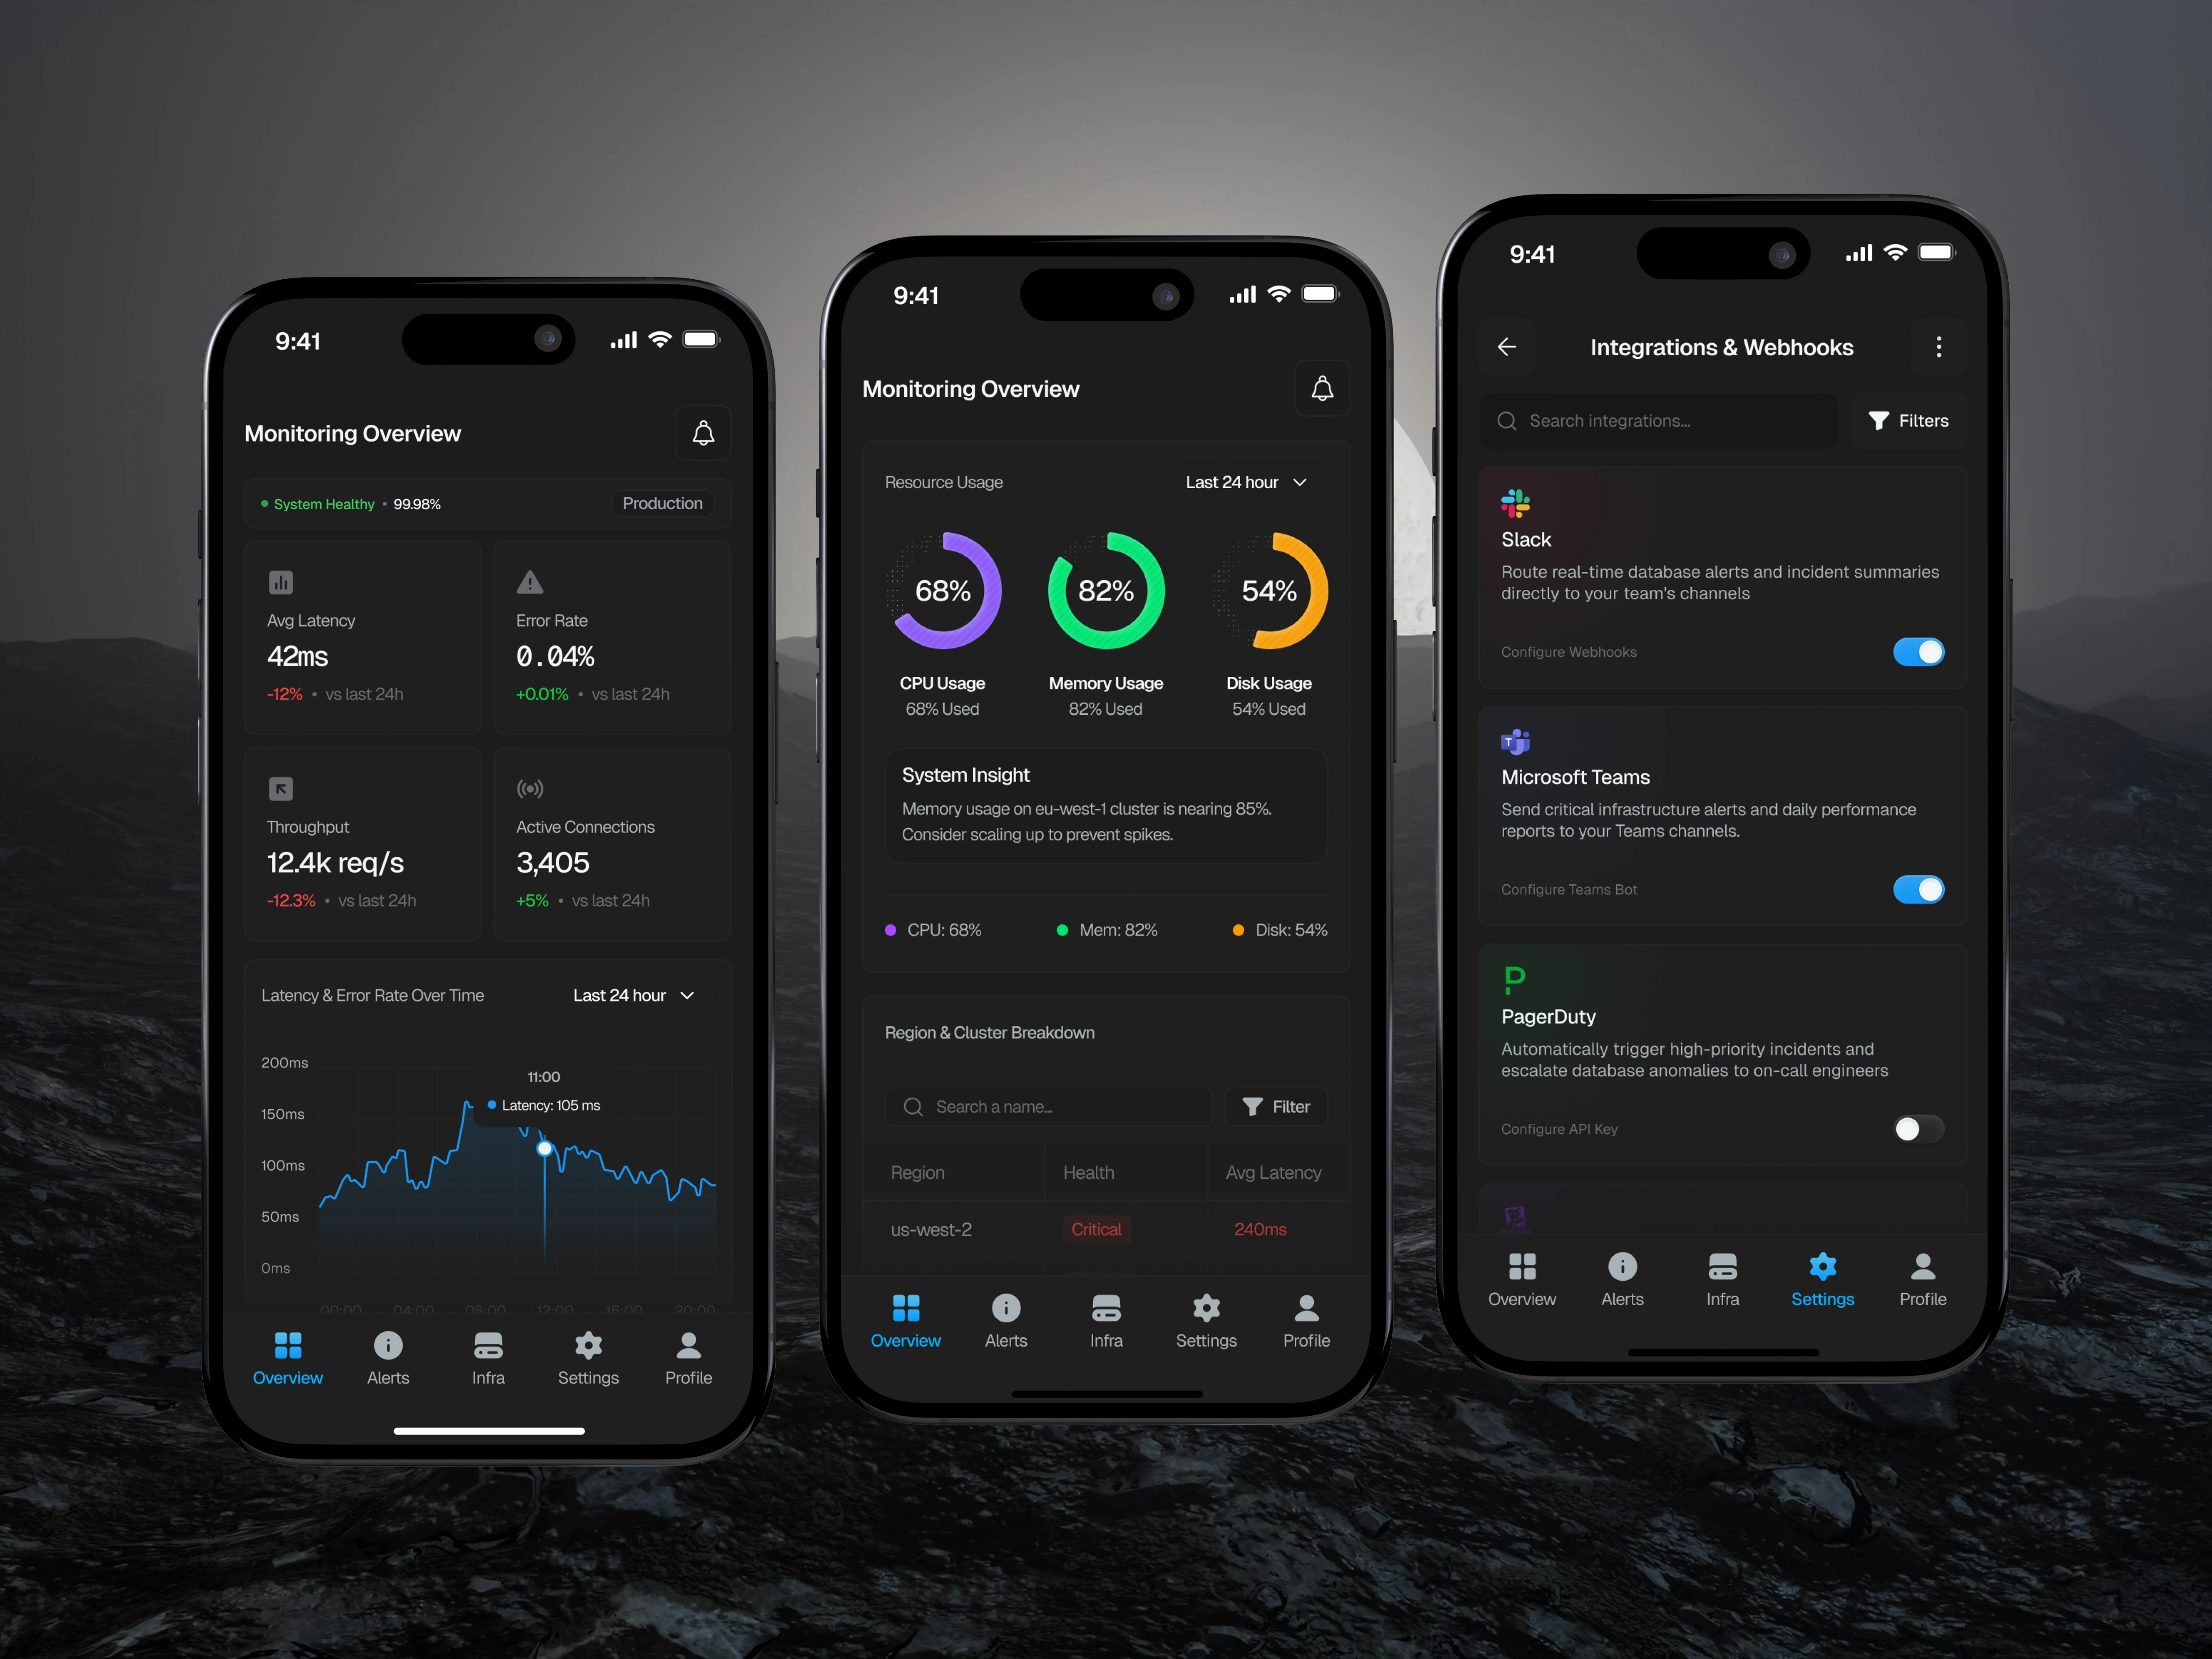
This project explores the design of a Serverless Database Monitoring Mobile App, built to help engineers monitor infrastructure performance, database health, and system metrics in real time. The dashboard consolidates critical operational data such as latency, error rate, throughput, CPU usage, memory usage, and active connections into a clean, mobile-first interface. The goal was to transform complex infrastructure monitoring into a clear, fast, and actionable experience for engineers on the go
The Challenge
This project explores the design of a Serverless Database Monitoring Mobile App, built to help engineers monitor infrastructure performance, database health, and system metrics in real time. The dashboard consolidates critical operational data such as latency, error rate, throughput, CPU usage, memory usage, and active connections into a clean, mobile-first interface. The goal was to transform complex infrastructure monitoring into a clear, fast, and actionable experience for engineers on the go.
The Solution
Monitoring serverless infrastructure can quickly become overwhelming due to the amount of operational metrics generated across clusters, regions, and services. Traditional monitoring tools often rely on dense dashboards that are difficult to navigate on mobile devices. The challenge in this project was to design a mobile monitoring interface that simplifies infrastructure visibility without sacrificing depth or clarity of data.
Design Approach
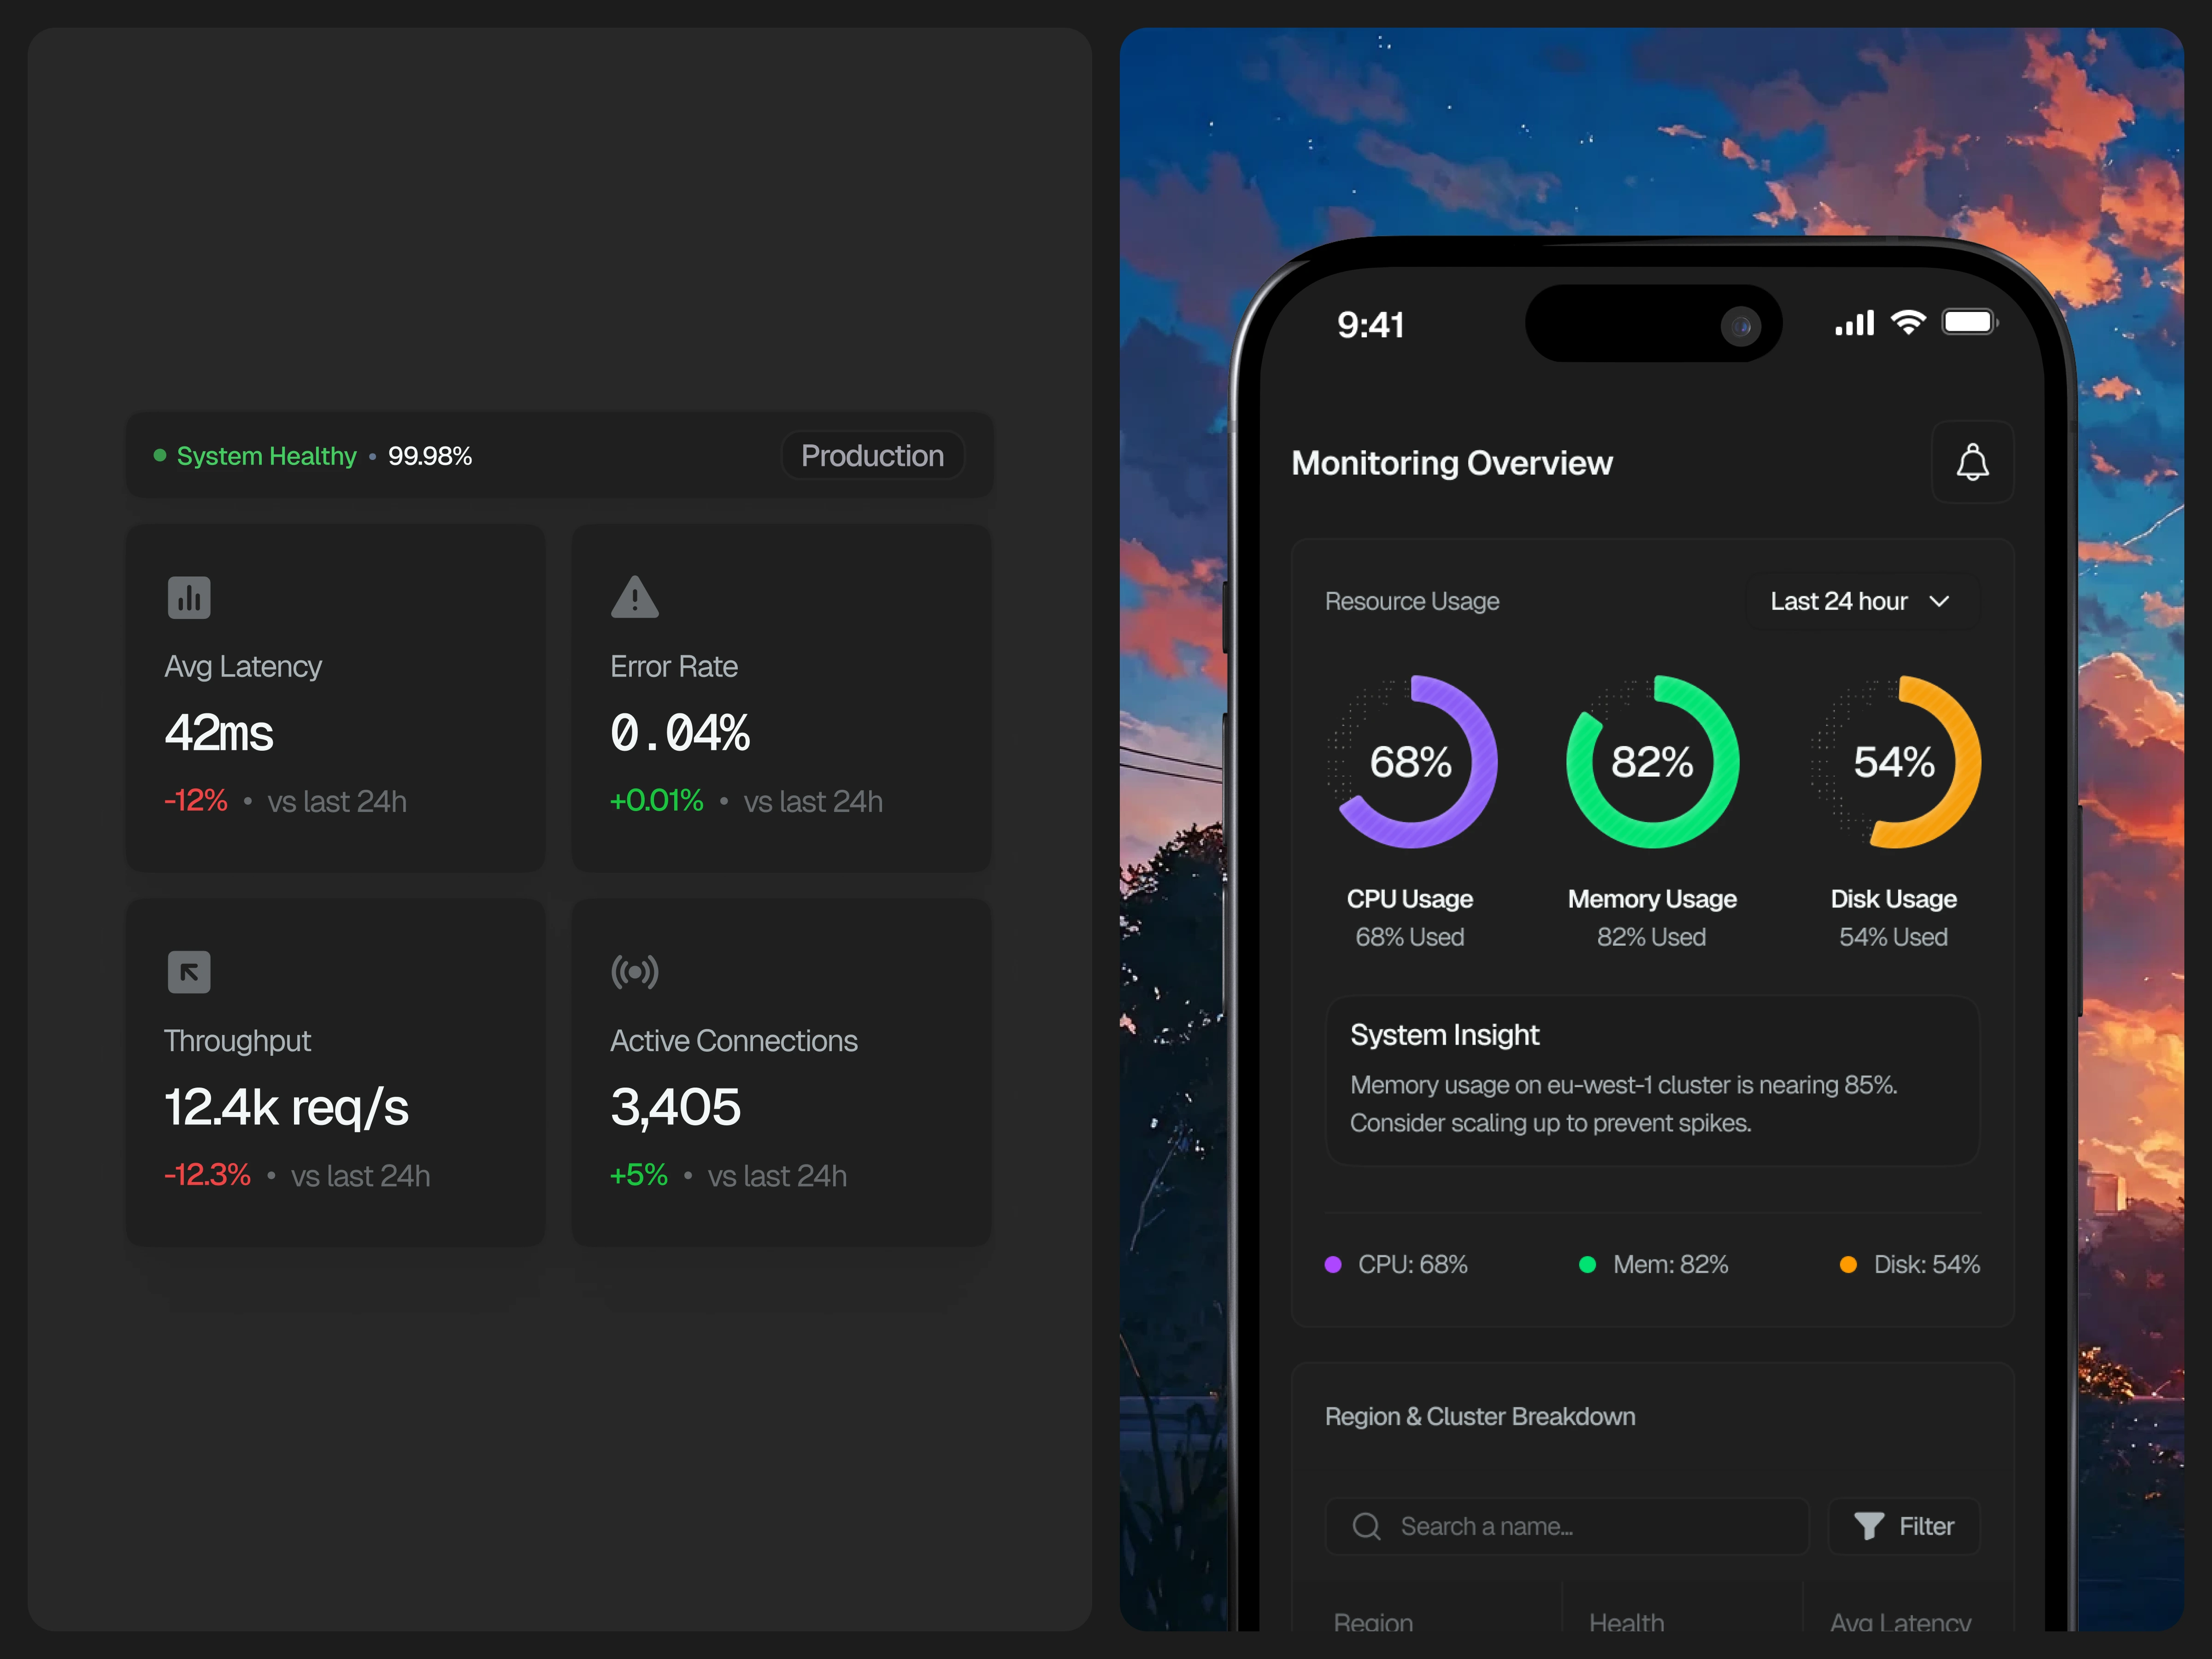
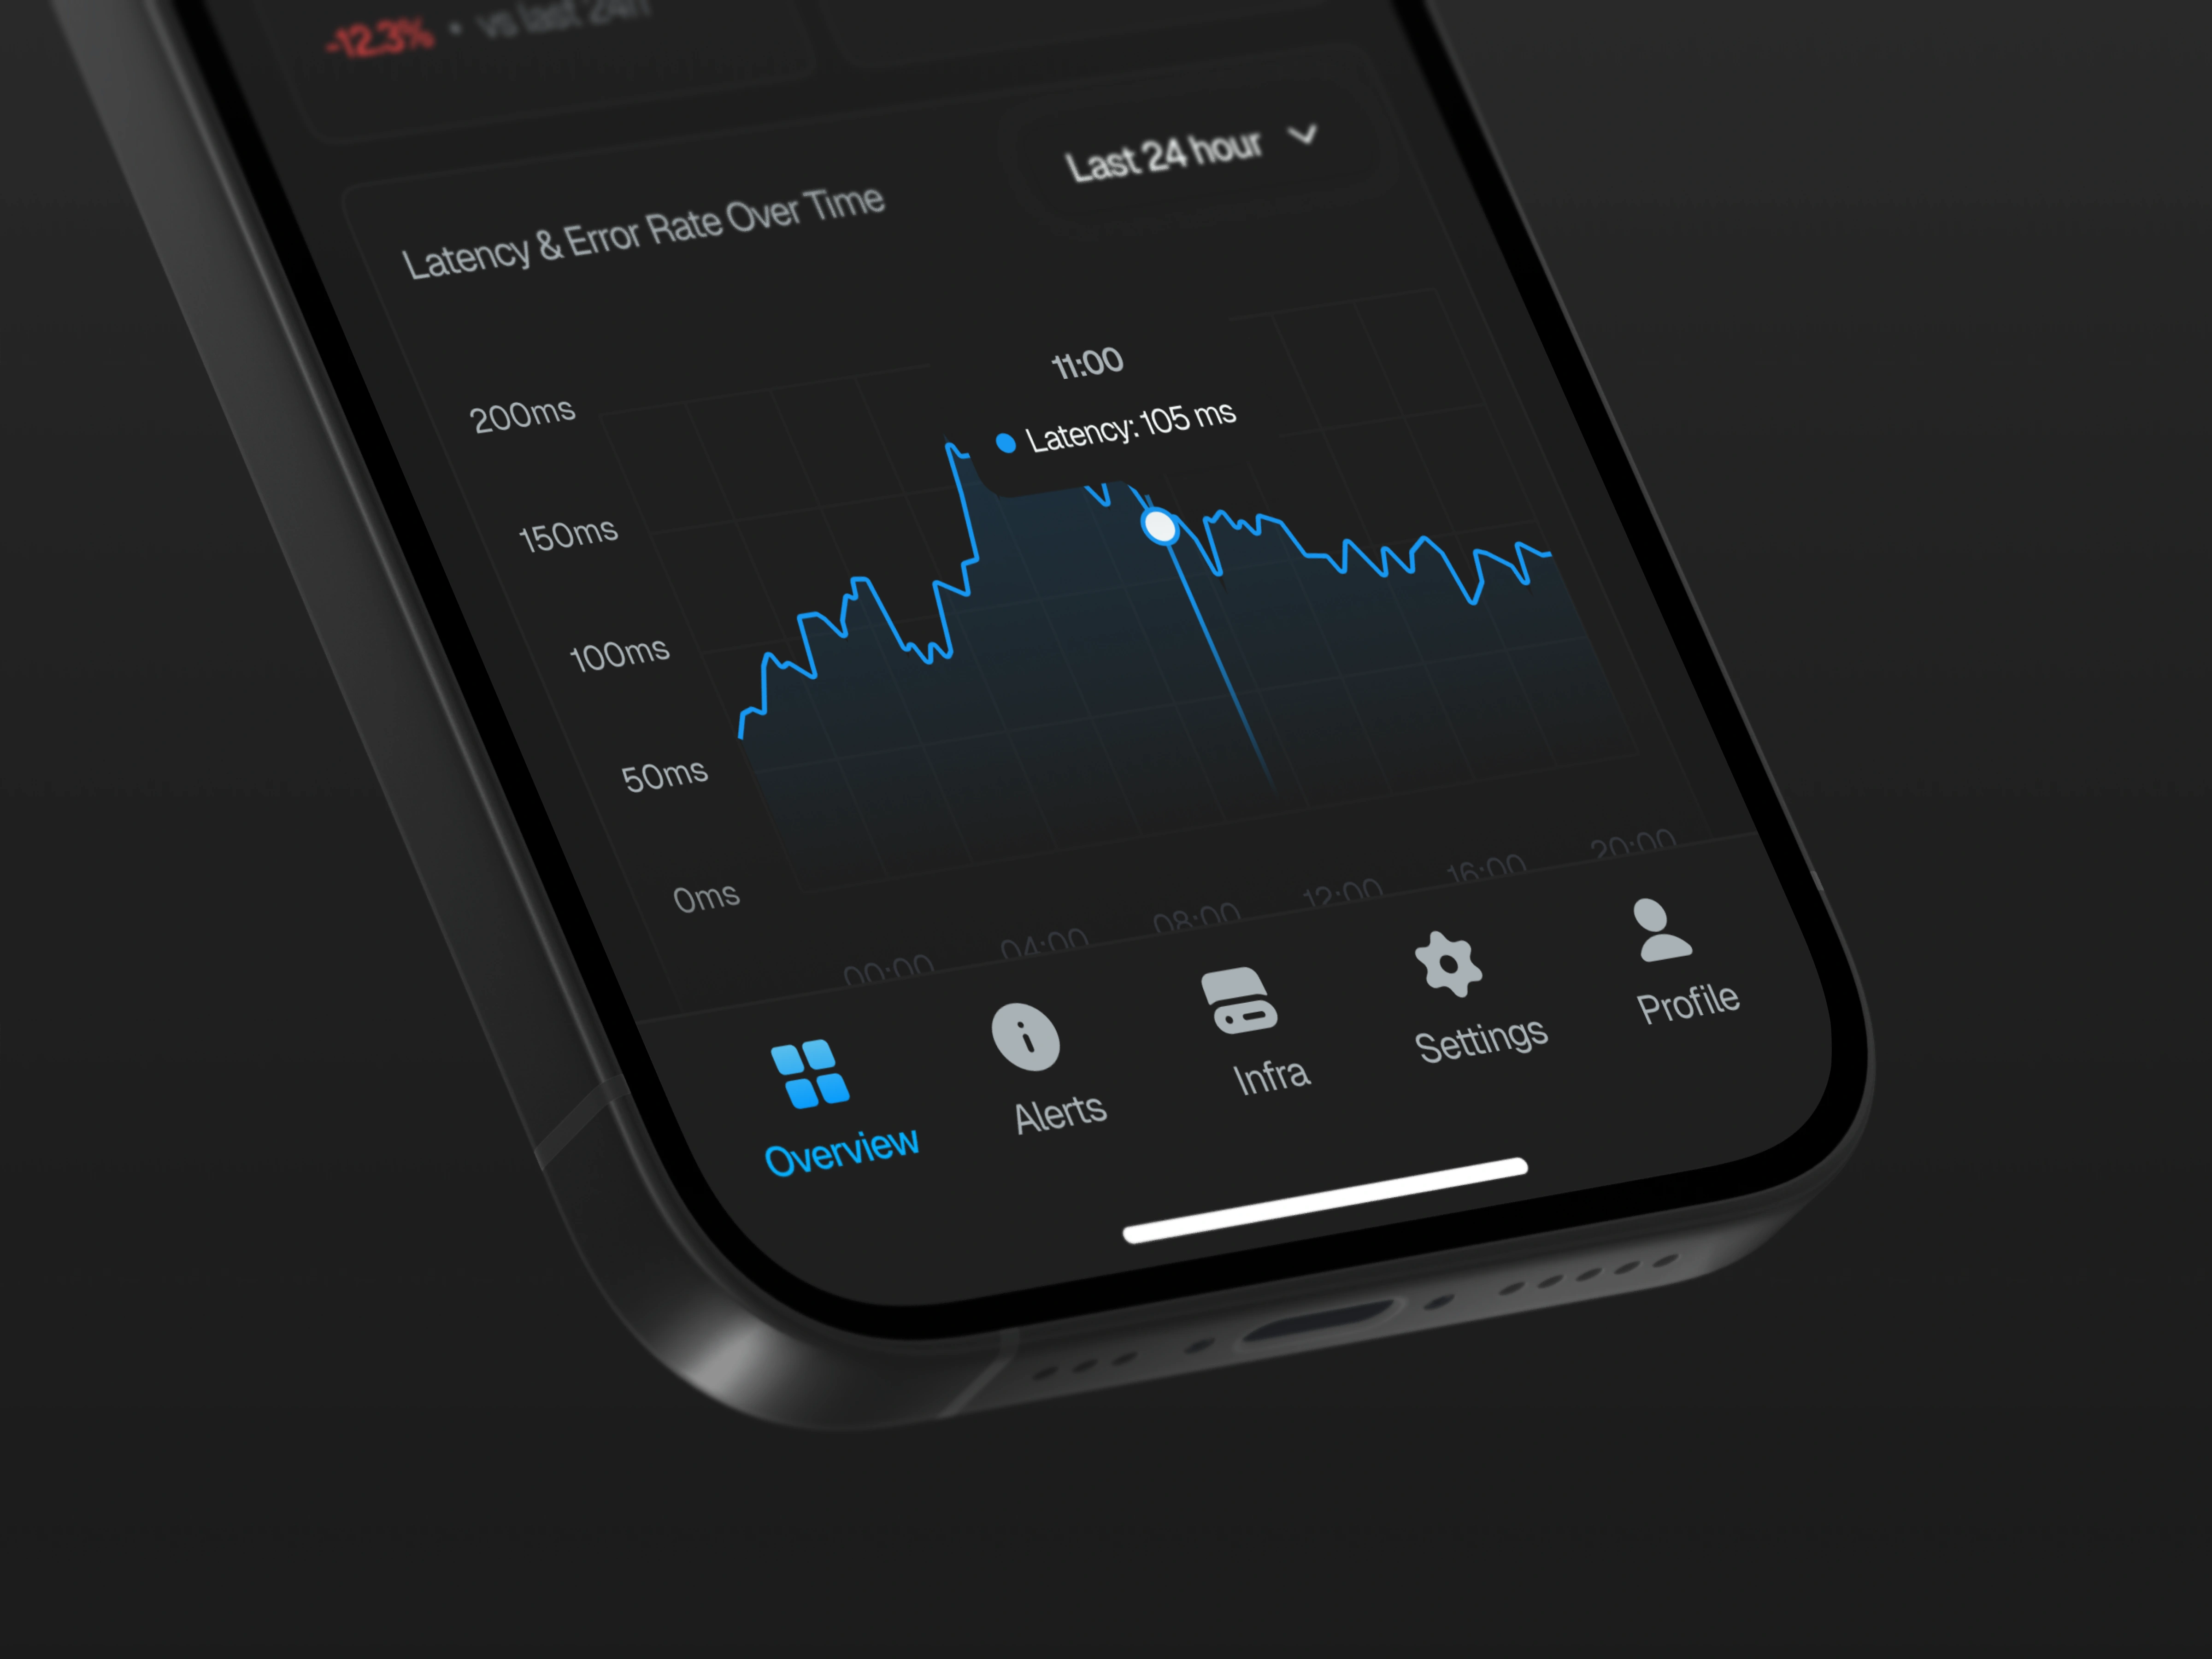
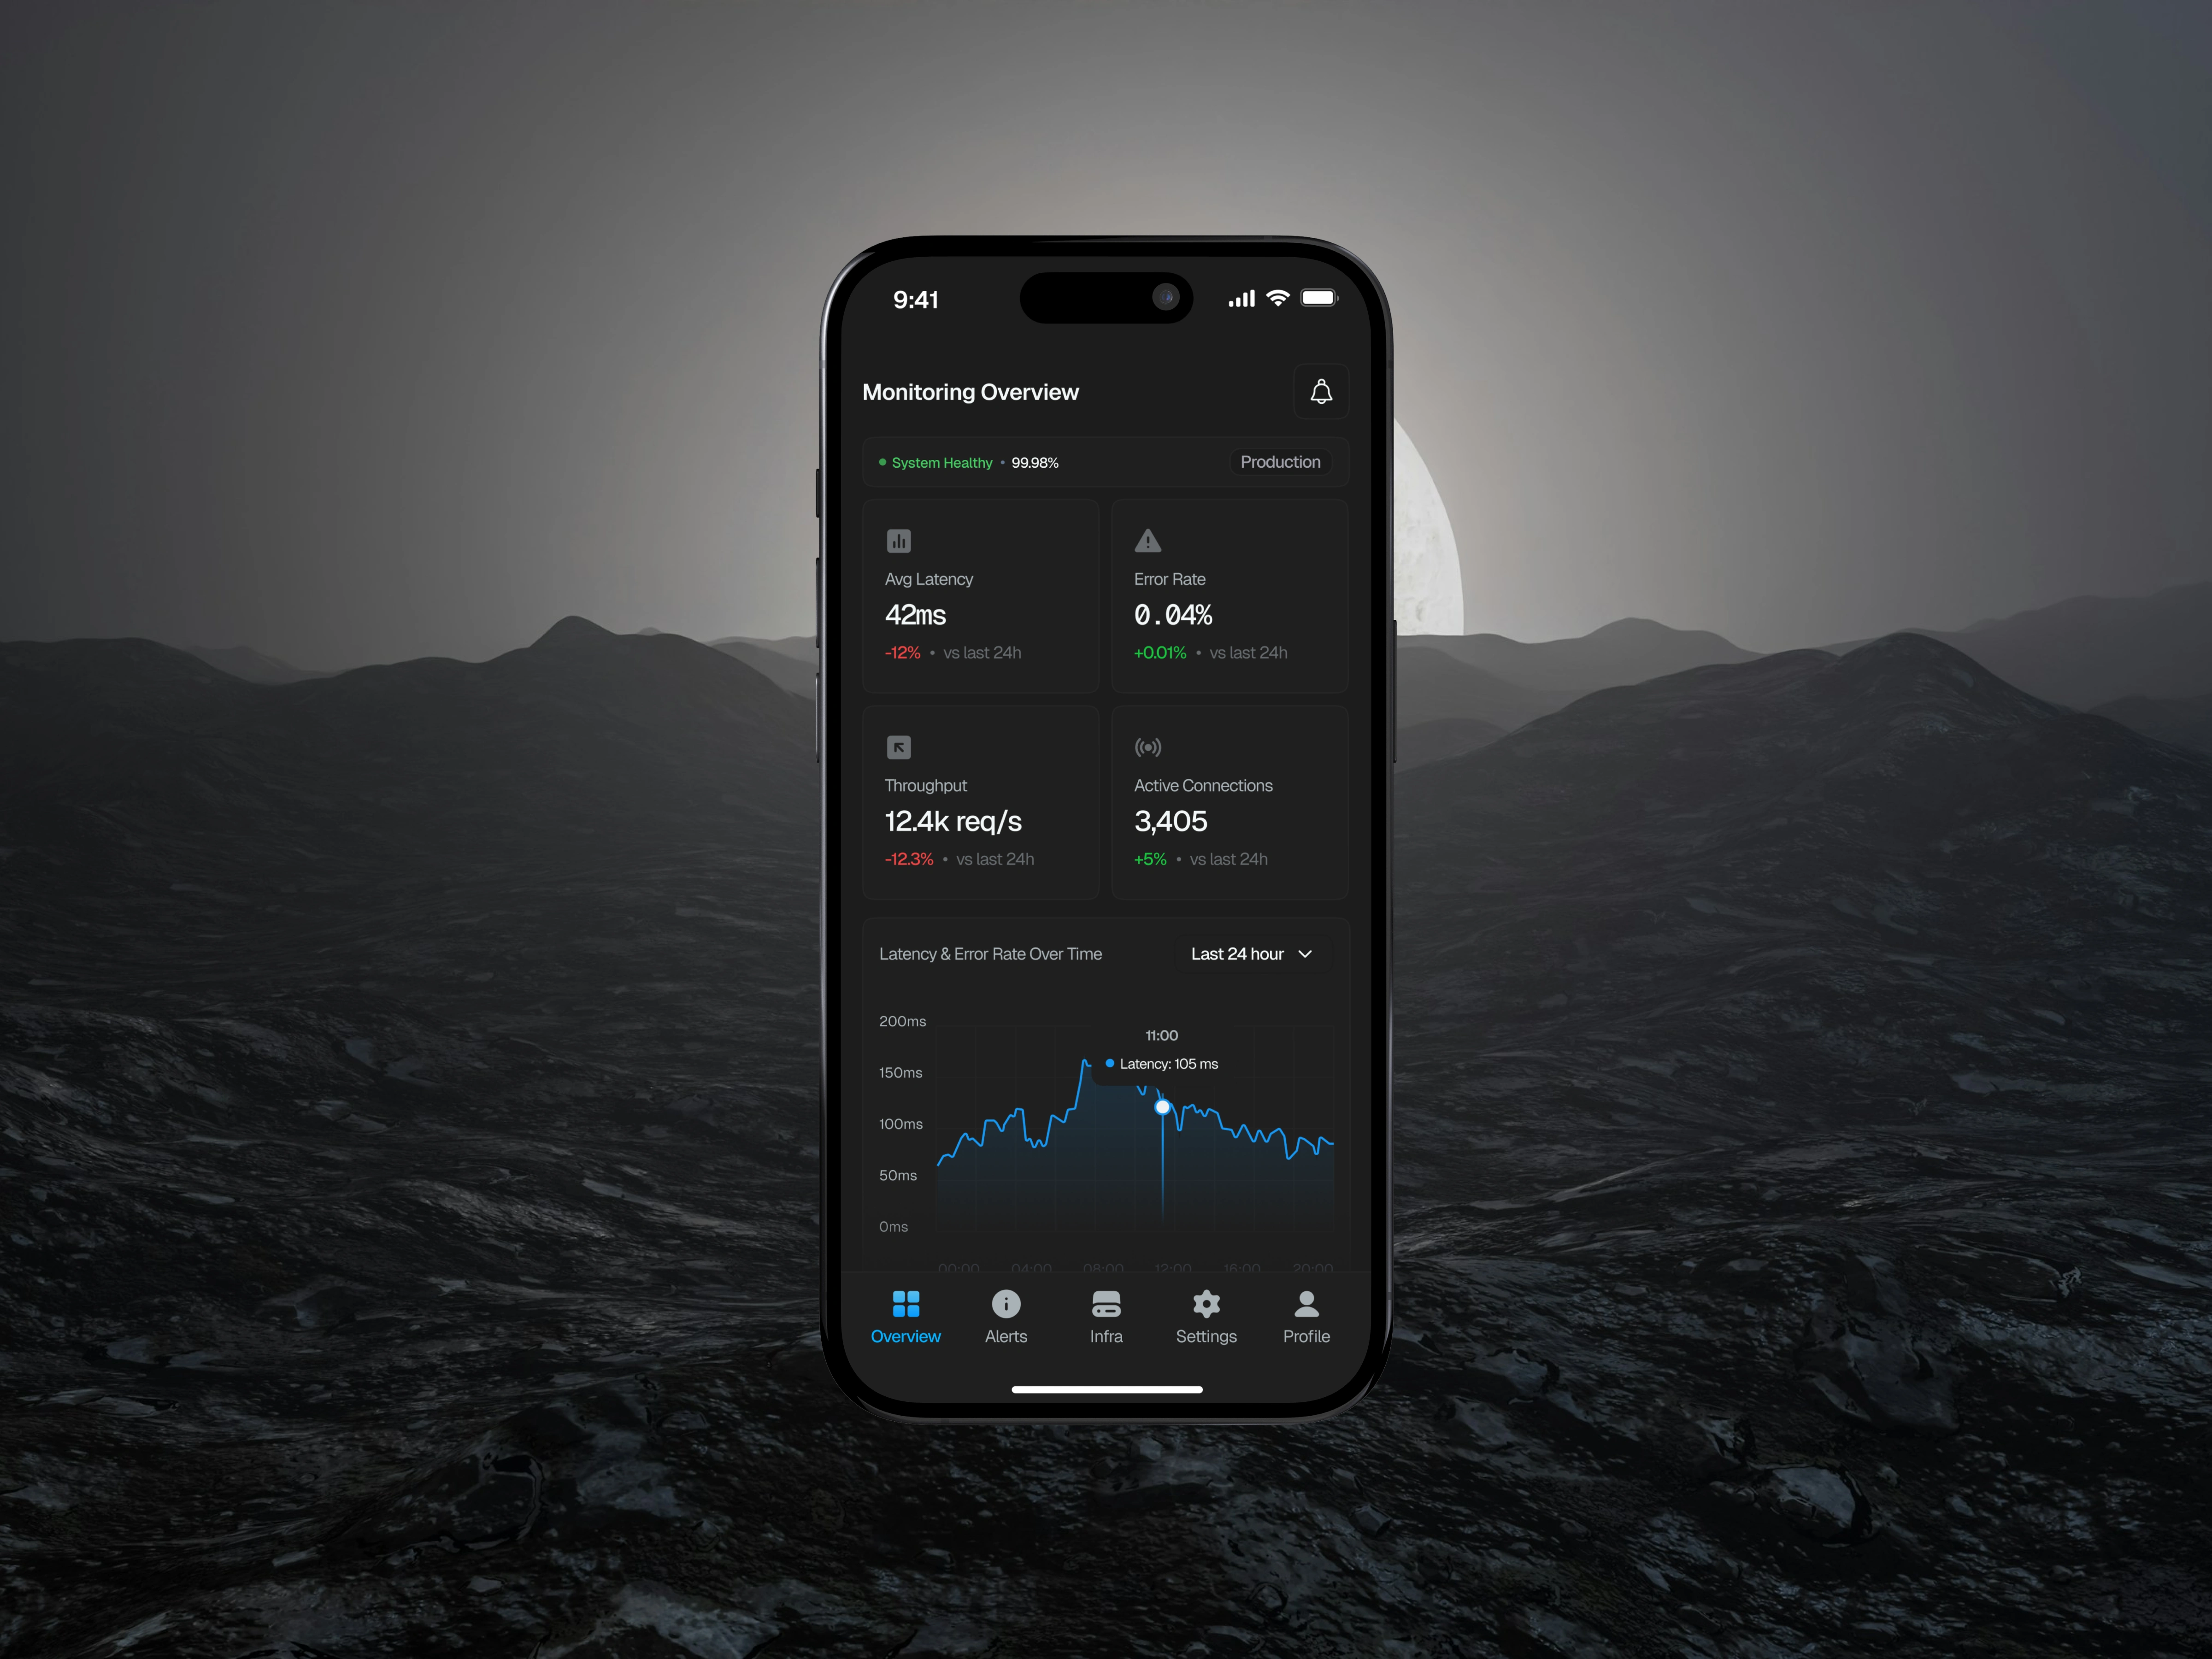
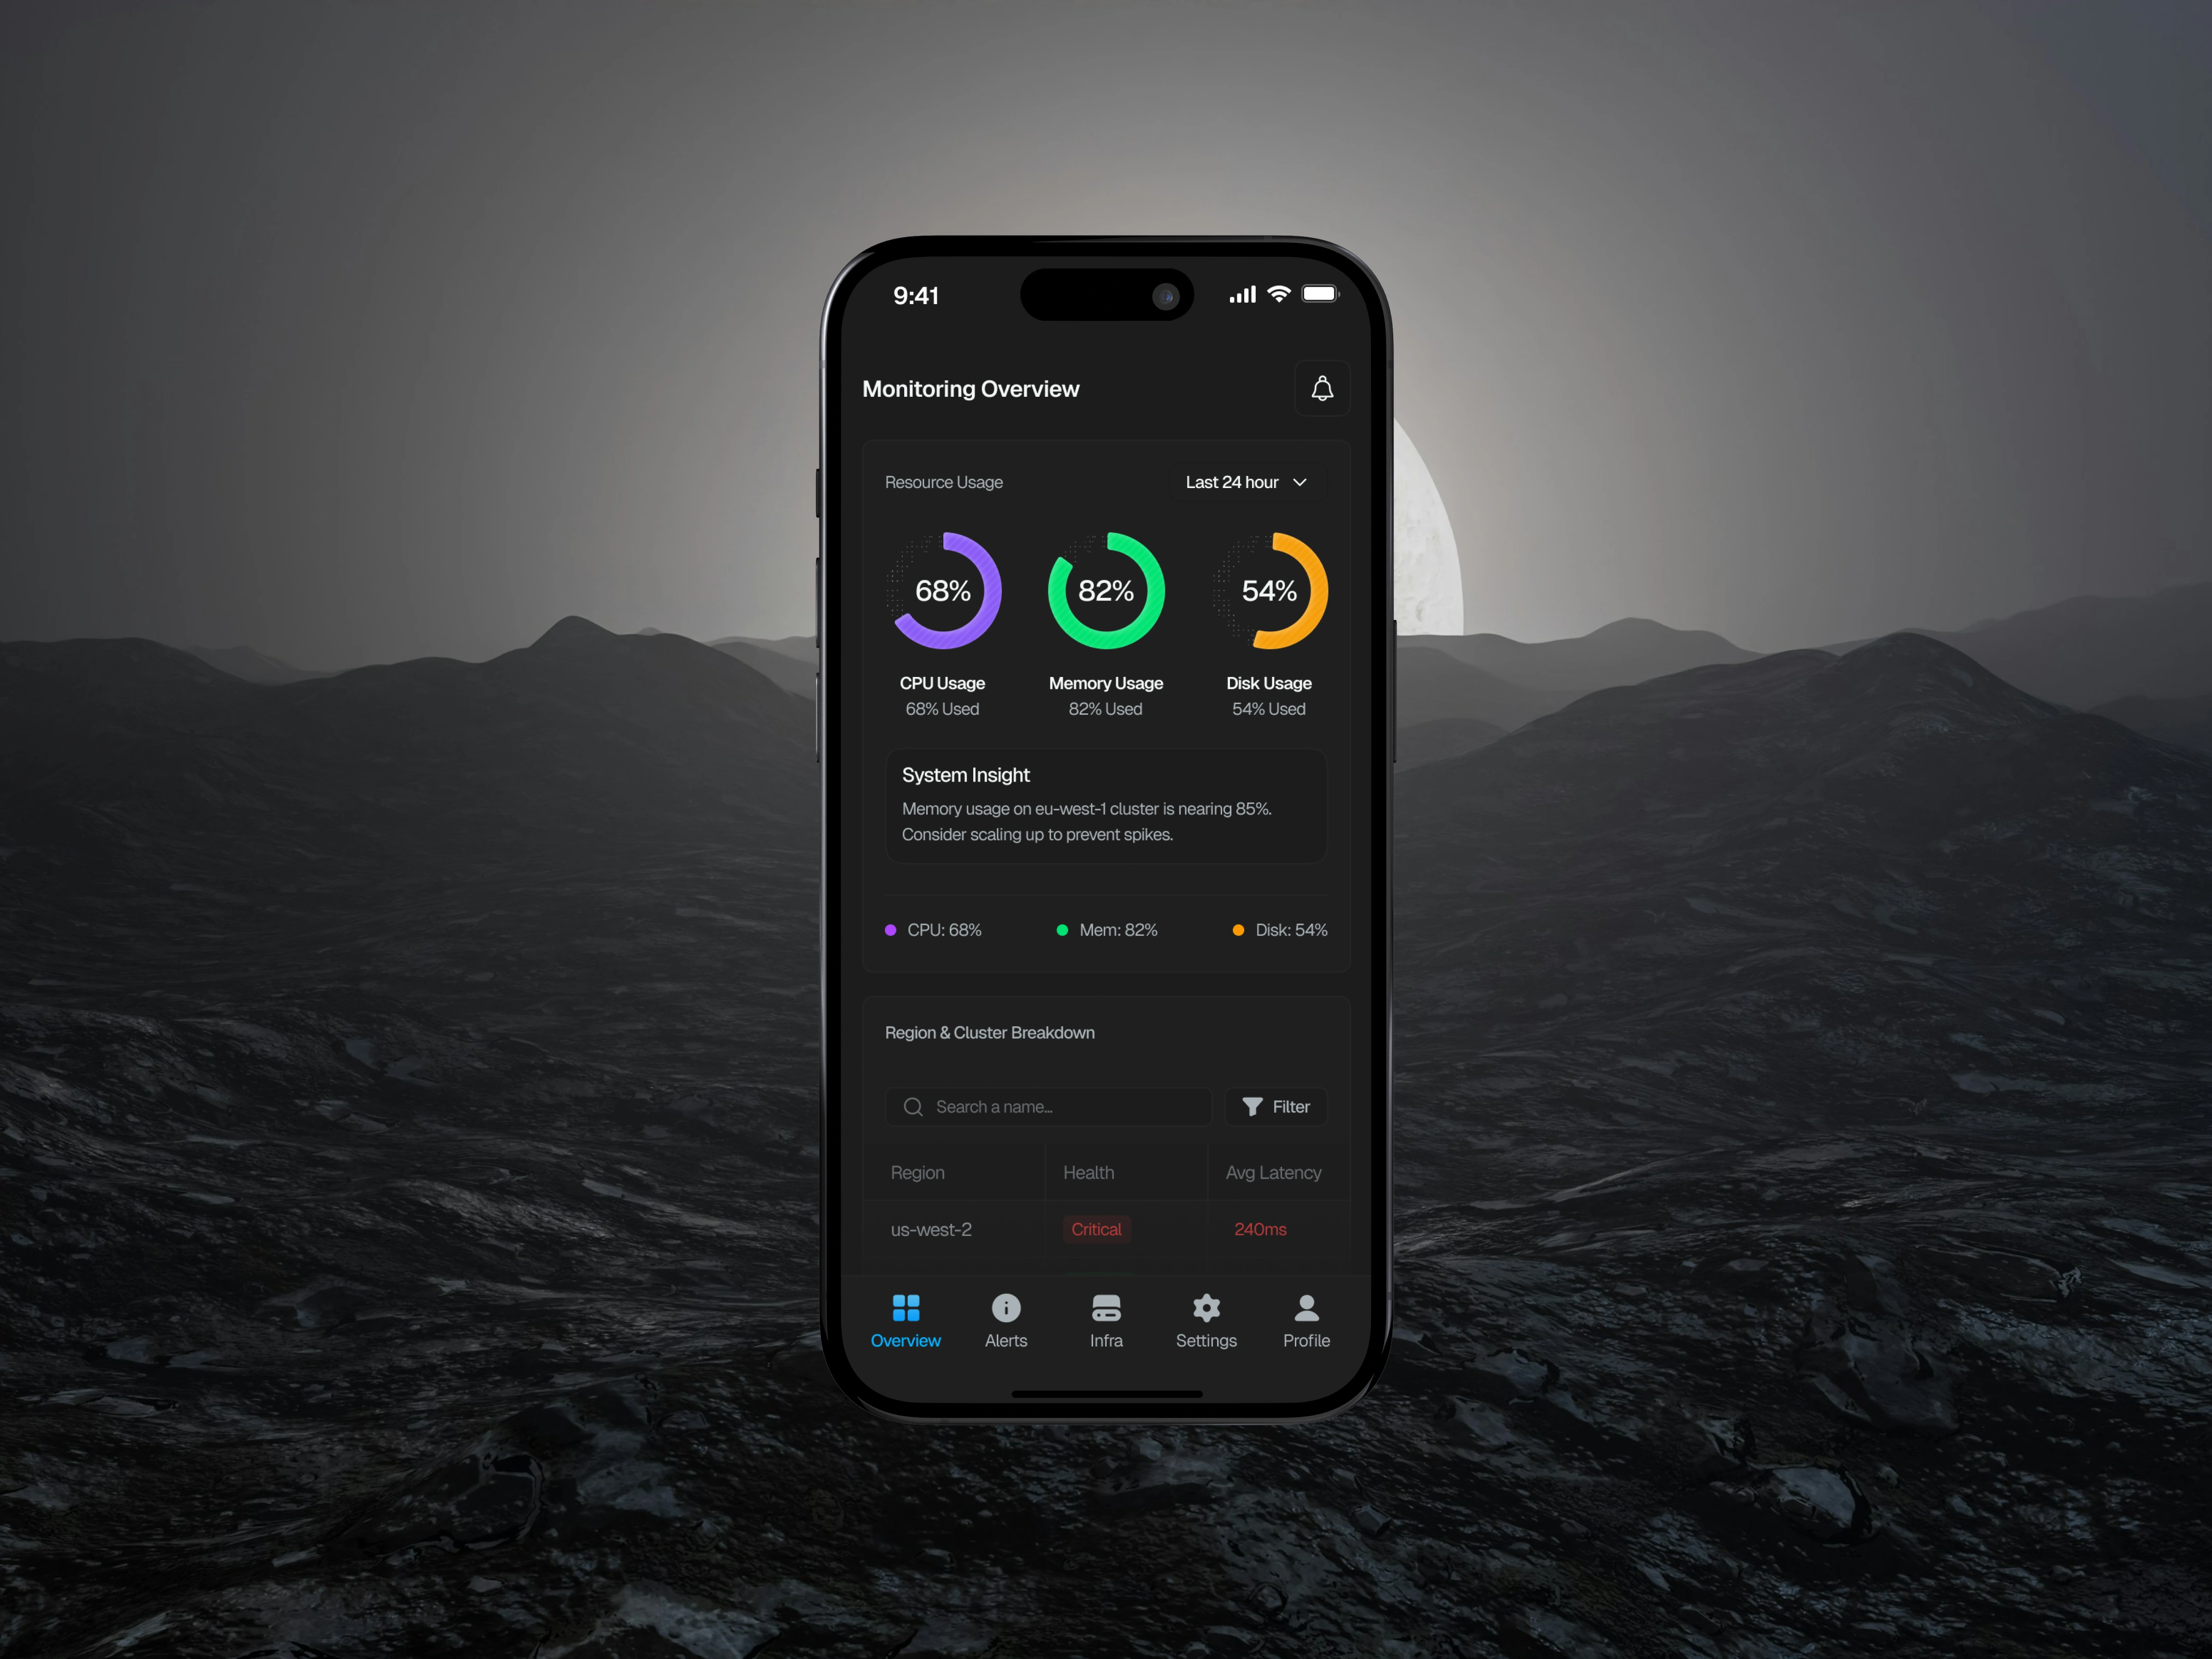
The solution was to design a mobile dashboard system focused on clarity, hierarchy, and real-time insights. Key system metrics are presented through modular System Metrics Cards, allowing engineers to quickly identify infrastructure health indicators such as latency, error rate, throughput, and active connections. A Resource Usage section visualizes CPU, memory, and disk utilization using color-coded radial charts, enabling instant performance recognition. The interface also introduces real-time latency graphs and cluster breakdown tables to provide deeper operational insights when needed.
Key Features
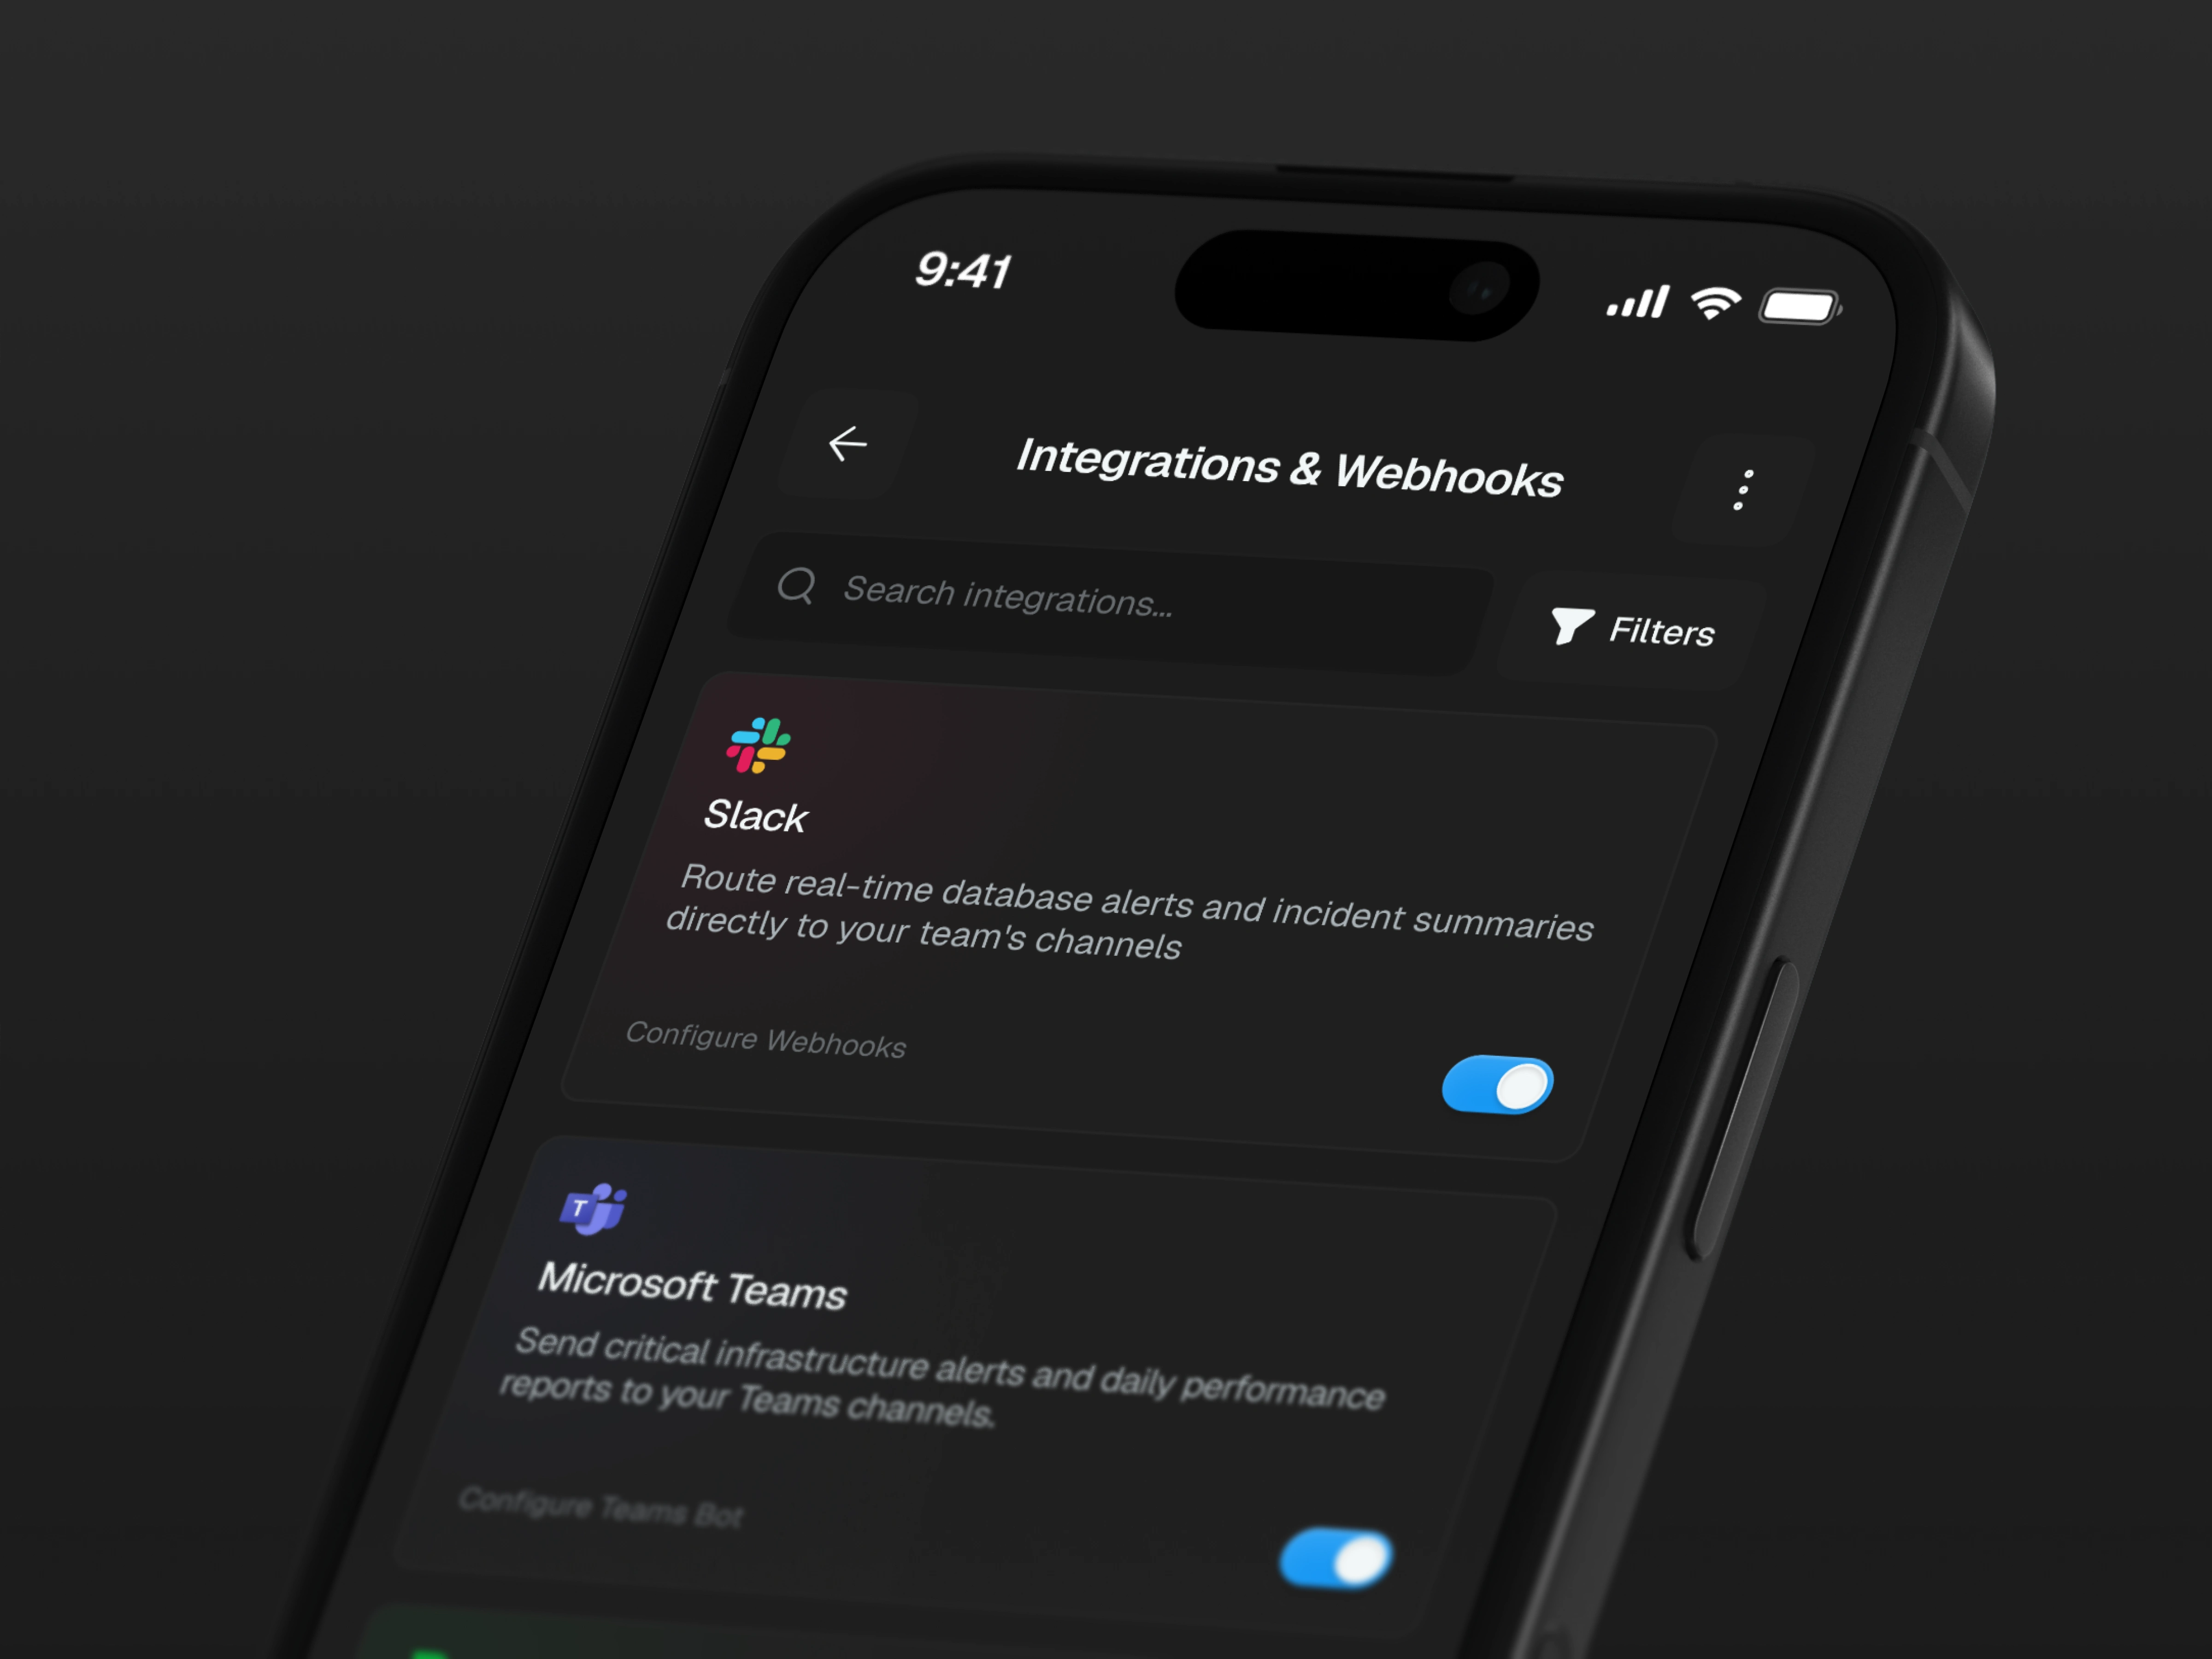
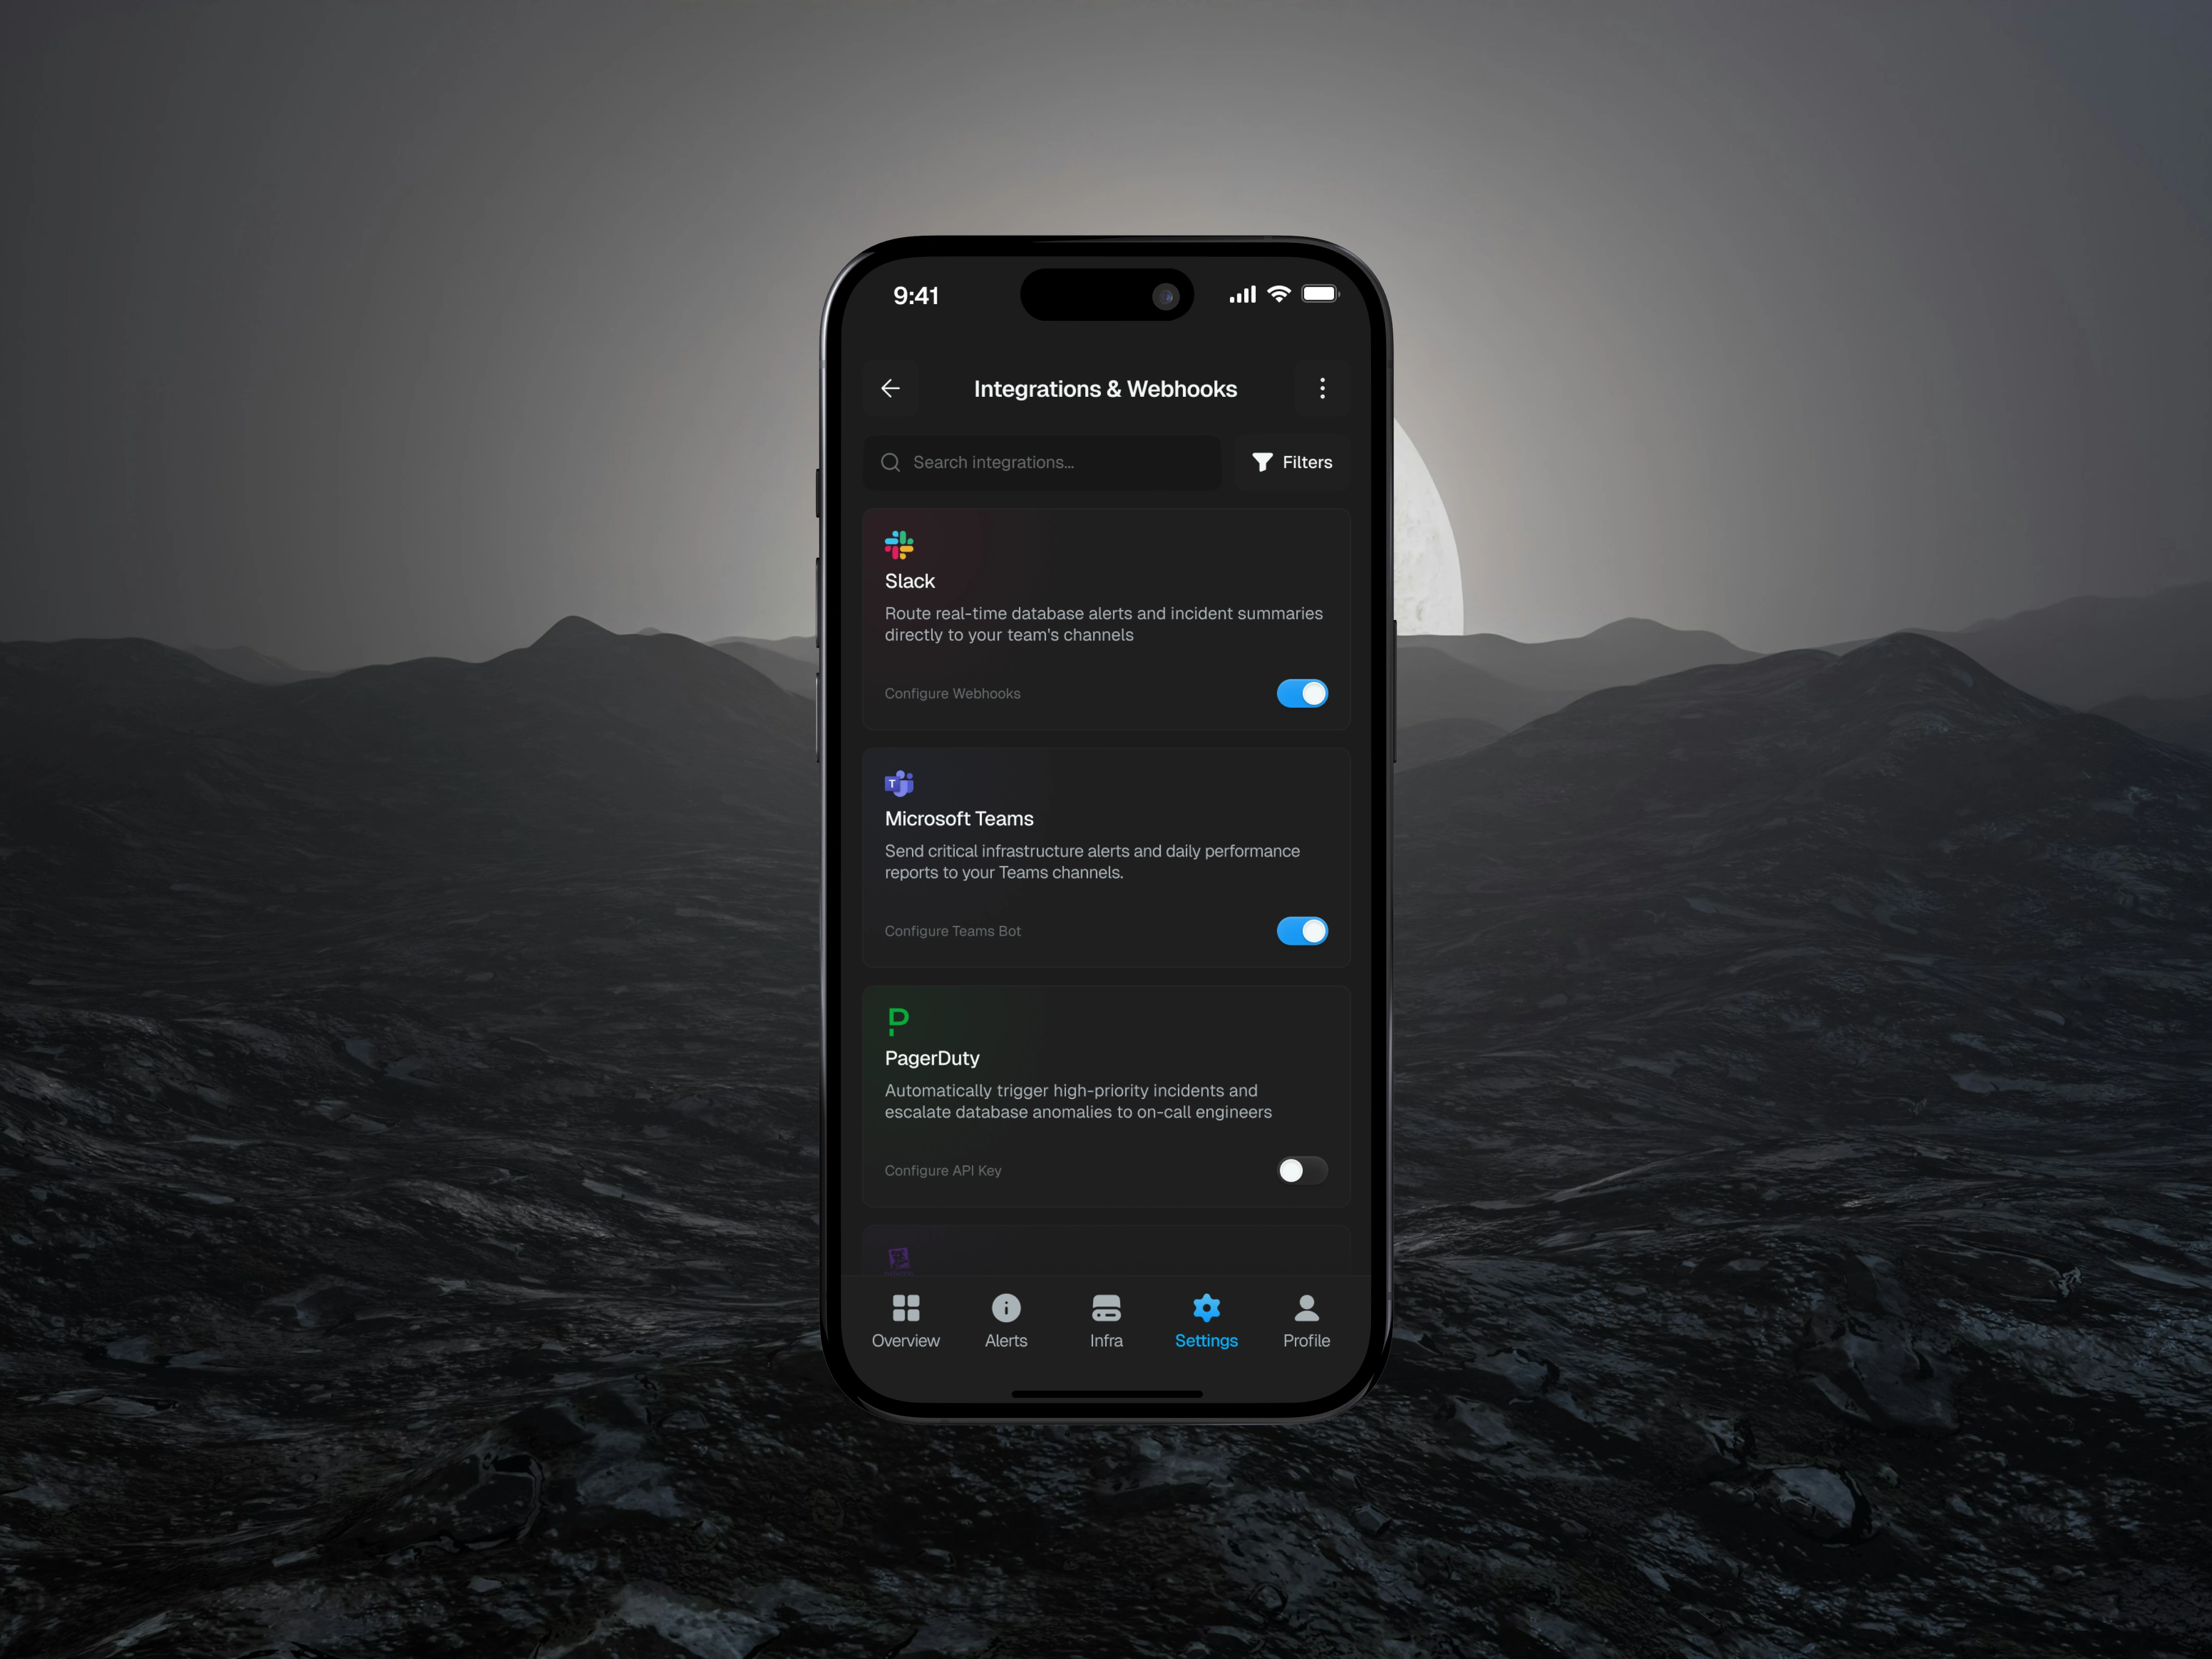
Several core features drive the experience of the monitoring dashboard. The Monitoring Overview provides a quick snapshot of system health and performance metrics. The Resource Usage Charts visualize infrastructure load across CPU, memory, and disk. The System Metrics Cards highlight operational KPIs such as latency and throughput. Additionally, the Integrations & Webhooks panel allows teams to connect external services like Slack, Microsoft Teams, and PagerDuty to automate incident alerts and infrastructure notifications
Impact
This design demonstrates how infrastructure monitoring tools can become more accessible through thoughtful mobile UX design. By simplifying complex data into structured visual components, engineers can quickly detect system anomalies, understand performance trends, and respond to incidents faster. The result is a modern mobile monitoring dashboard that balances clarity, usability, and real-time analytics for serverless database environments.
Like this project
Posted Mar 12, 2026
Serverless database monitoring mobile dashboard with real-time analytics, system metrics, and infrastructure insights for faster DevOps decision making.
Likes
1
Views
5