Built with Jitter
Solar Energy Monitoring App Design

Kris Anfalova


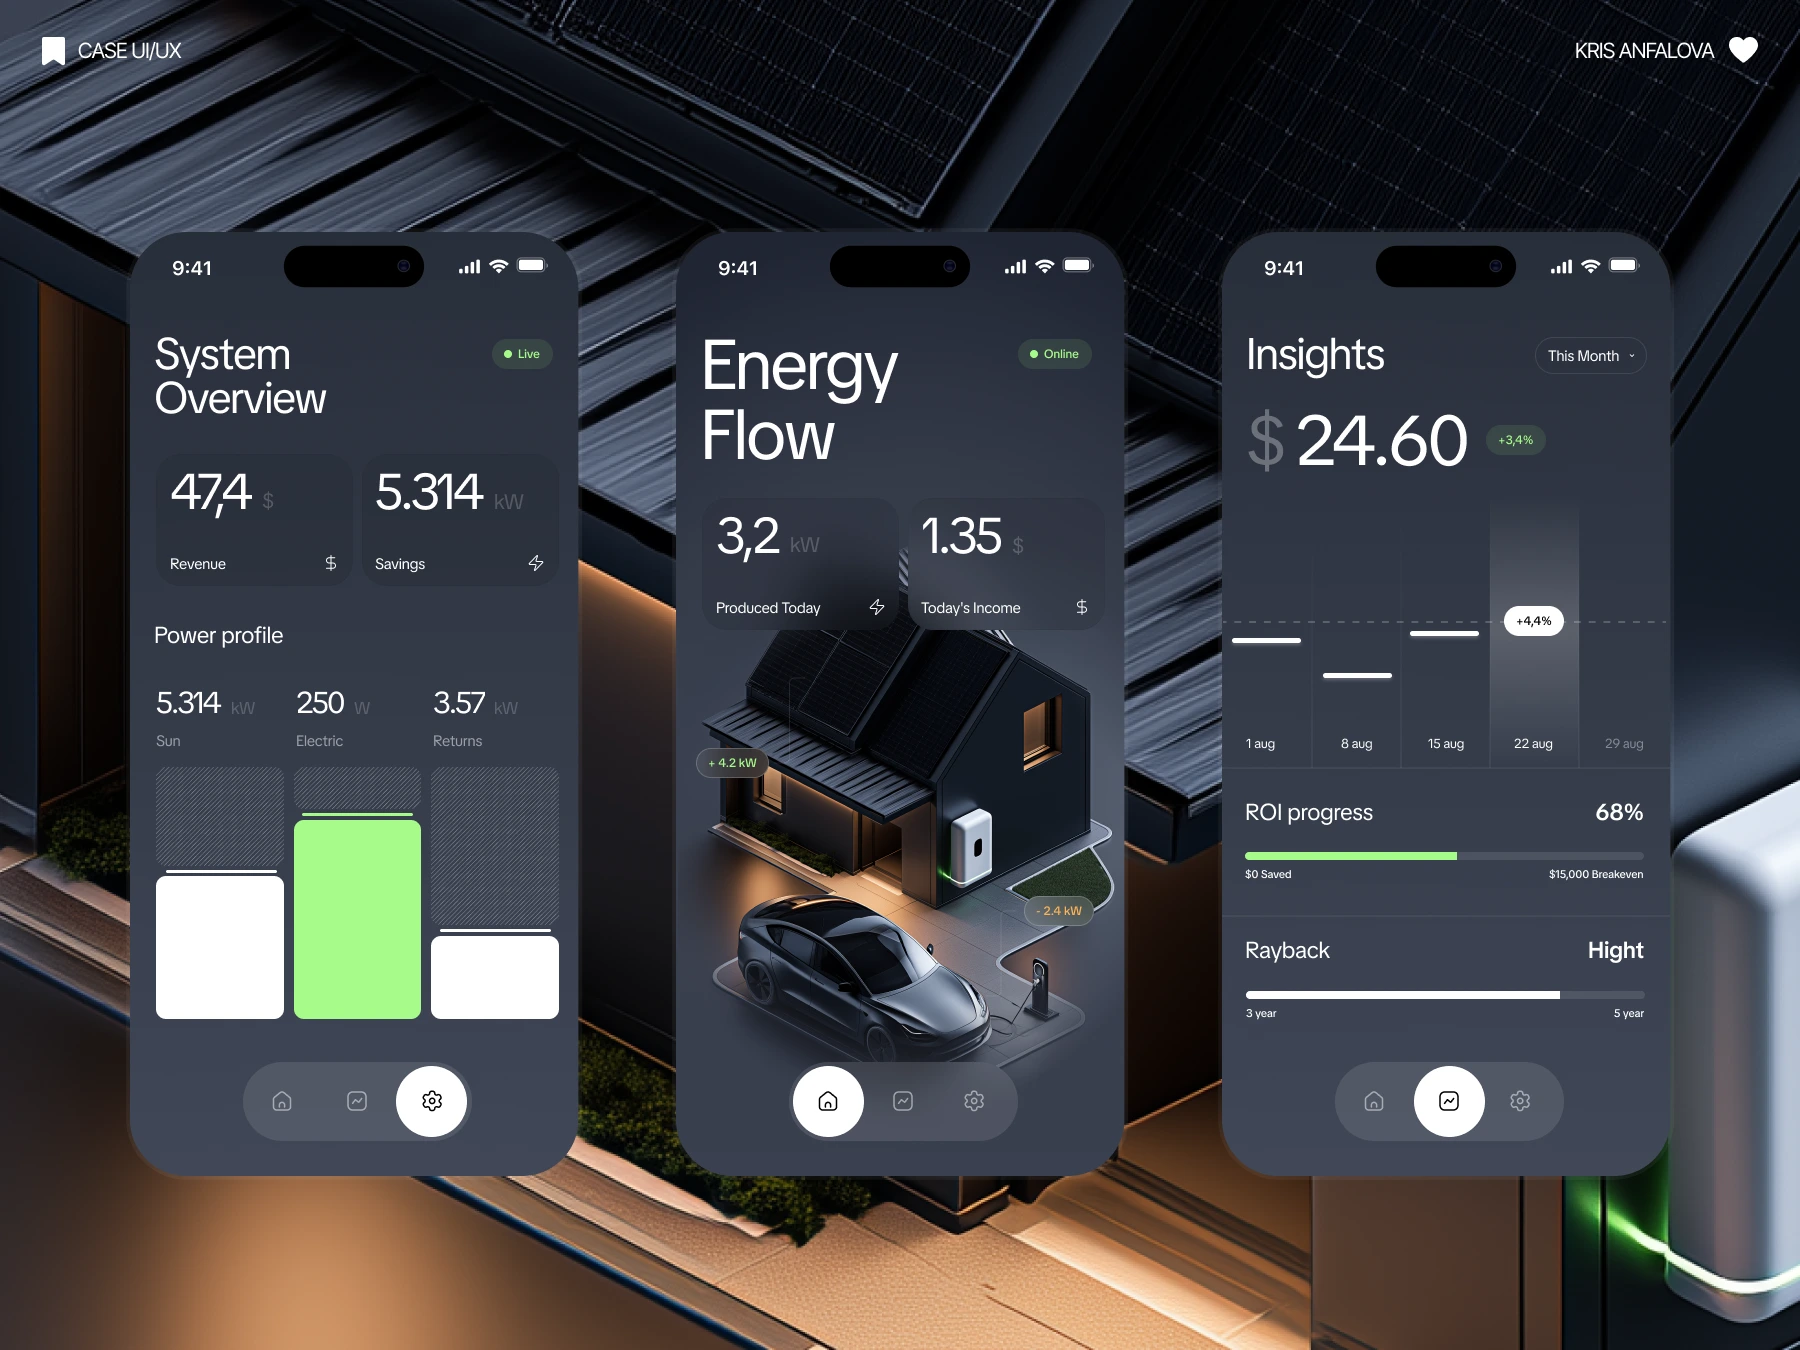
A mobile app for monitoring home solar energy systems — production, consumption, savings, and long-term ROI. I designed three core screens: system overview, real-time energy flow, and financial insights.
My role: UI/UX Design
Scope: Mobile app — dashboard, energy visualization, financial insights screen
The Problem
Solar monitoring apps sit in an odd spot: they need to satisfy two very different needs at once. On one side, real-time technical data — how many kW are being produced right now, where the power is routing, battery status. On the other, the financial story that convinced someone to install solar in the first place — how much they're saving, and when the system pays for itself.
Most apps pick a lane. Either they're dense energy dashboards that ignore the money question, or they're finance-first apps that bury the actual system data. Neither answers what a homeowner actually opens the app to check.
The Approach
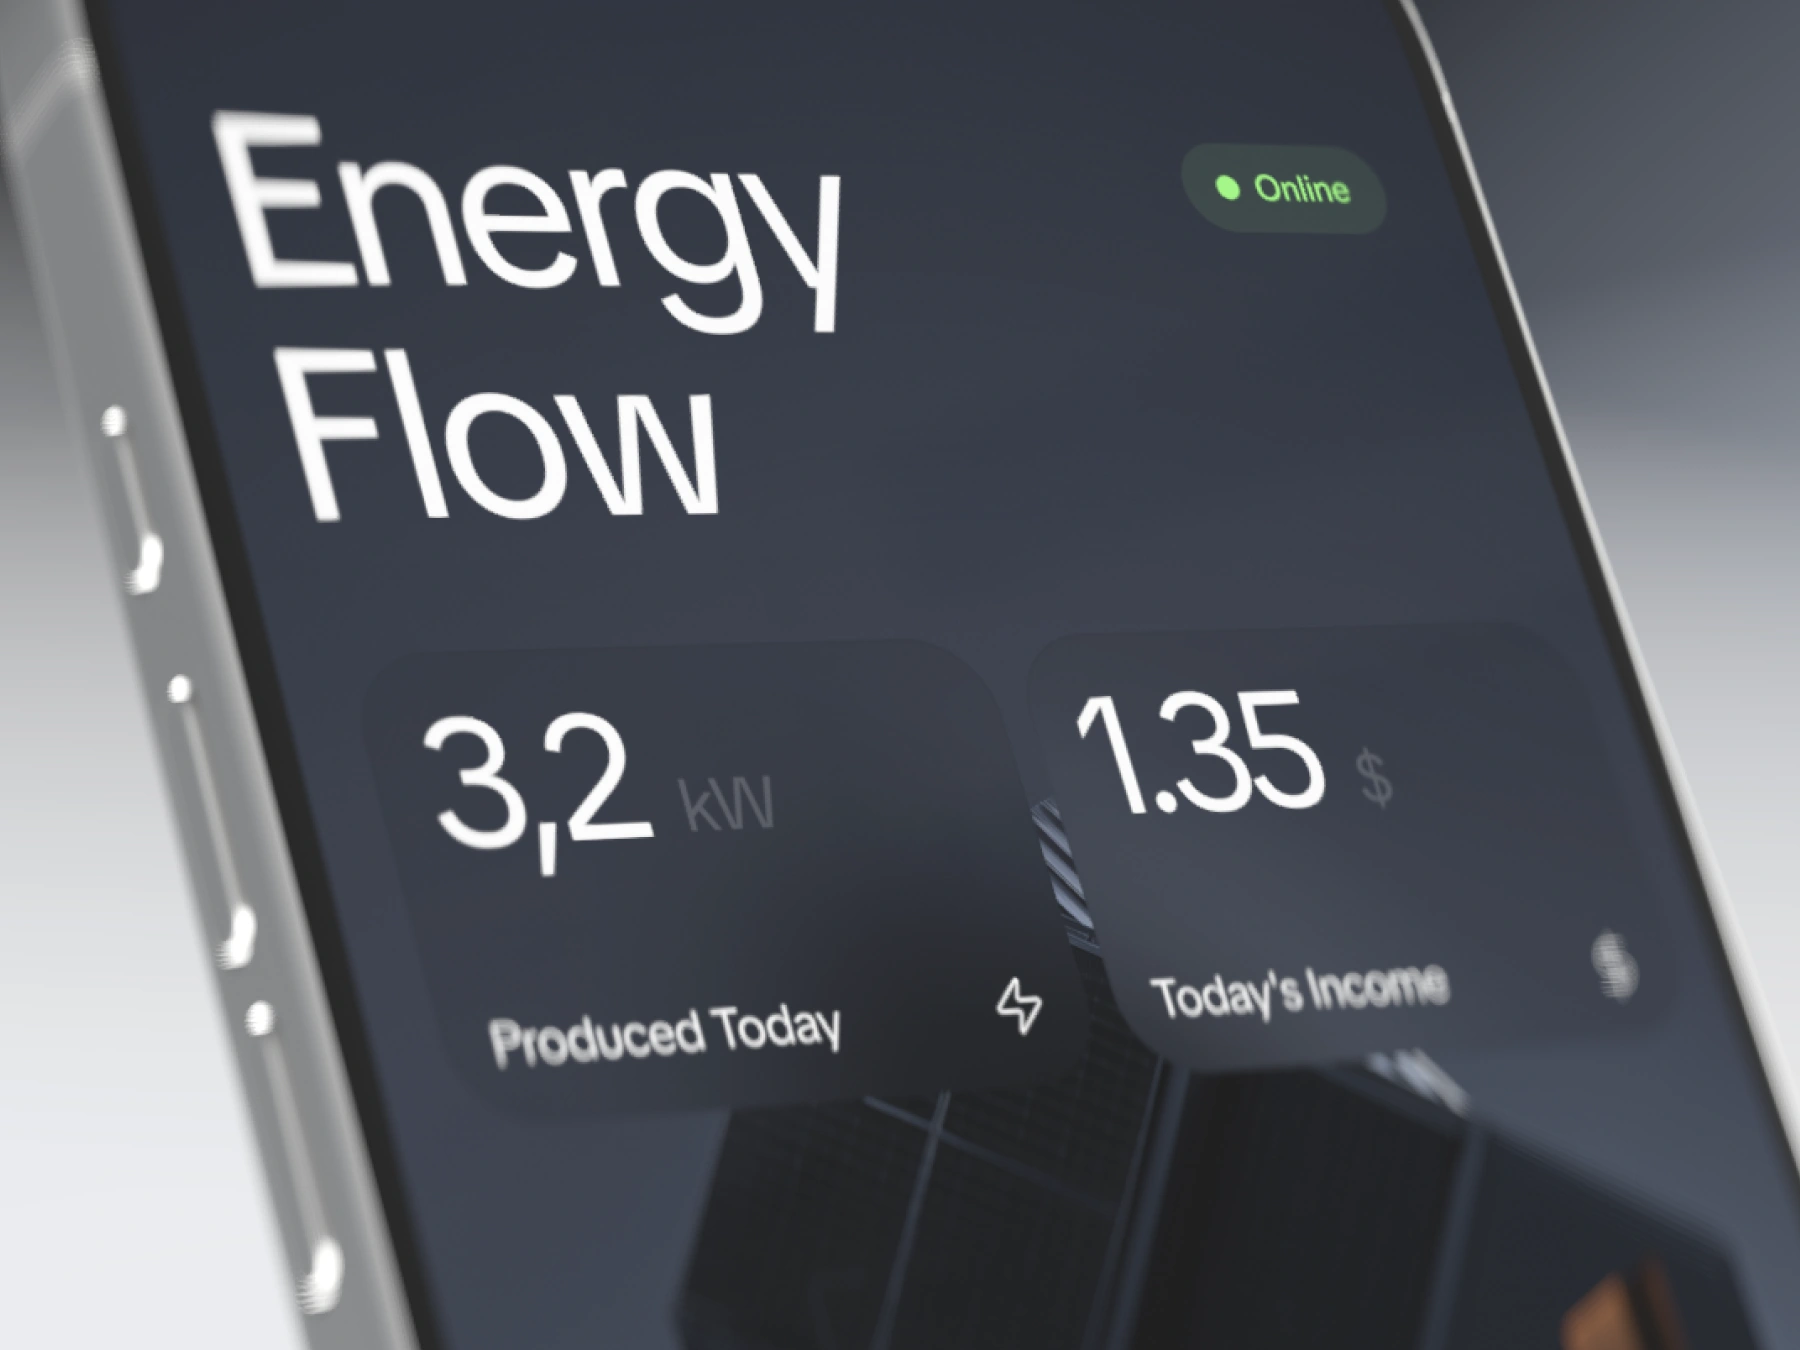
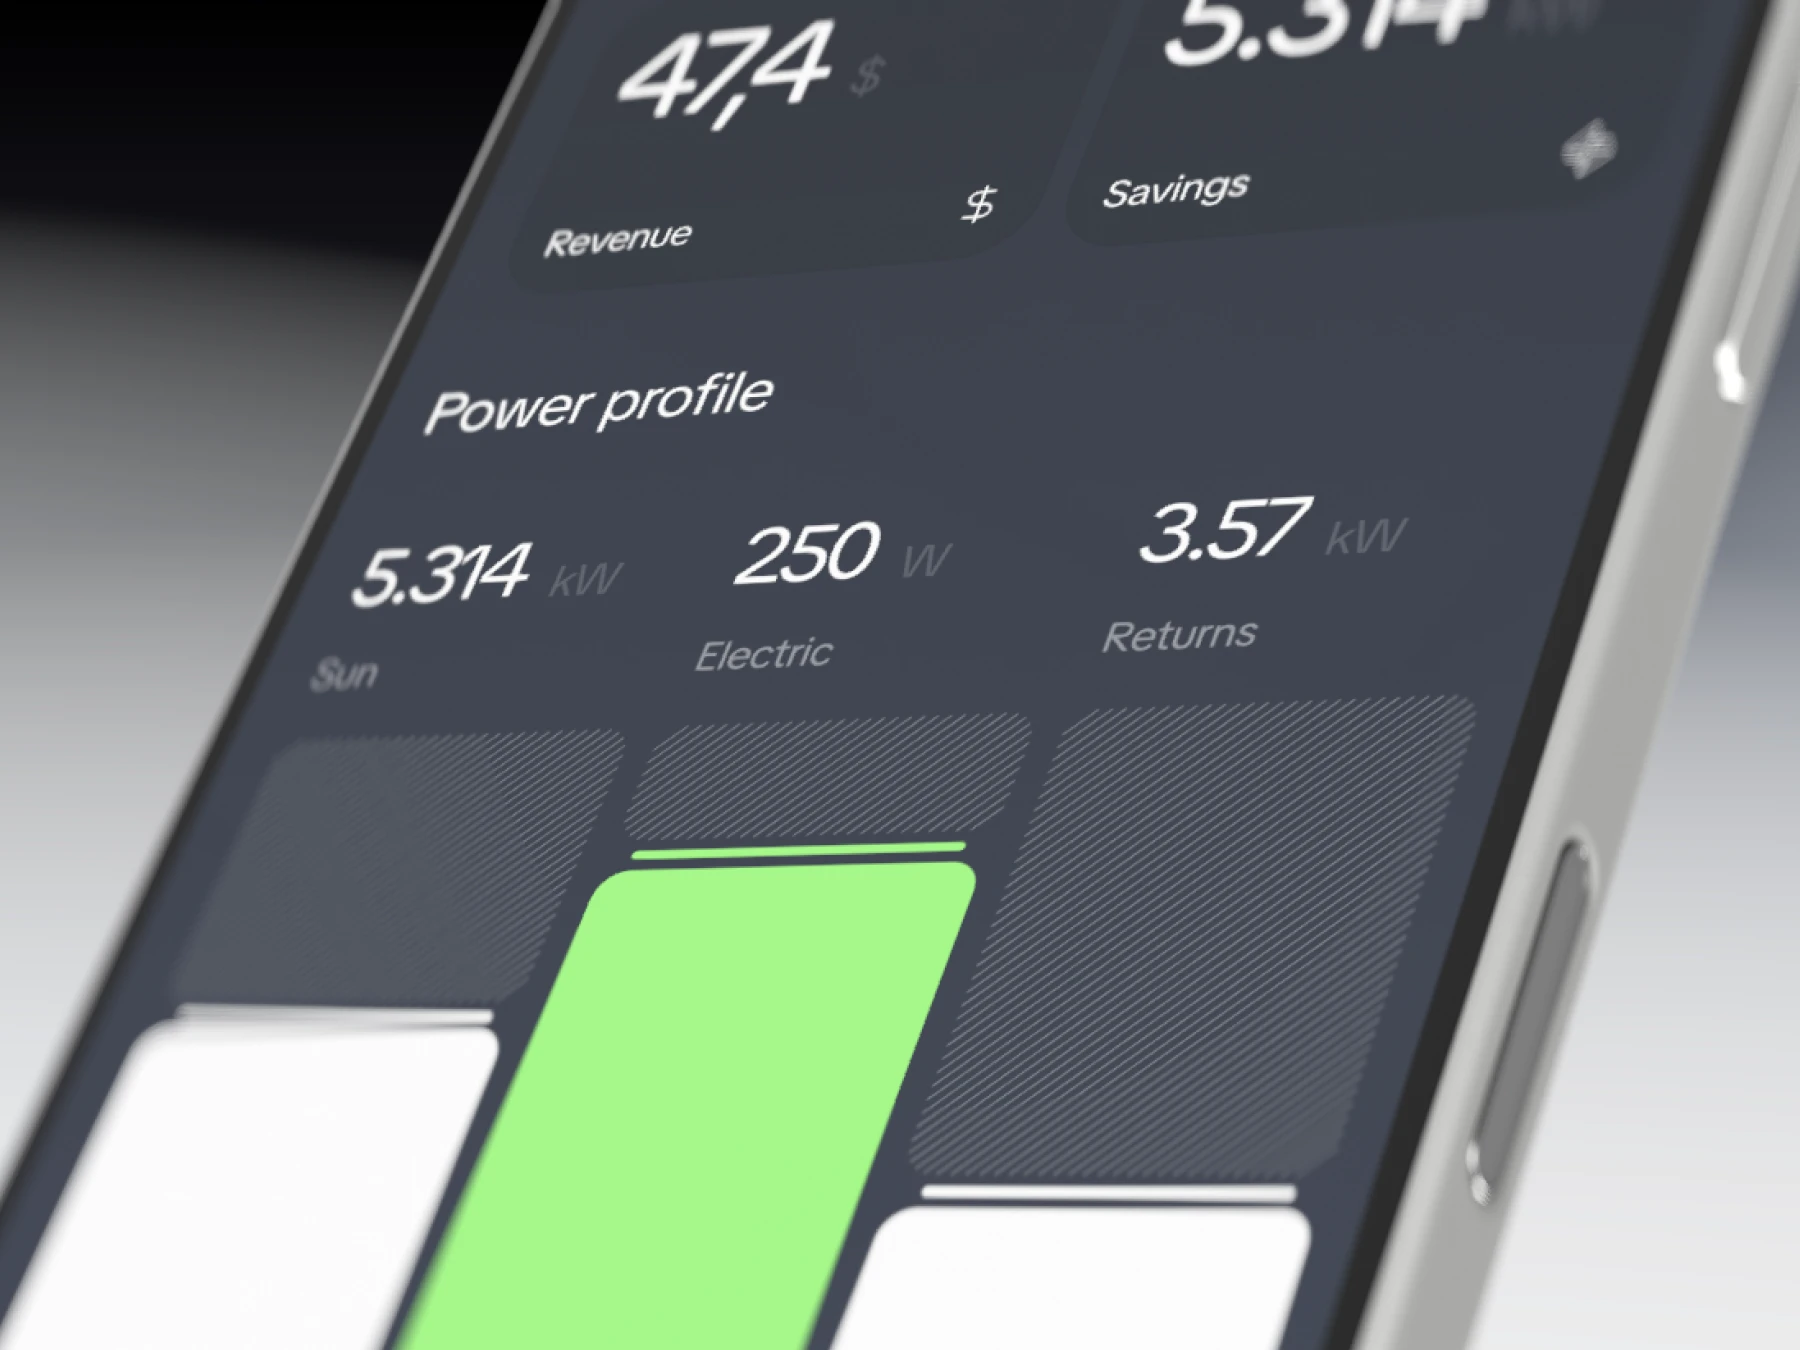
I structured each screen around a single hero number first — revenue, kW produced, or dollar income — so the most important answer is visible in under a second, before anything else competes for attention. Supporting detail (power profile, produced-today breakdown, ROI progress) sits below, available on demand rather than upfront.
For the Energy Flow screen specifically, I moved away from generic icon-based diagrams and used a real 3D-rendered home — solar panels, EV charging, battery unit — with directional callouts (+4.2 kW in, -2.4 kW out) layered directly on top. This makes an abstract concept (energy routing through a house) feel concrete and specific to this home, not a generic system diagram.
Closing the loop on ROI
The third screen, Insights, exists specifically to answer the question every solar owner eventually asks: "was this worth it?" A monthly income trend chart leads into a clear ROI progress bar ($0 saved → $15,000 breakeven) and a payback period comparison (3-year vs. 5-year), turning raw production data into the financial payoff story that matters long-term.
A solar app that treats energy data and financial outcomes as equally important — not one dashboard bolted onto another. The 3D home visualization makes live power flow legible at a glance, while the dedicated Insights screen gives owners the long-term ROI story that's usually missing from monitoring apps entirely.
Like this project
Posted Aug 23, 2026
A mobile app for monitoring home solar energy systems, consumption, savings, and ROI. I designed 3 screens: overview, real-time energy, and financial insights.
Likes
5
Views
38
Timeline
Aug 22, 2026 - Aug 23, 2026