Turning Complex Medical Data Into Visual Communication

Scott DS Young


Turning Complex Medical Data Into Visual Communication
iNAP needed a clearer way to communicate medical data, patient insights, and product benefits. I redesigned the information into a more visual communication system—using structured content, custom iconography, illustration, and data visualization to make complex information easier to scan and understand.
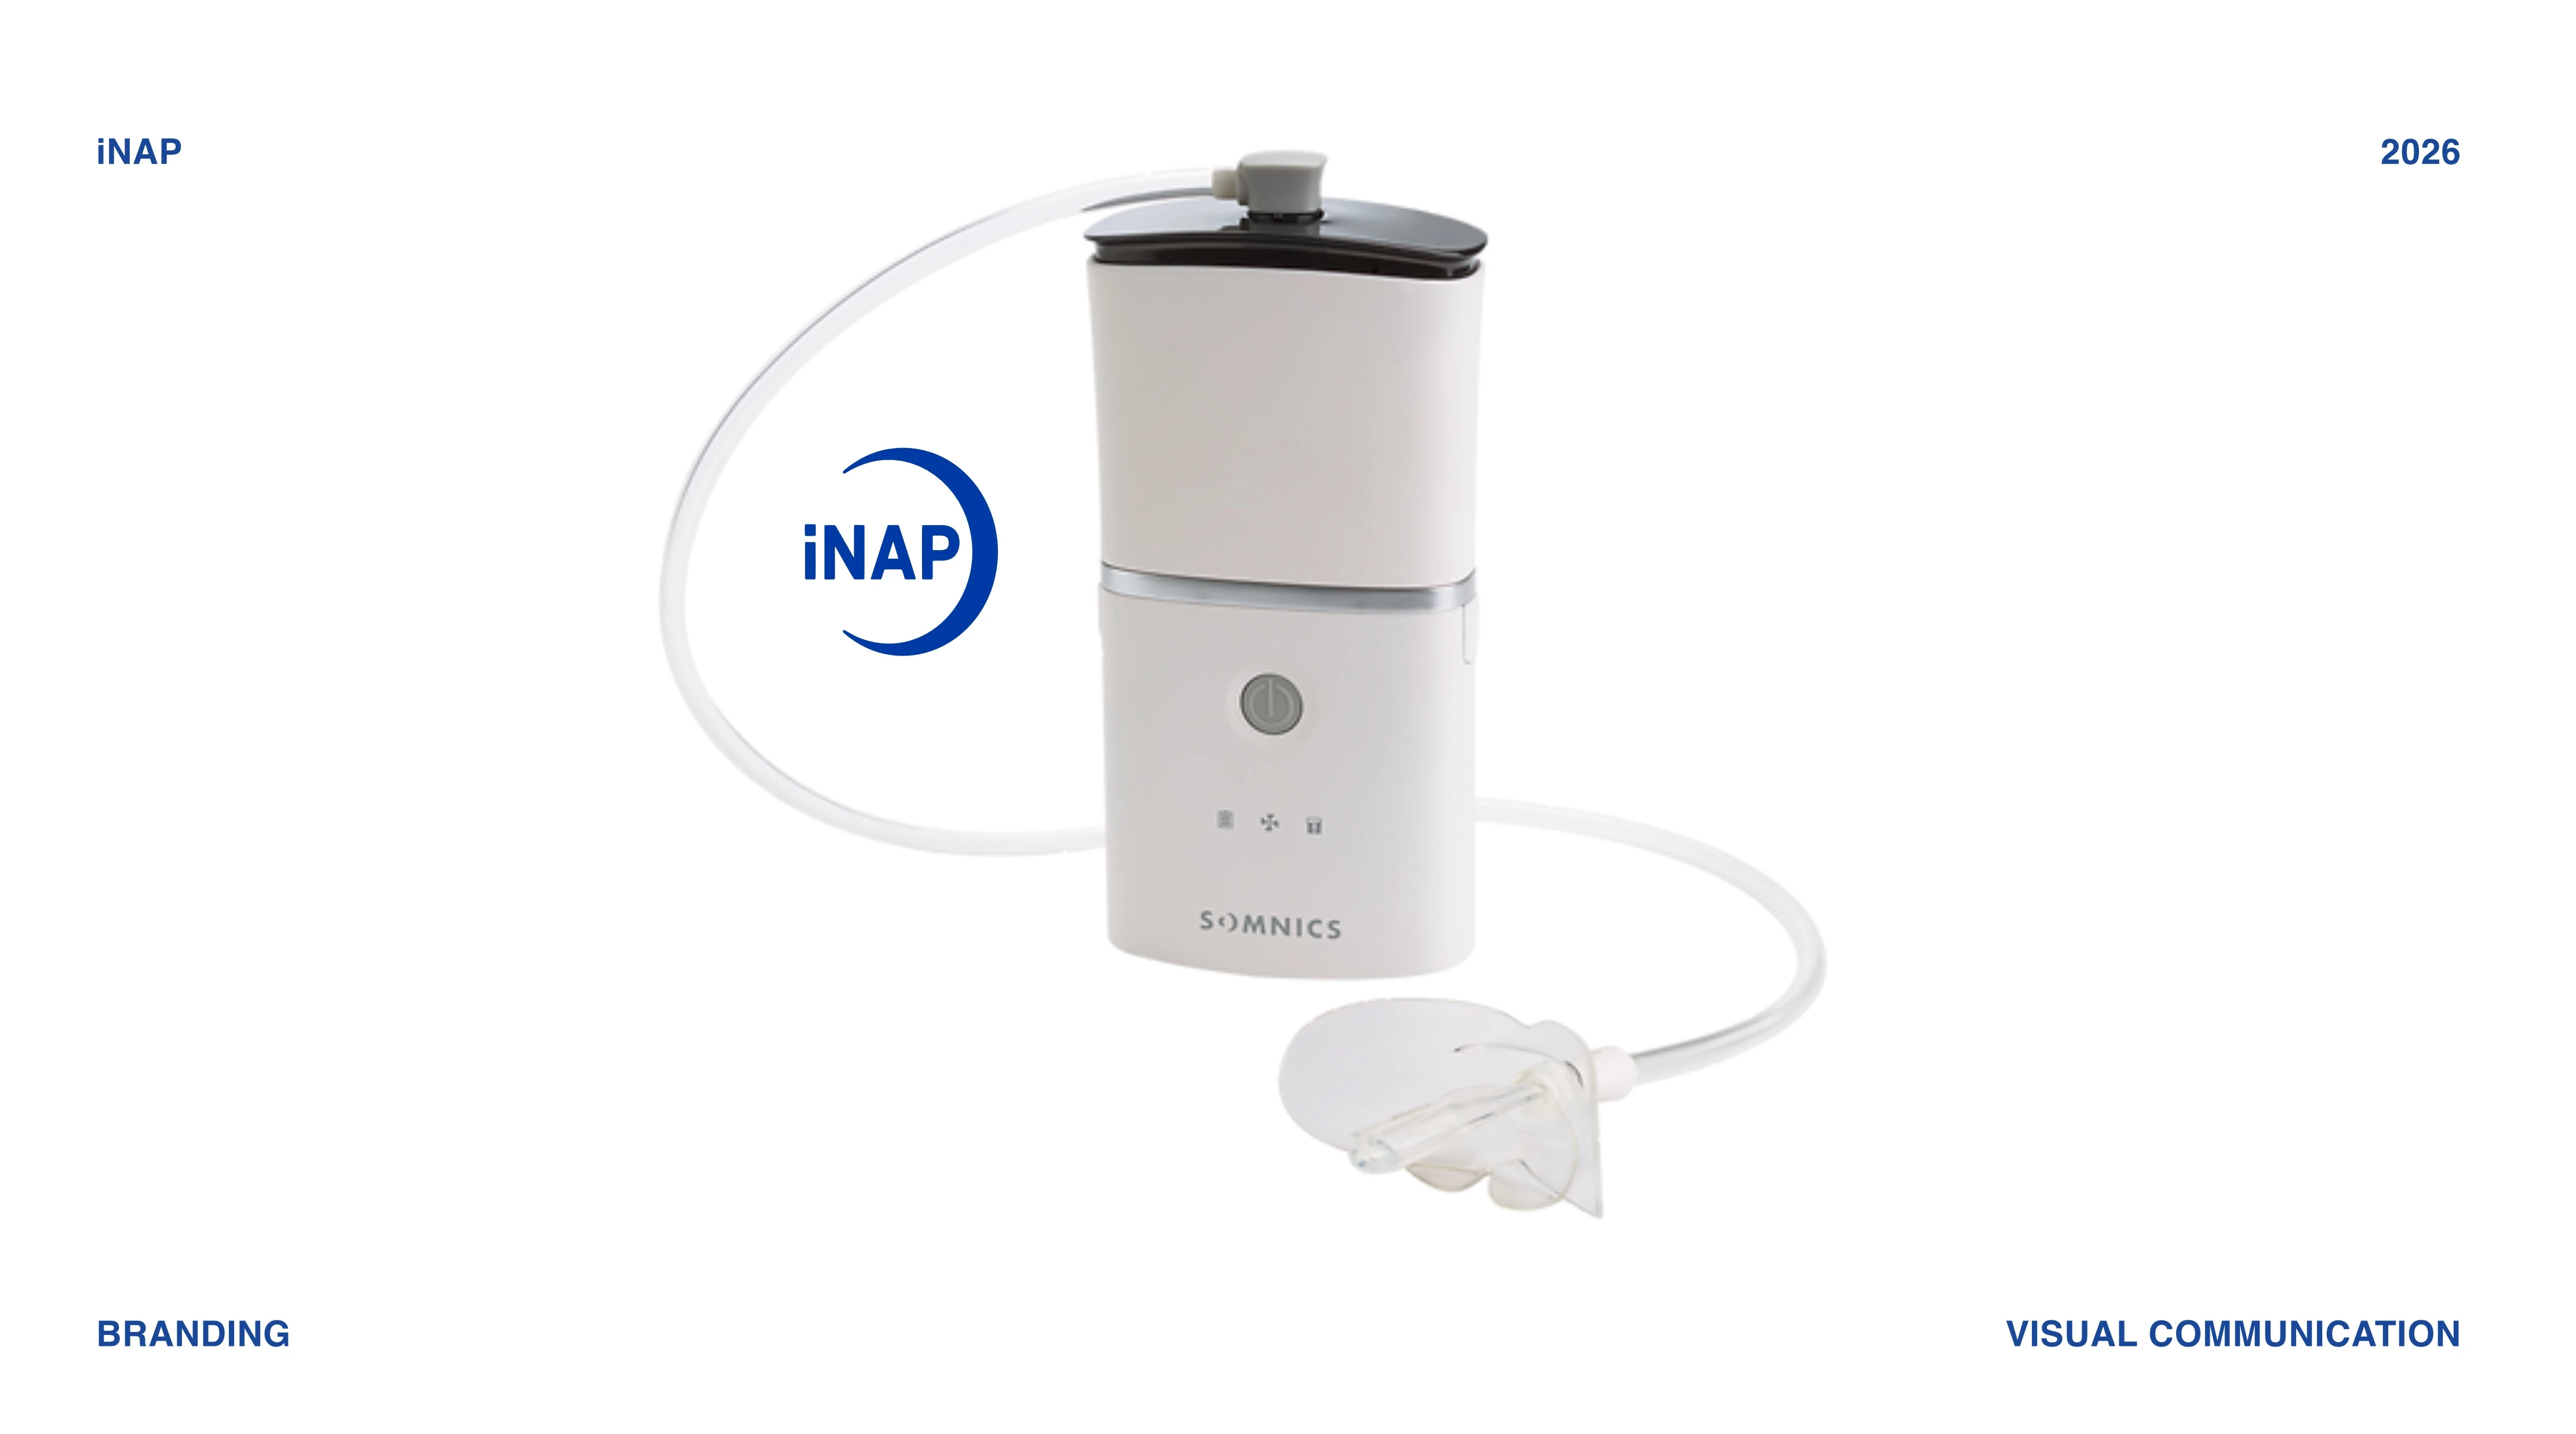
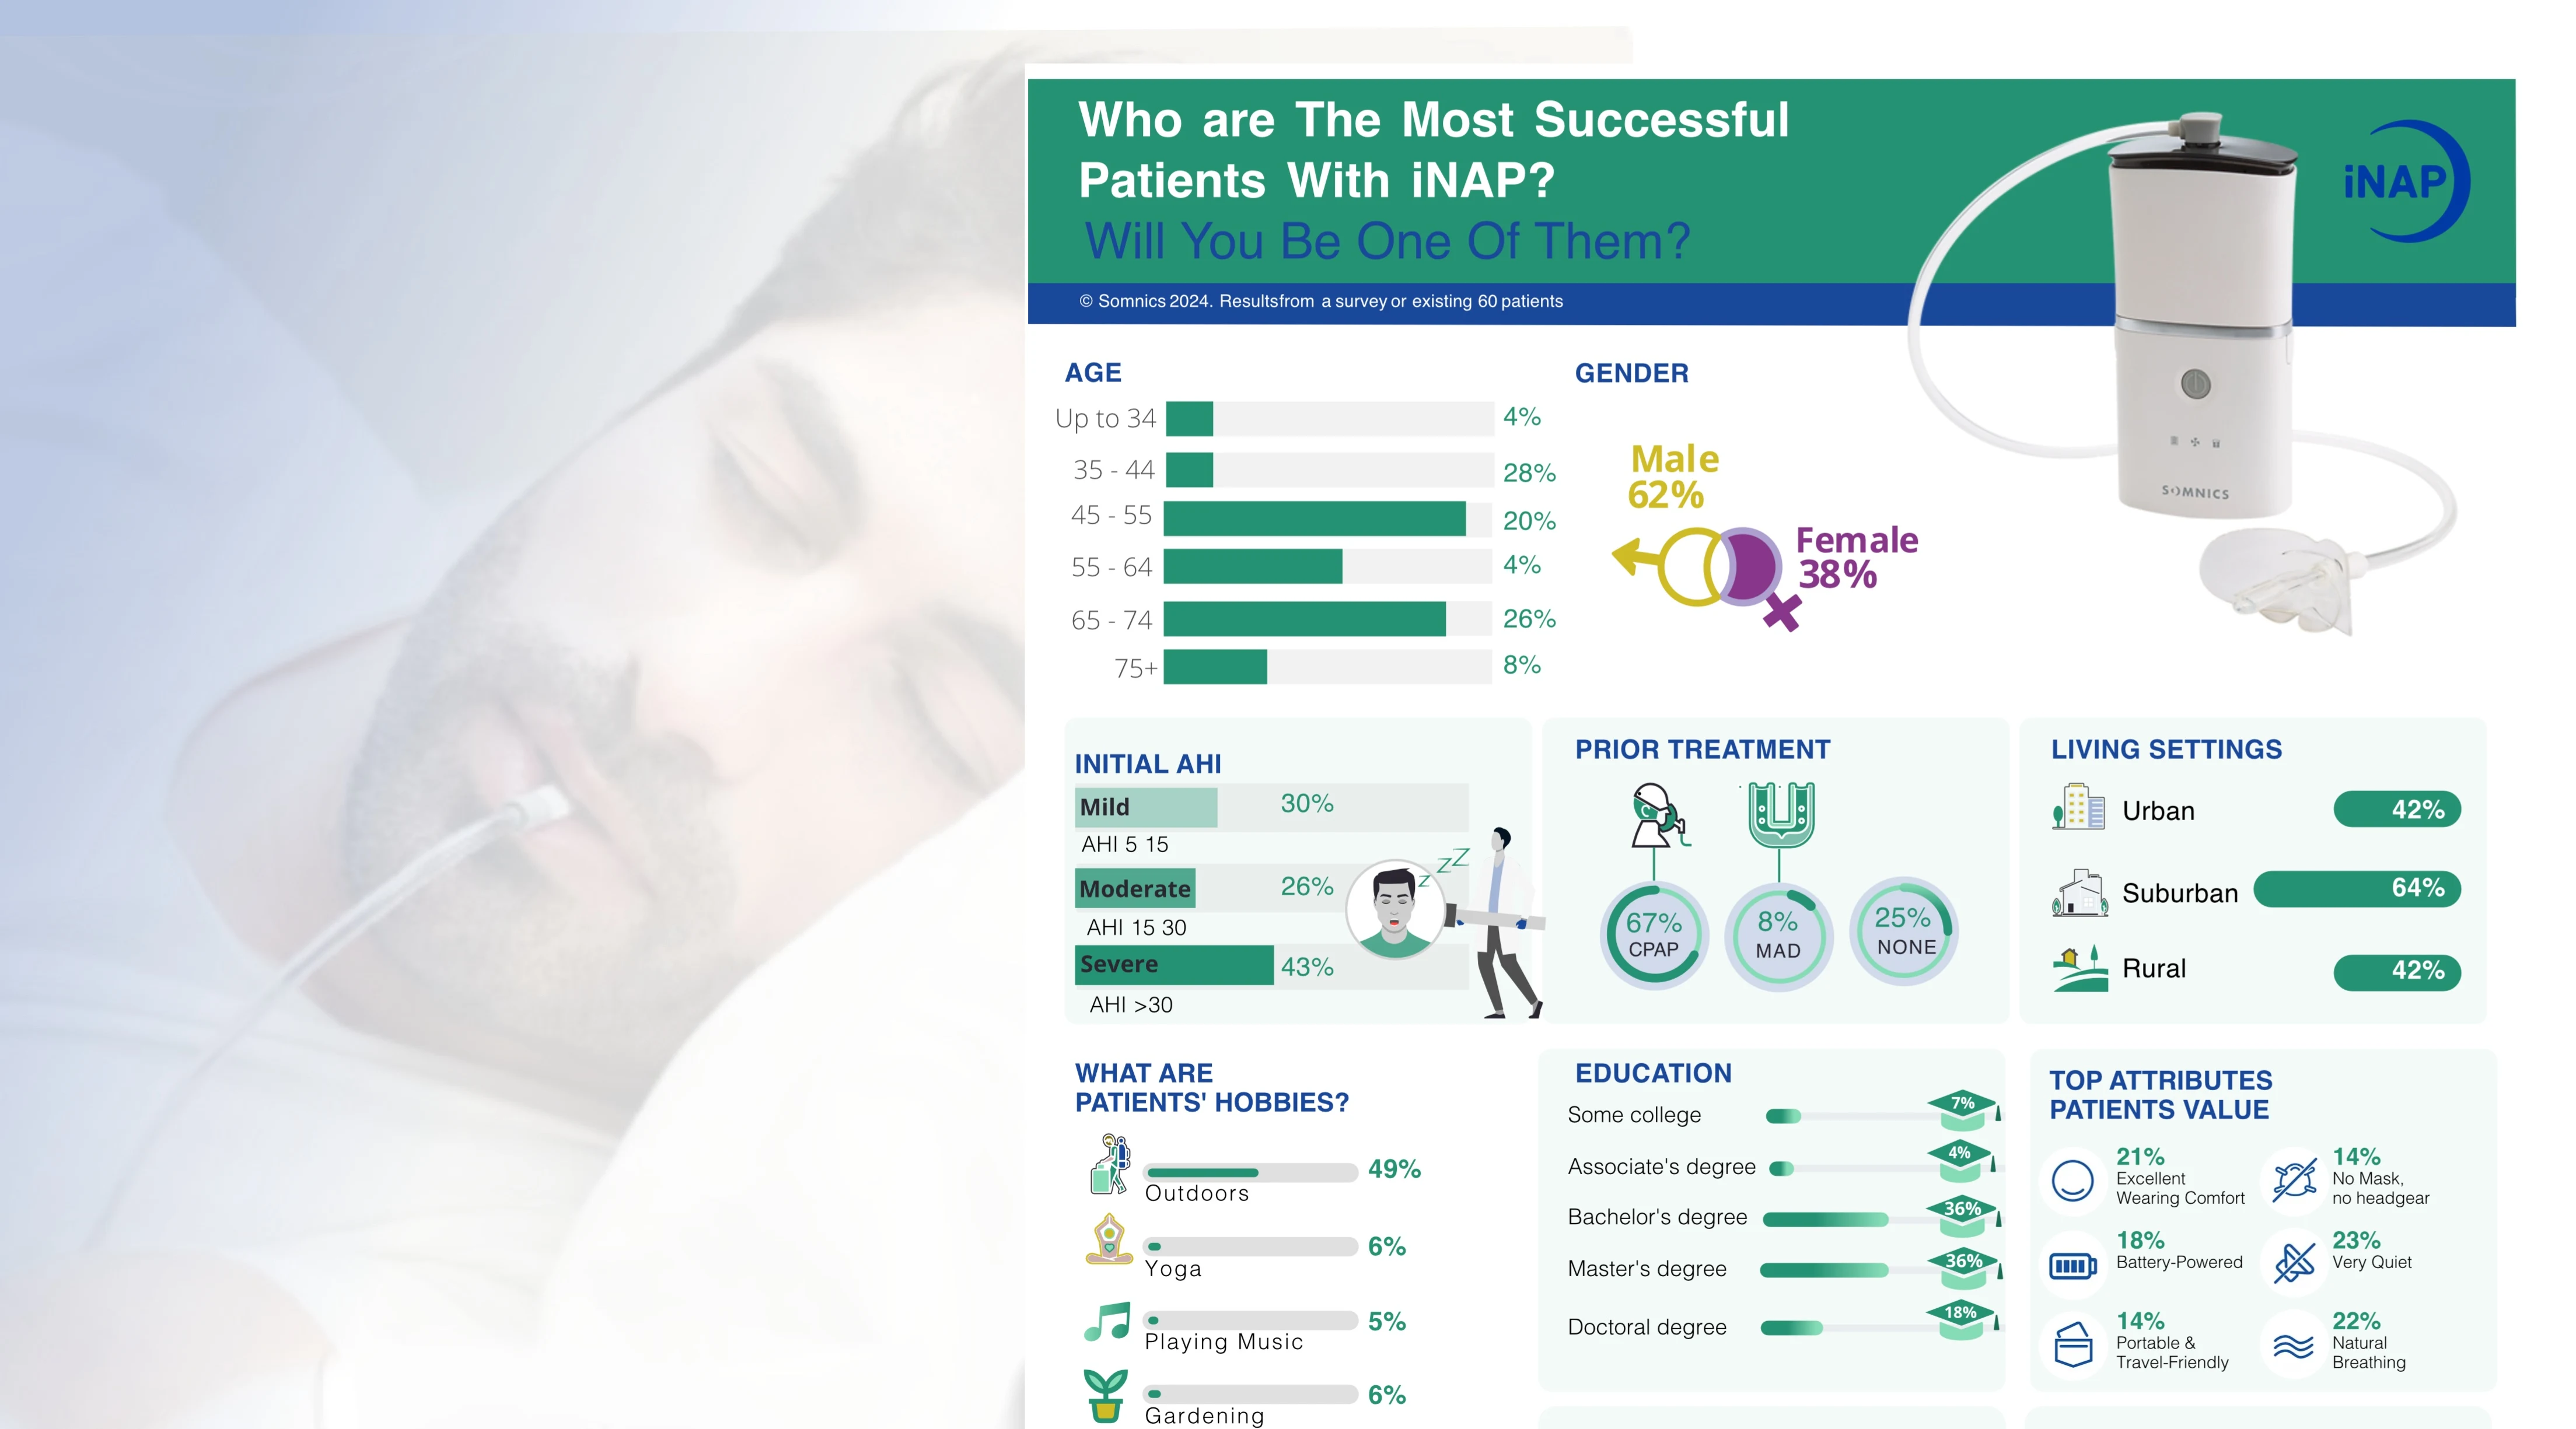
Medical Data, Made Easier to Understand
Medical Data, Made Easier to Understand
A complex medical story brought together through product imagery, patient data, illustrations, and visual information.
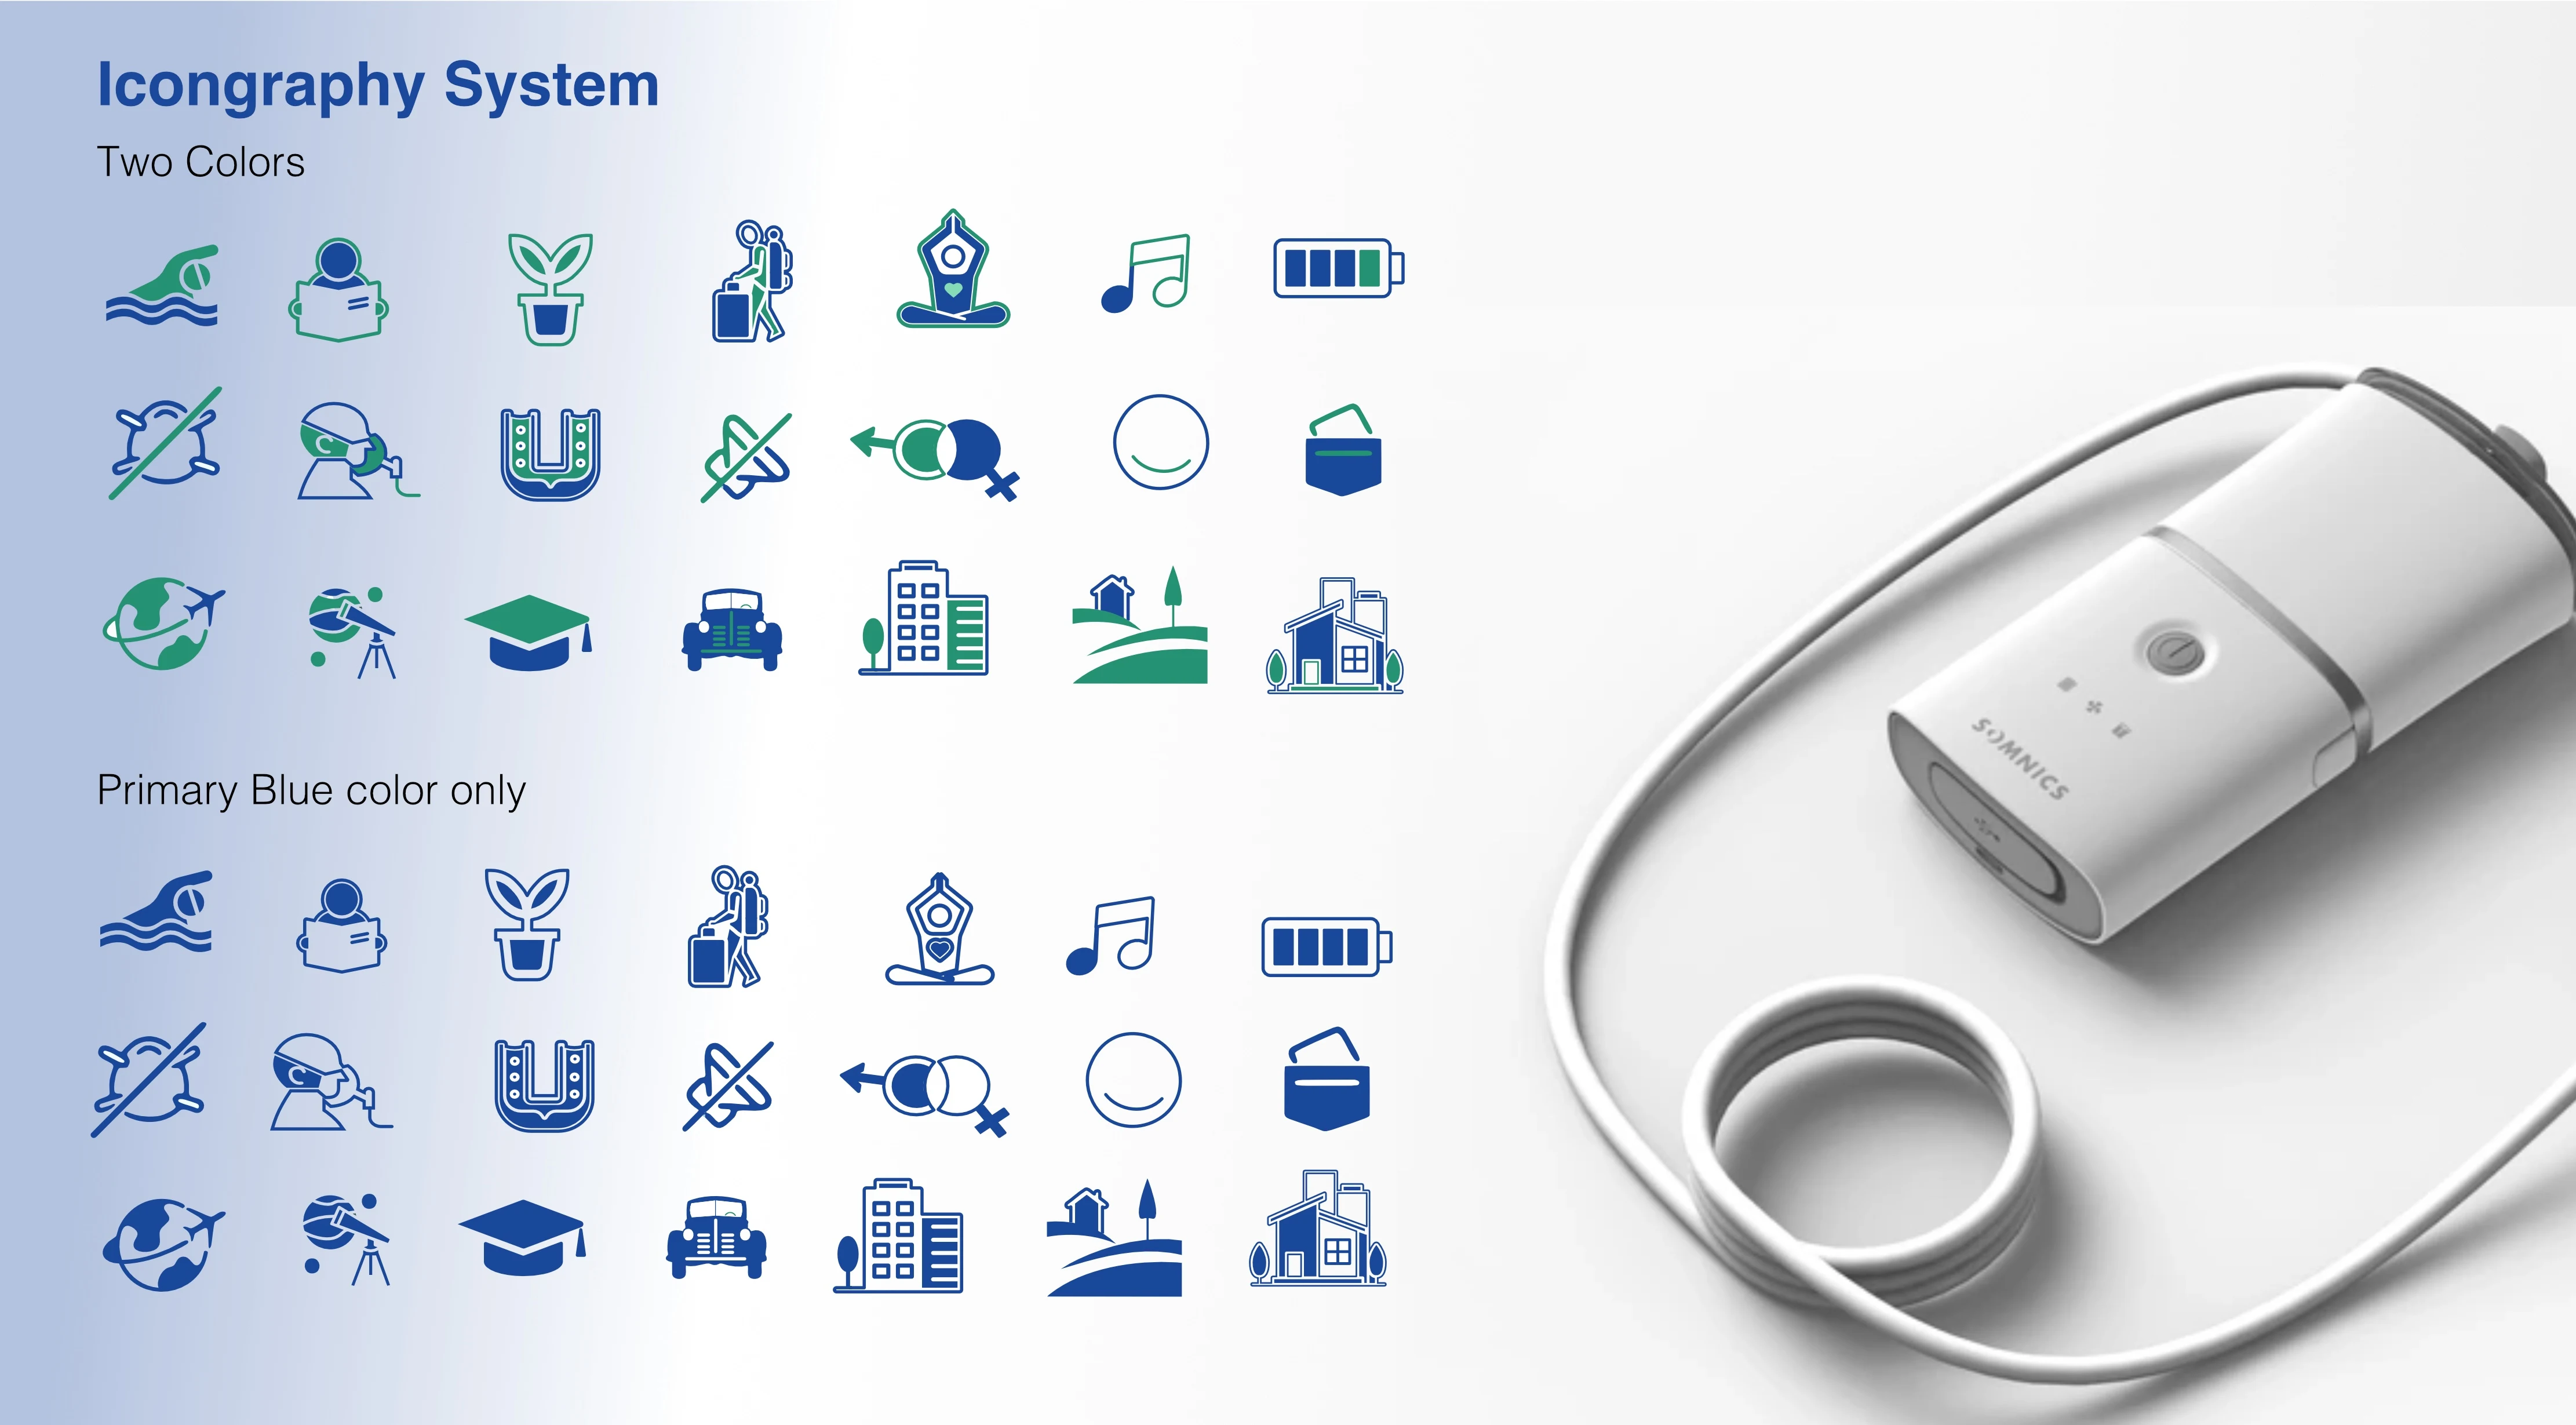
Custom Visual Language
Iconography System
A flexible icon system translates patient characteristics, lifestyle, treatment, and product attributes into a consistent visual language.

Sleep Duration
Making Statistics More Visual
Complex sleep data becomes an easy-to-read visual story through scale, color, hierarchy, and supporting illustration.
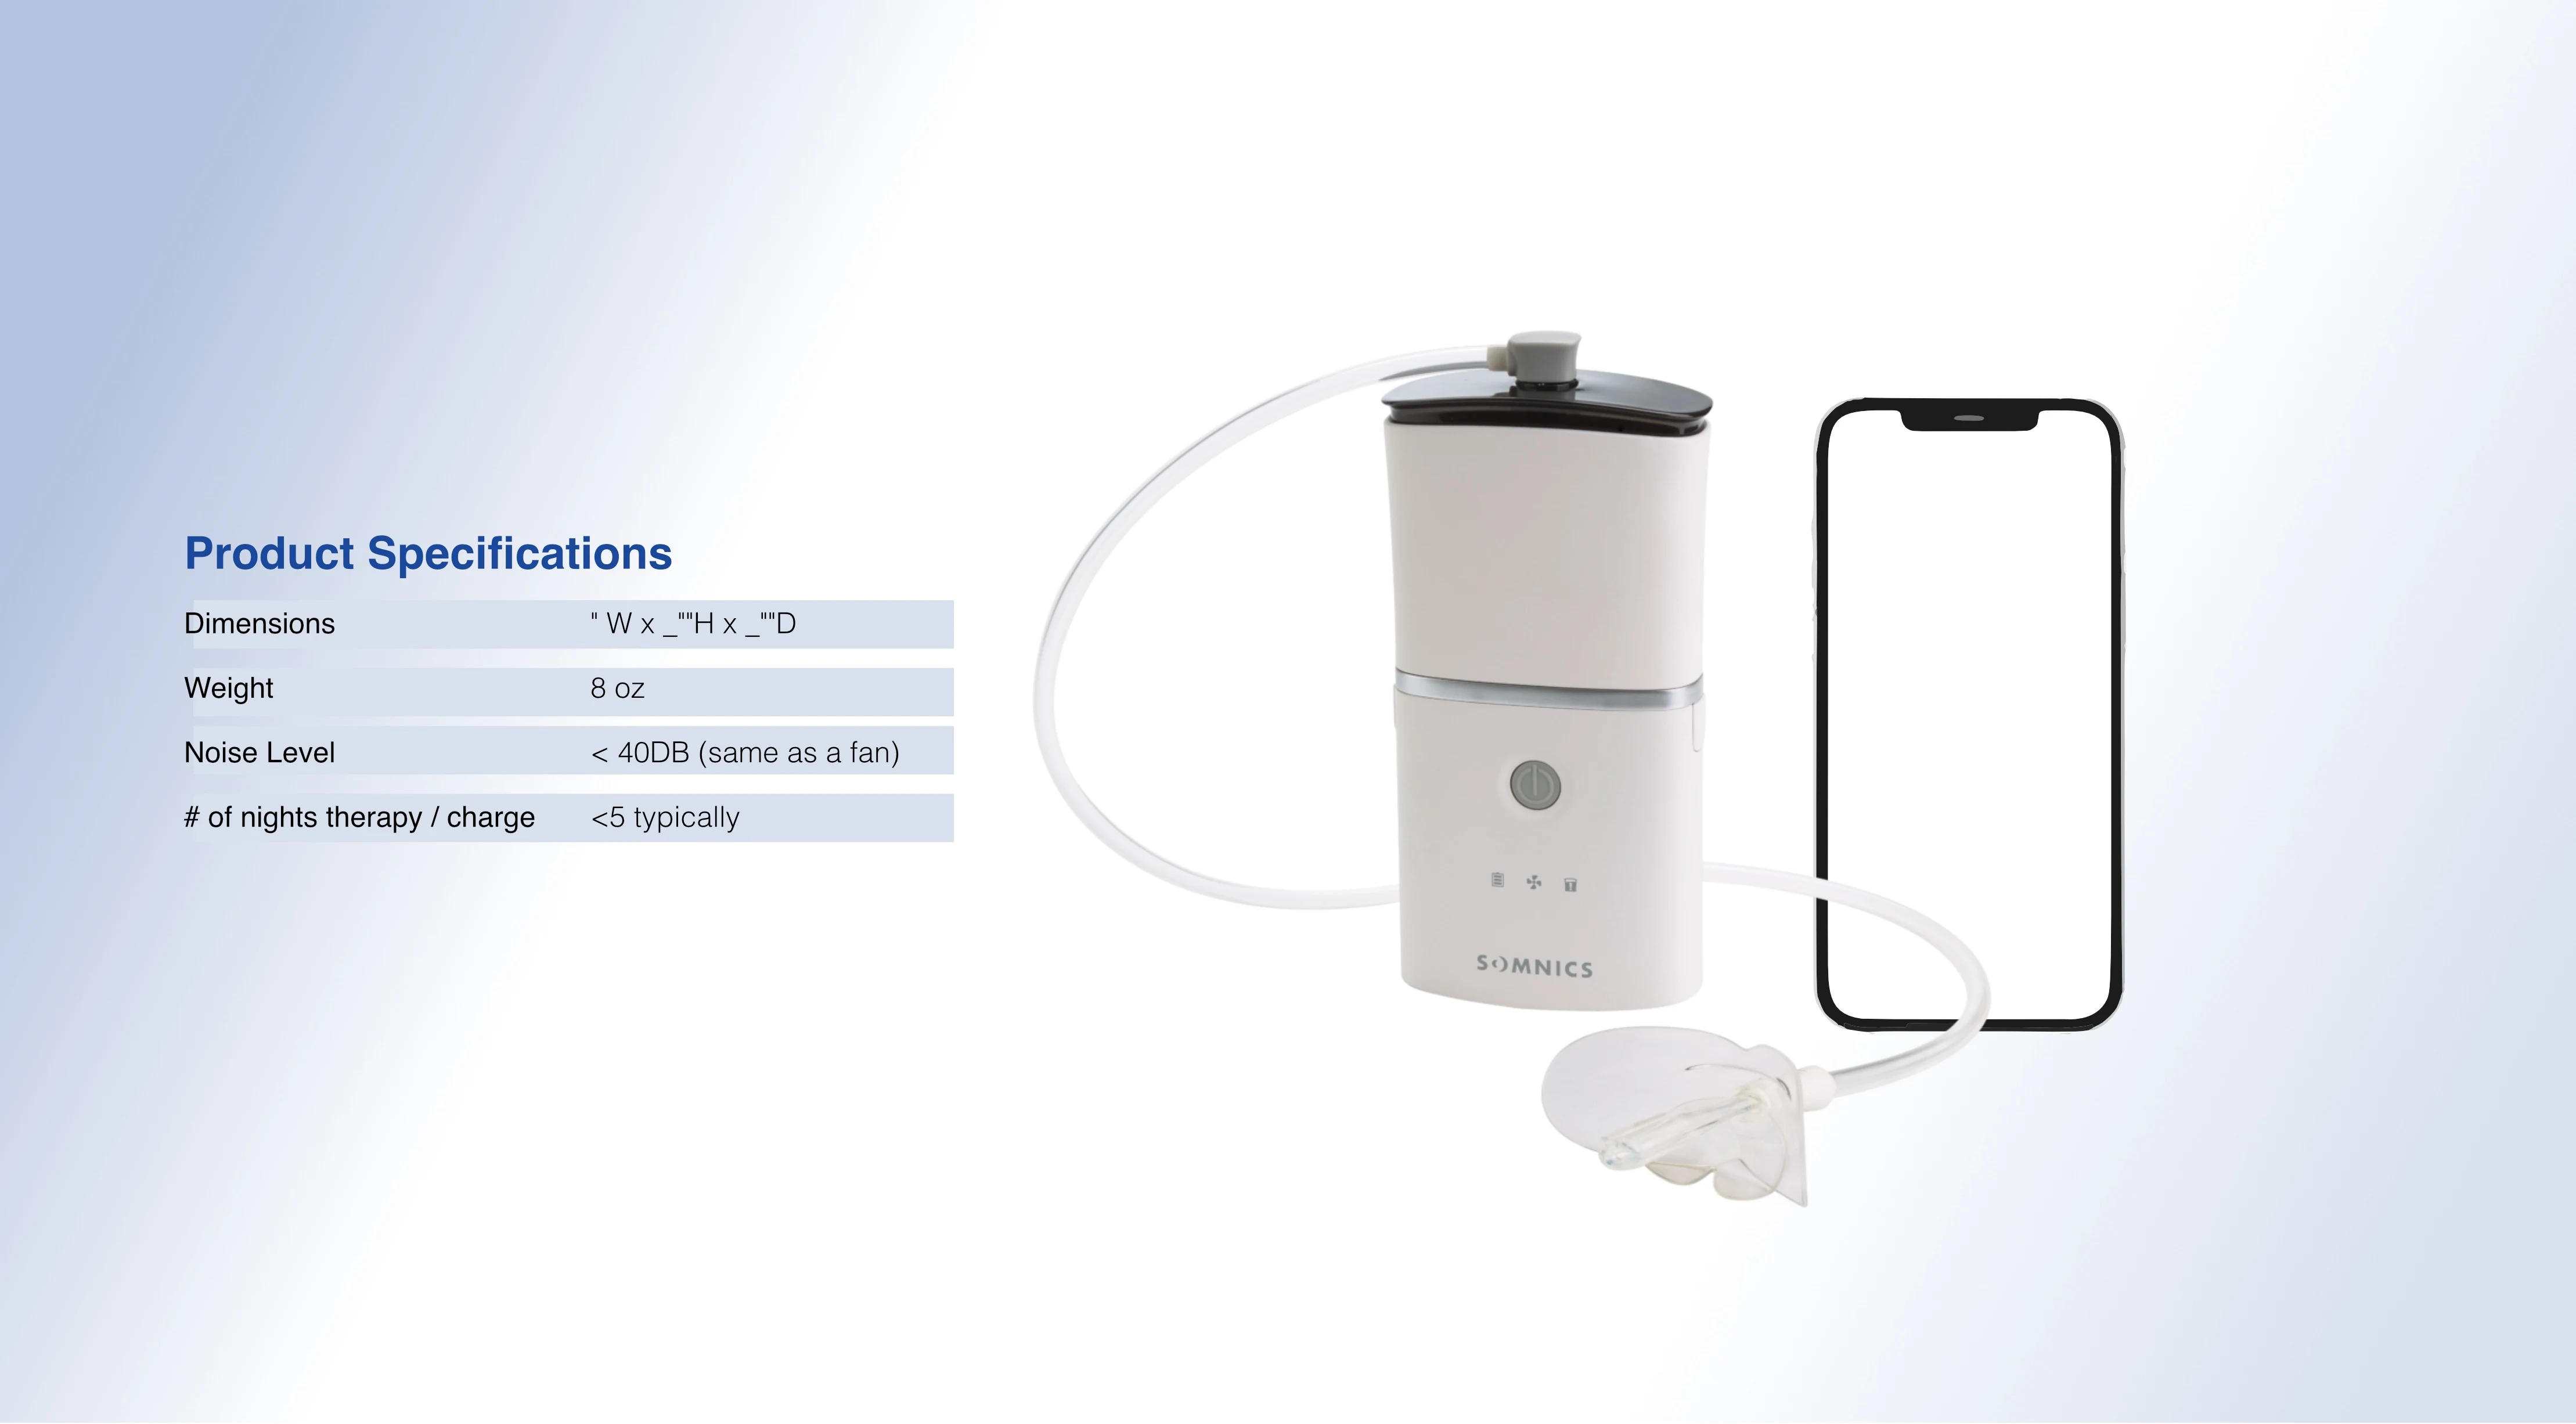
Product Specs
Product Information, Simplified
Organize technical specifications alongside product imagery to create a cleaner, more accessible product story.

Initial AHI Data
Turning Clinical Data Into Visual Information
Pair clinical data with illustration and hierarchy to make patient information easier to understand without overwhelming the viewer.
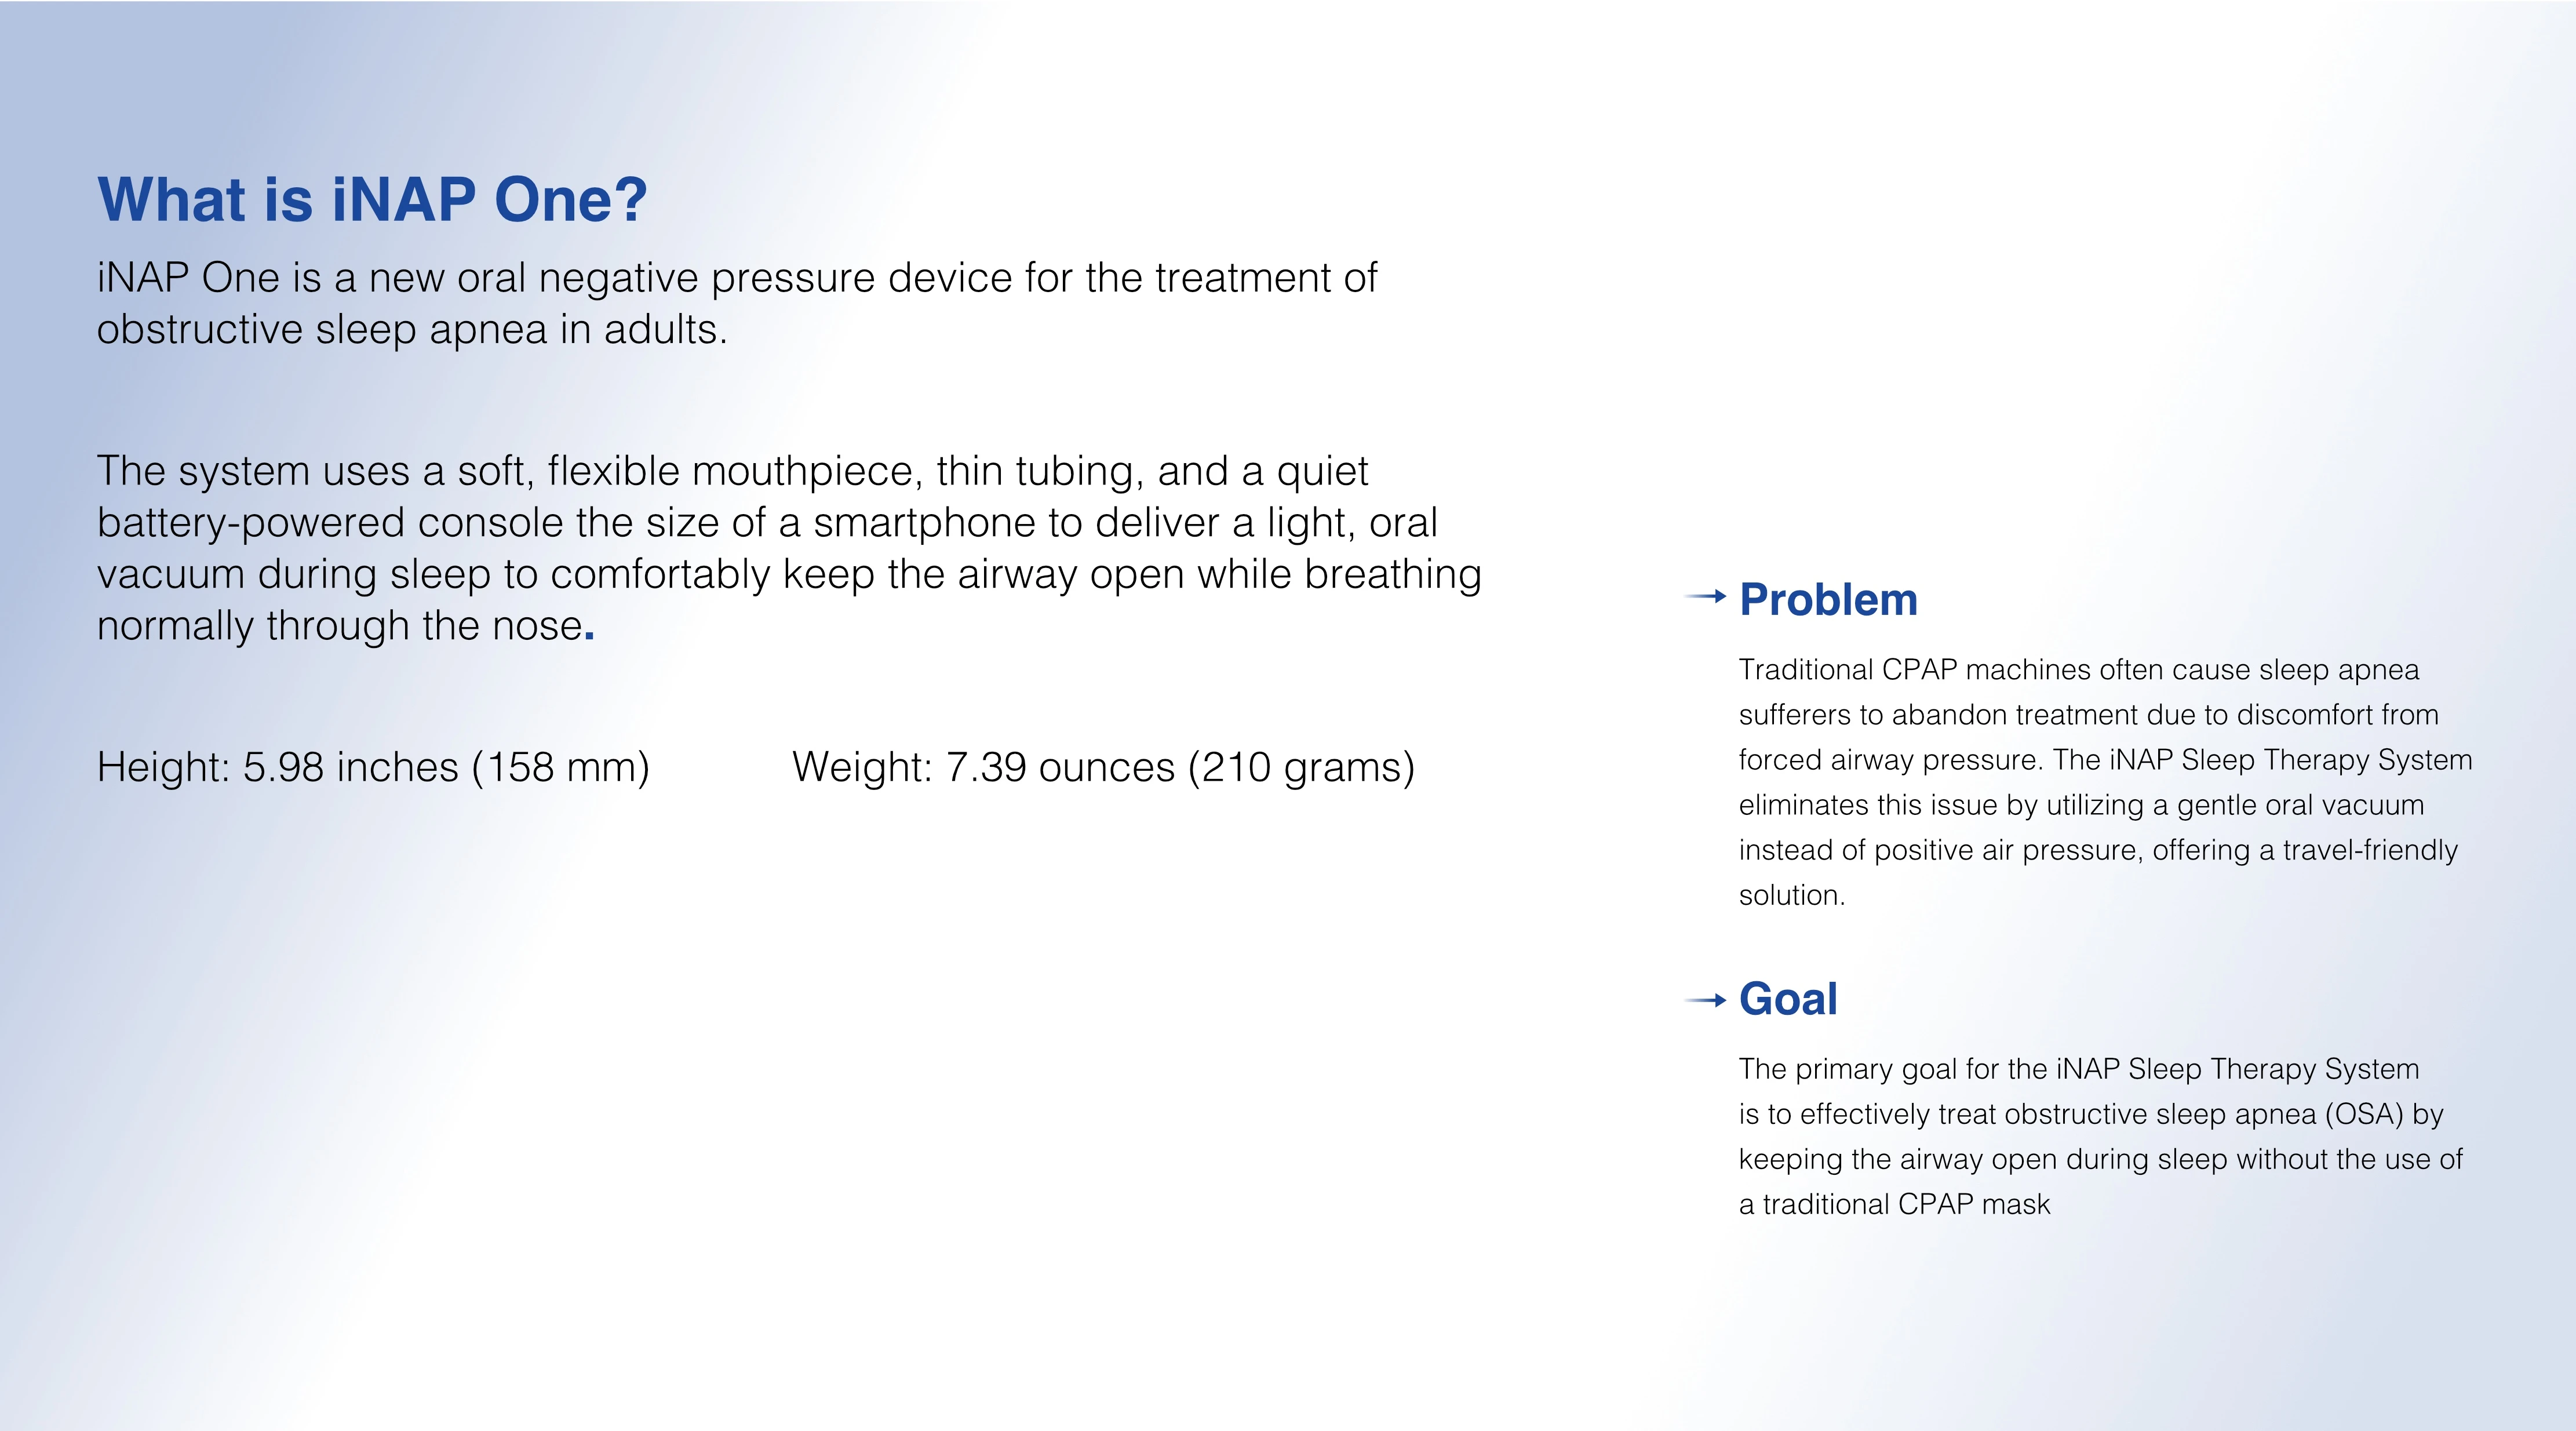
Complex Product, Clear Story
Complex Product, Clear Story
Product information is structured around the problem, the solution, and the goal—giving the reader a clear understanding of how iNAP works.
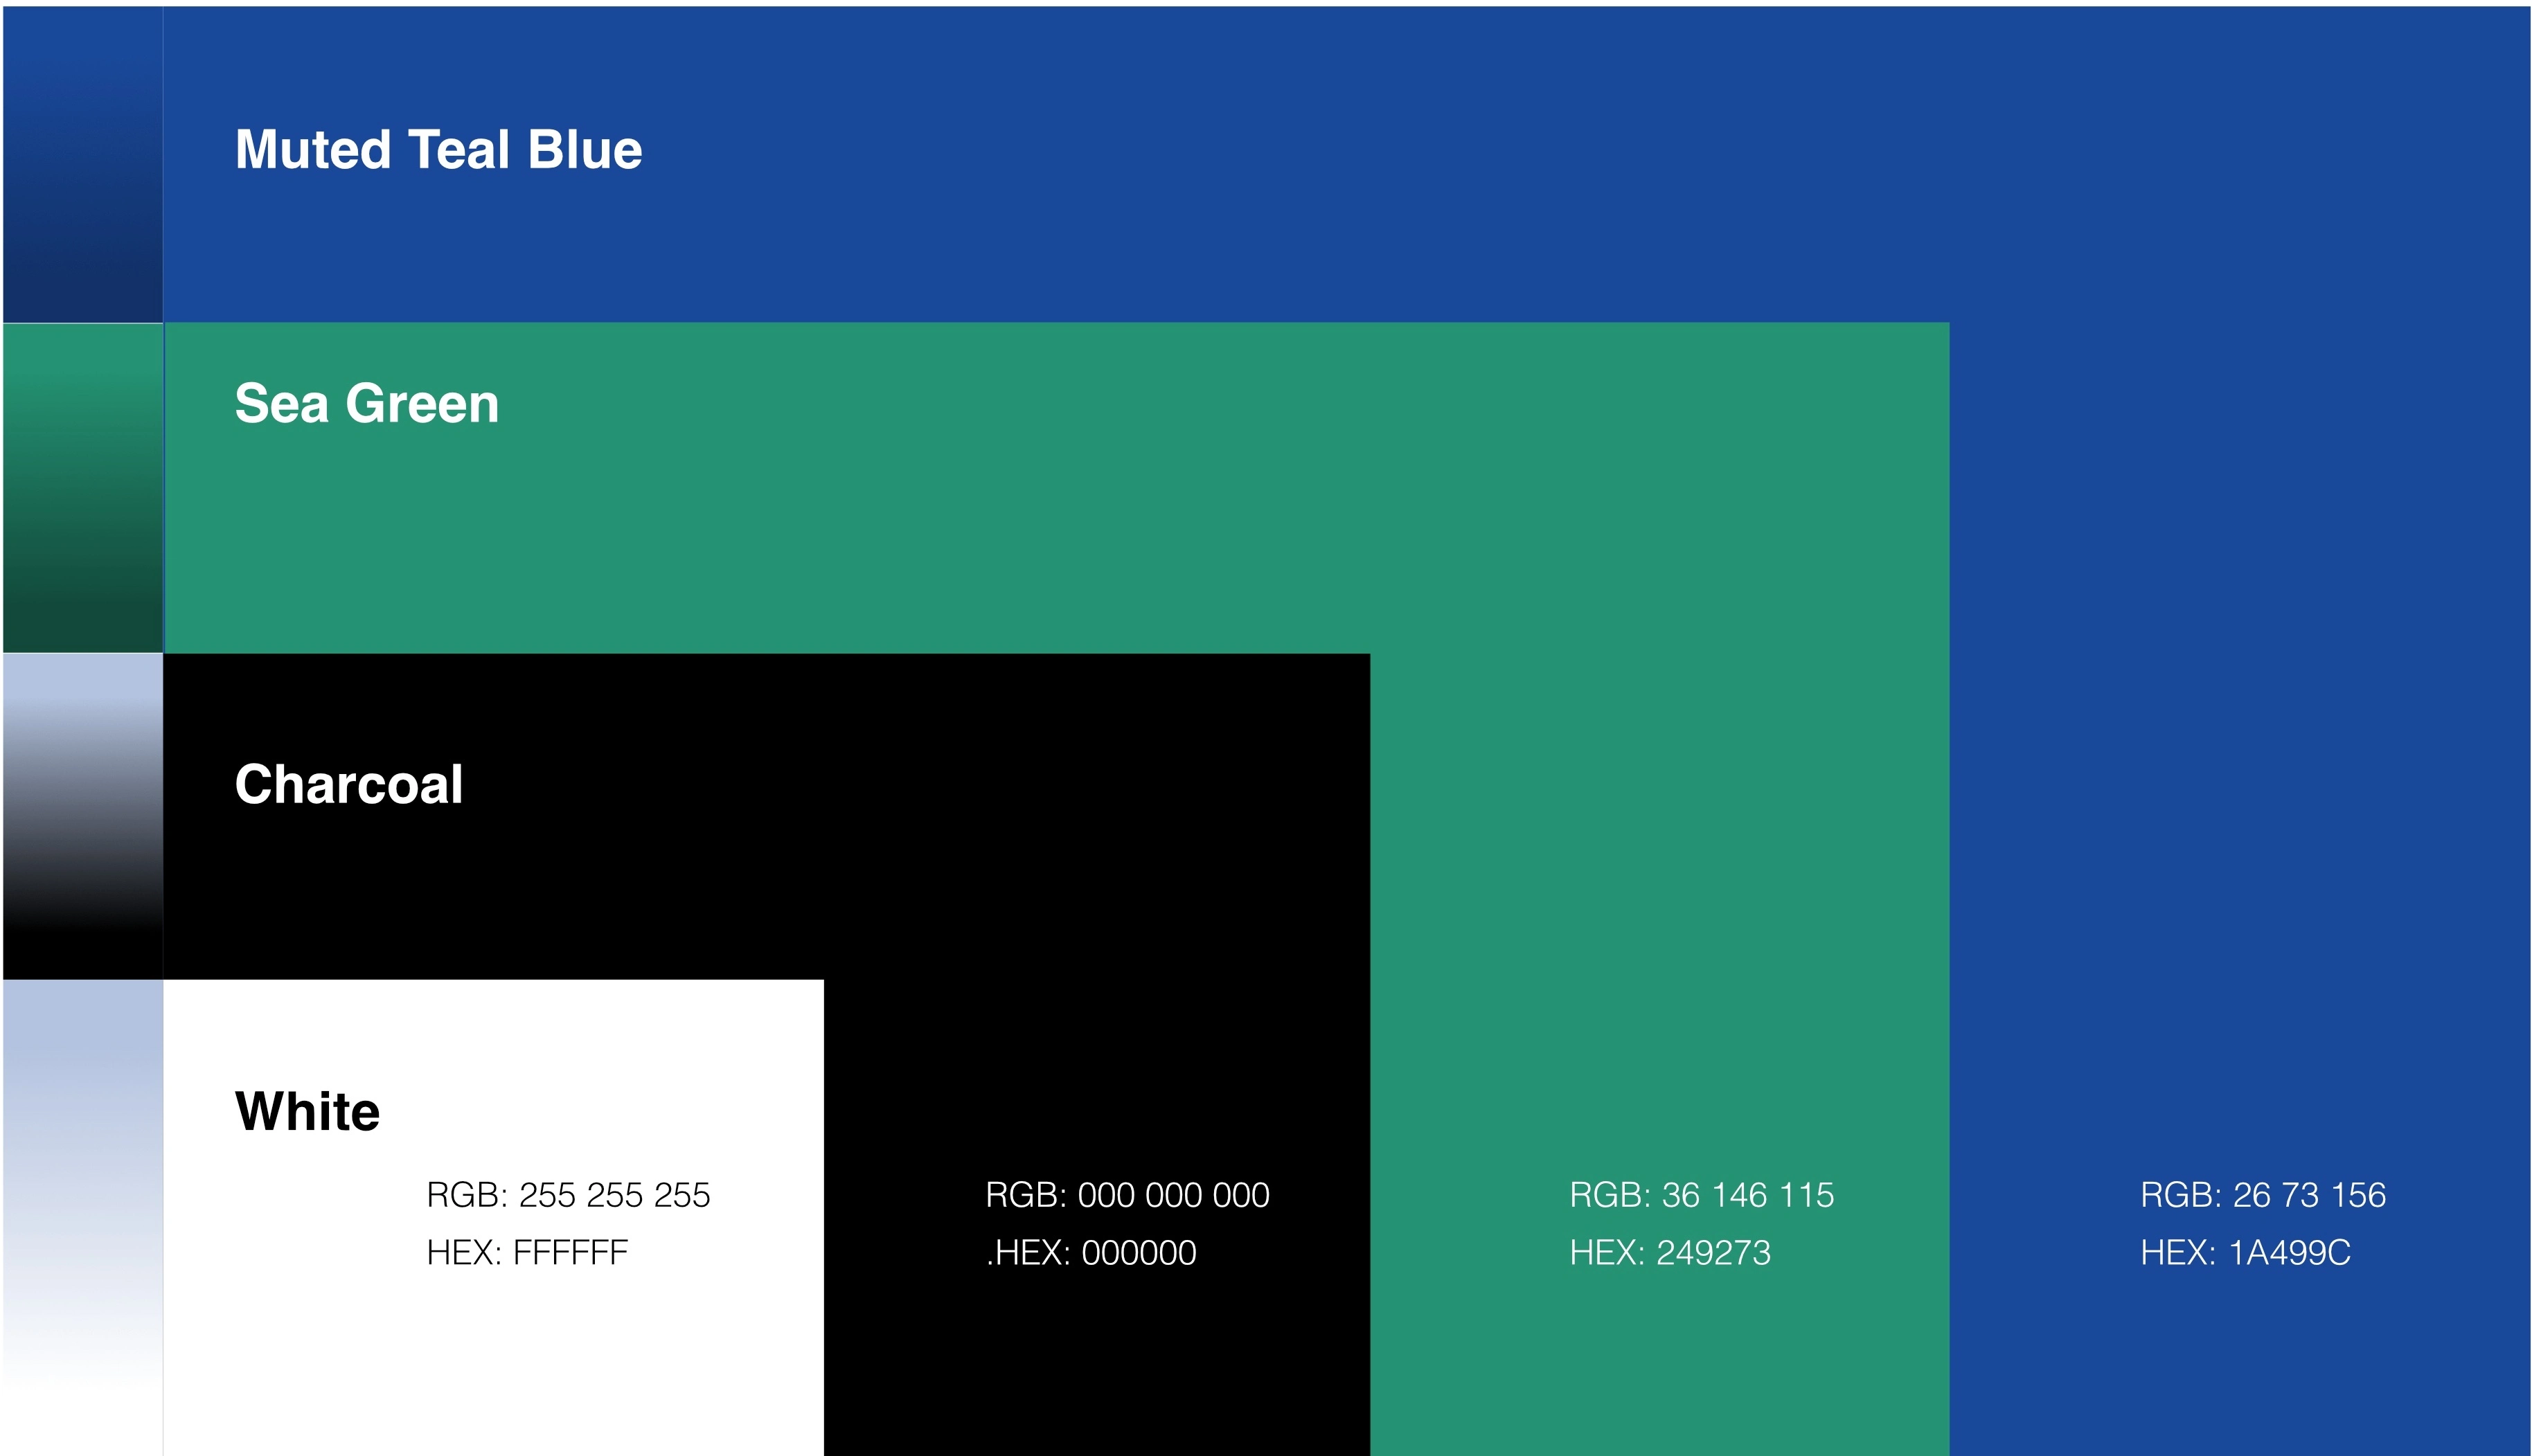
Brand colors
A Focused Color System
A restrained palette of blue, teal, charcoal, and white creates a clean, modern visual foundation for the iNAP brand.
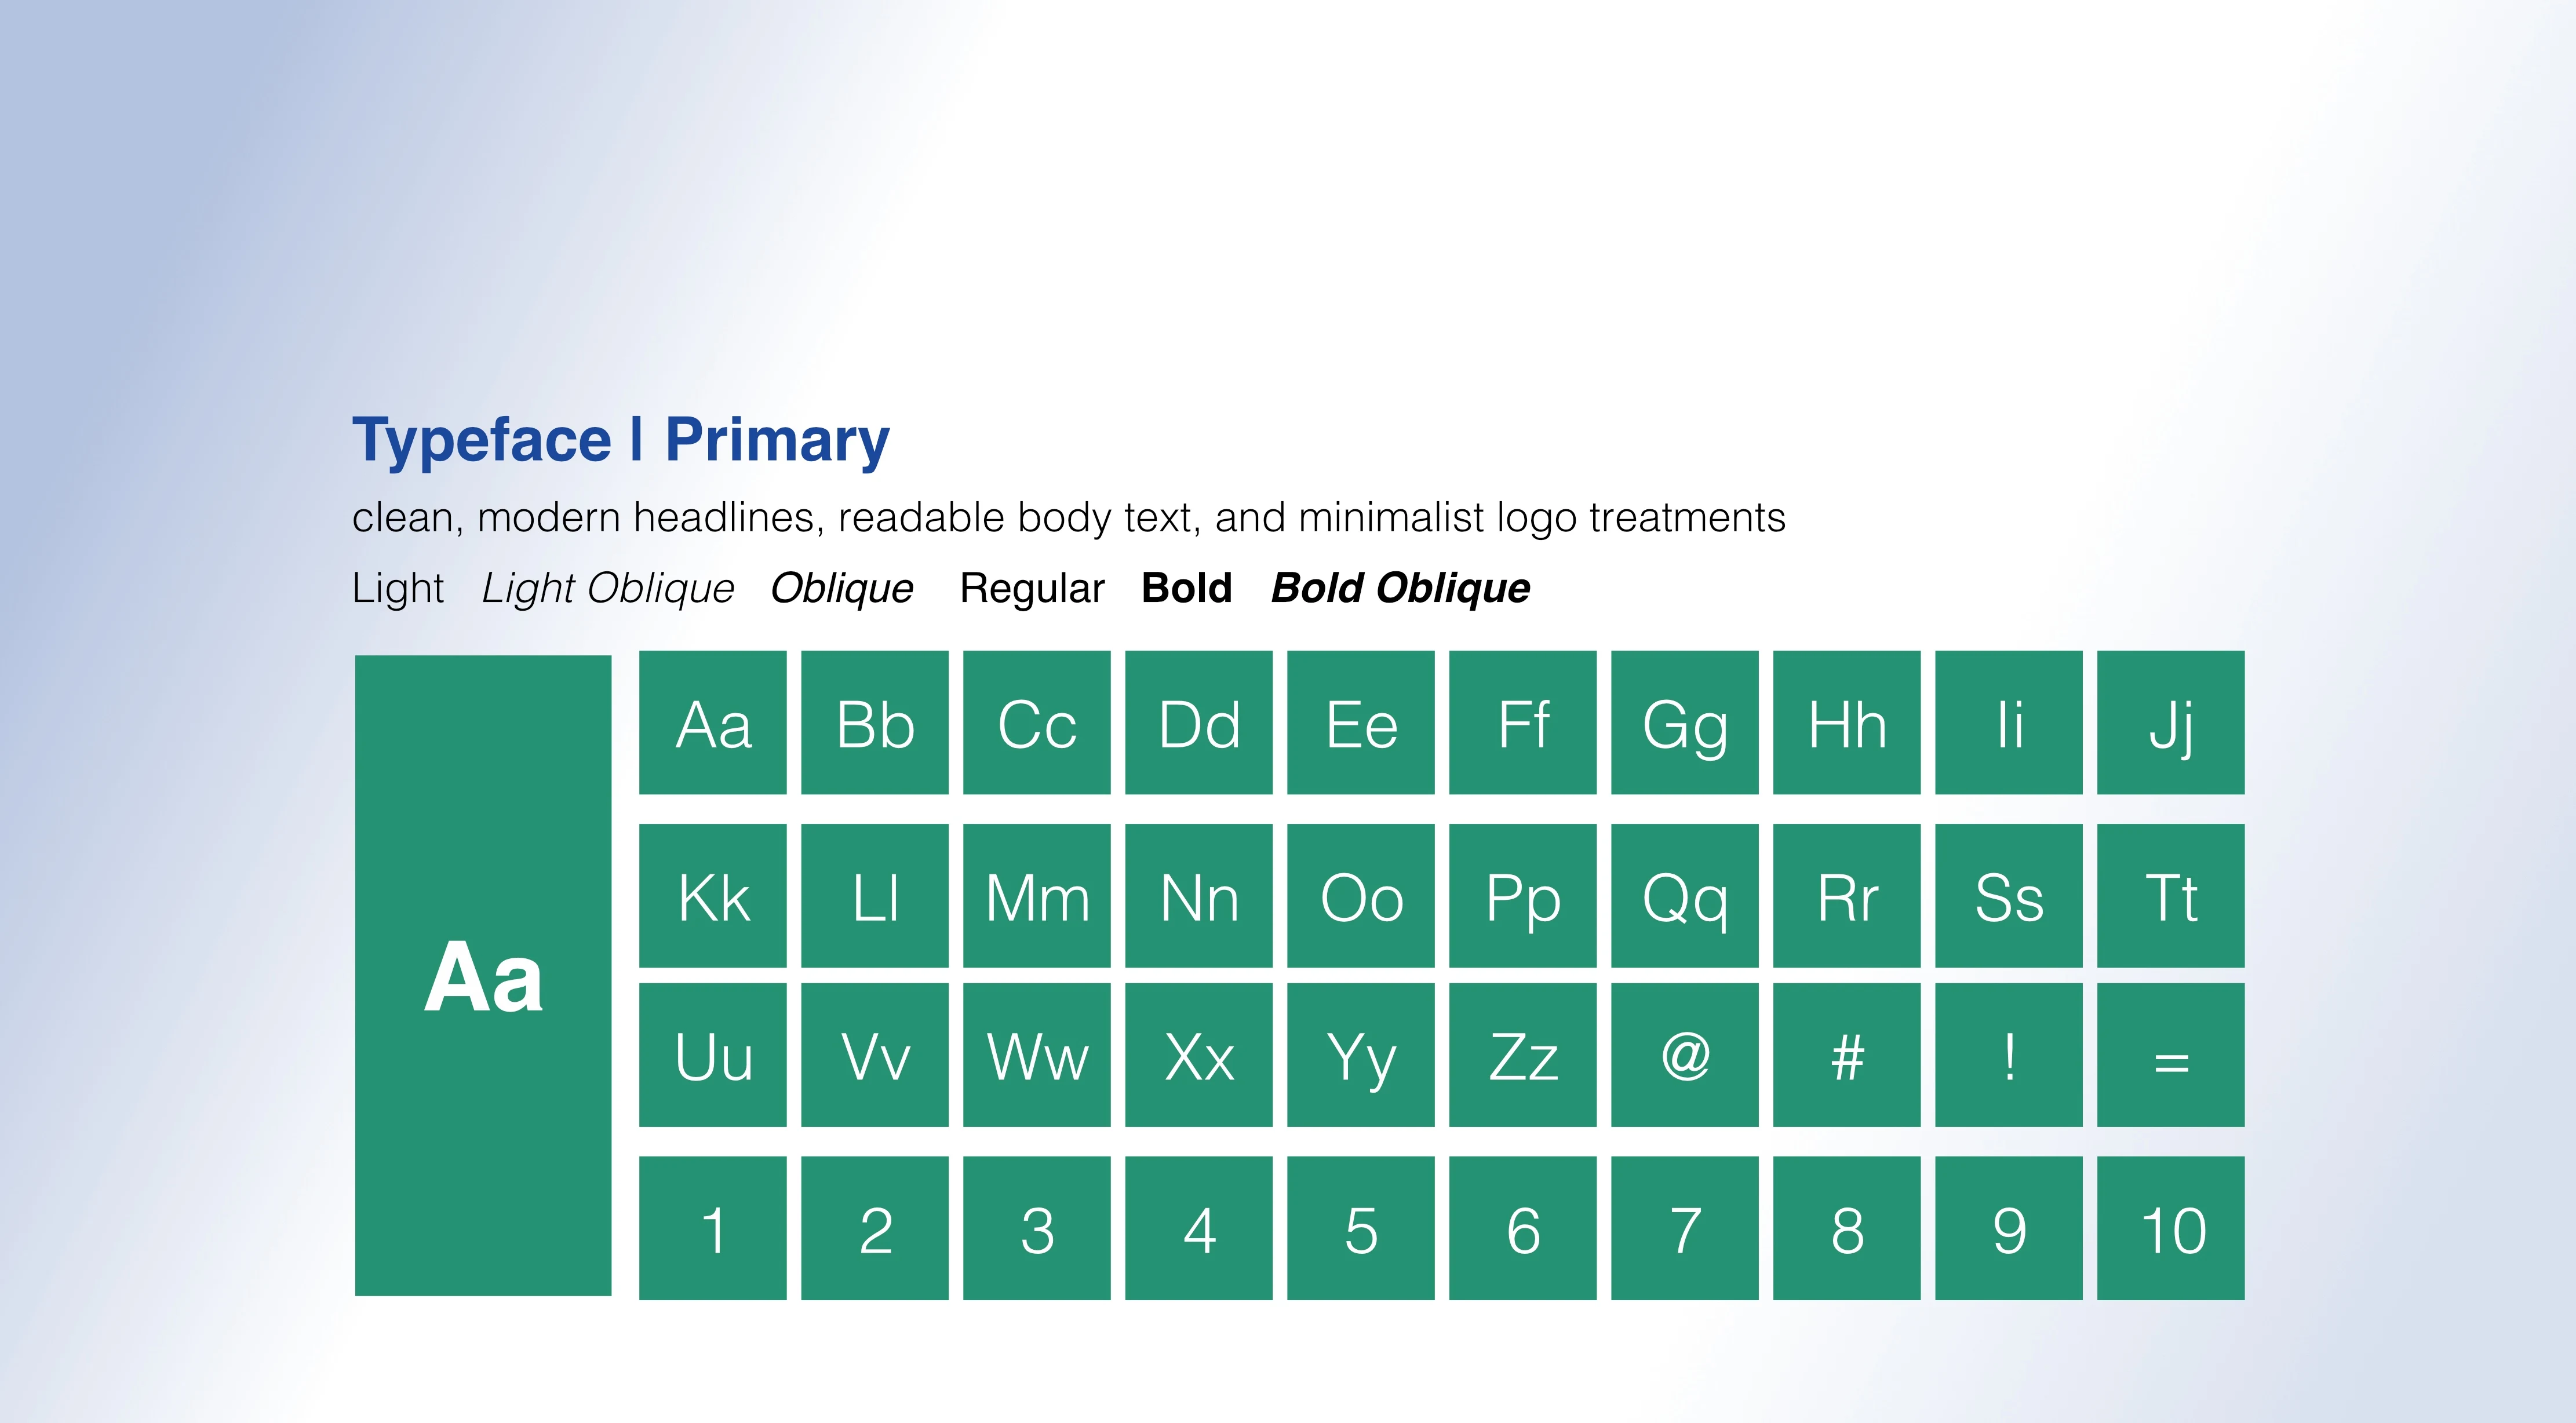
Typography Built for Clarity
Typography Built for Clarity
A clean type system creates consistency across headlines, body copy, technical information, and brand communications.
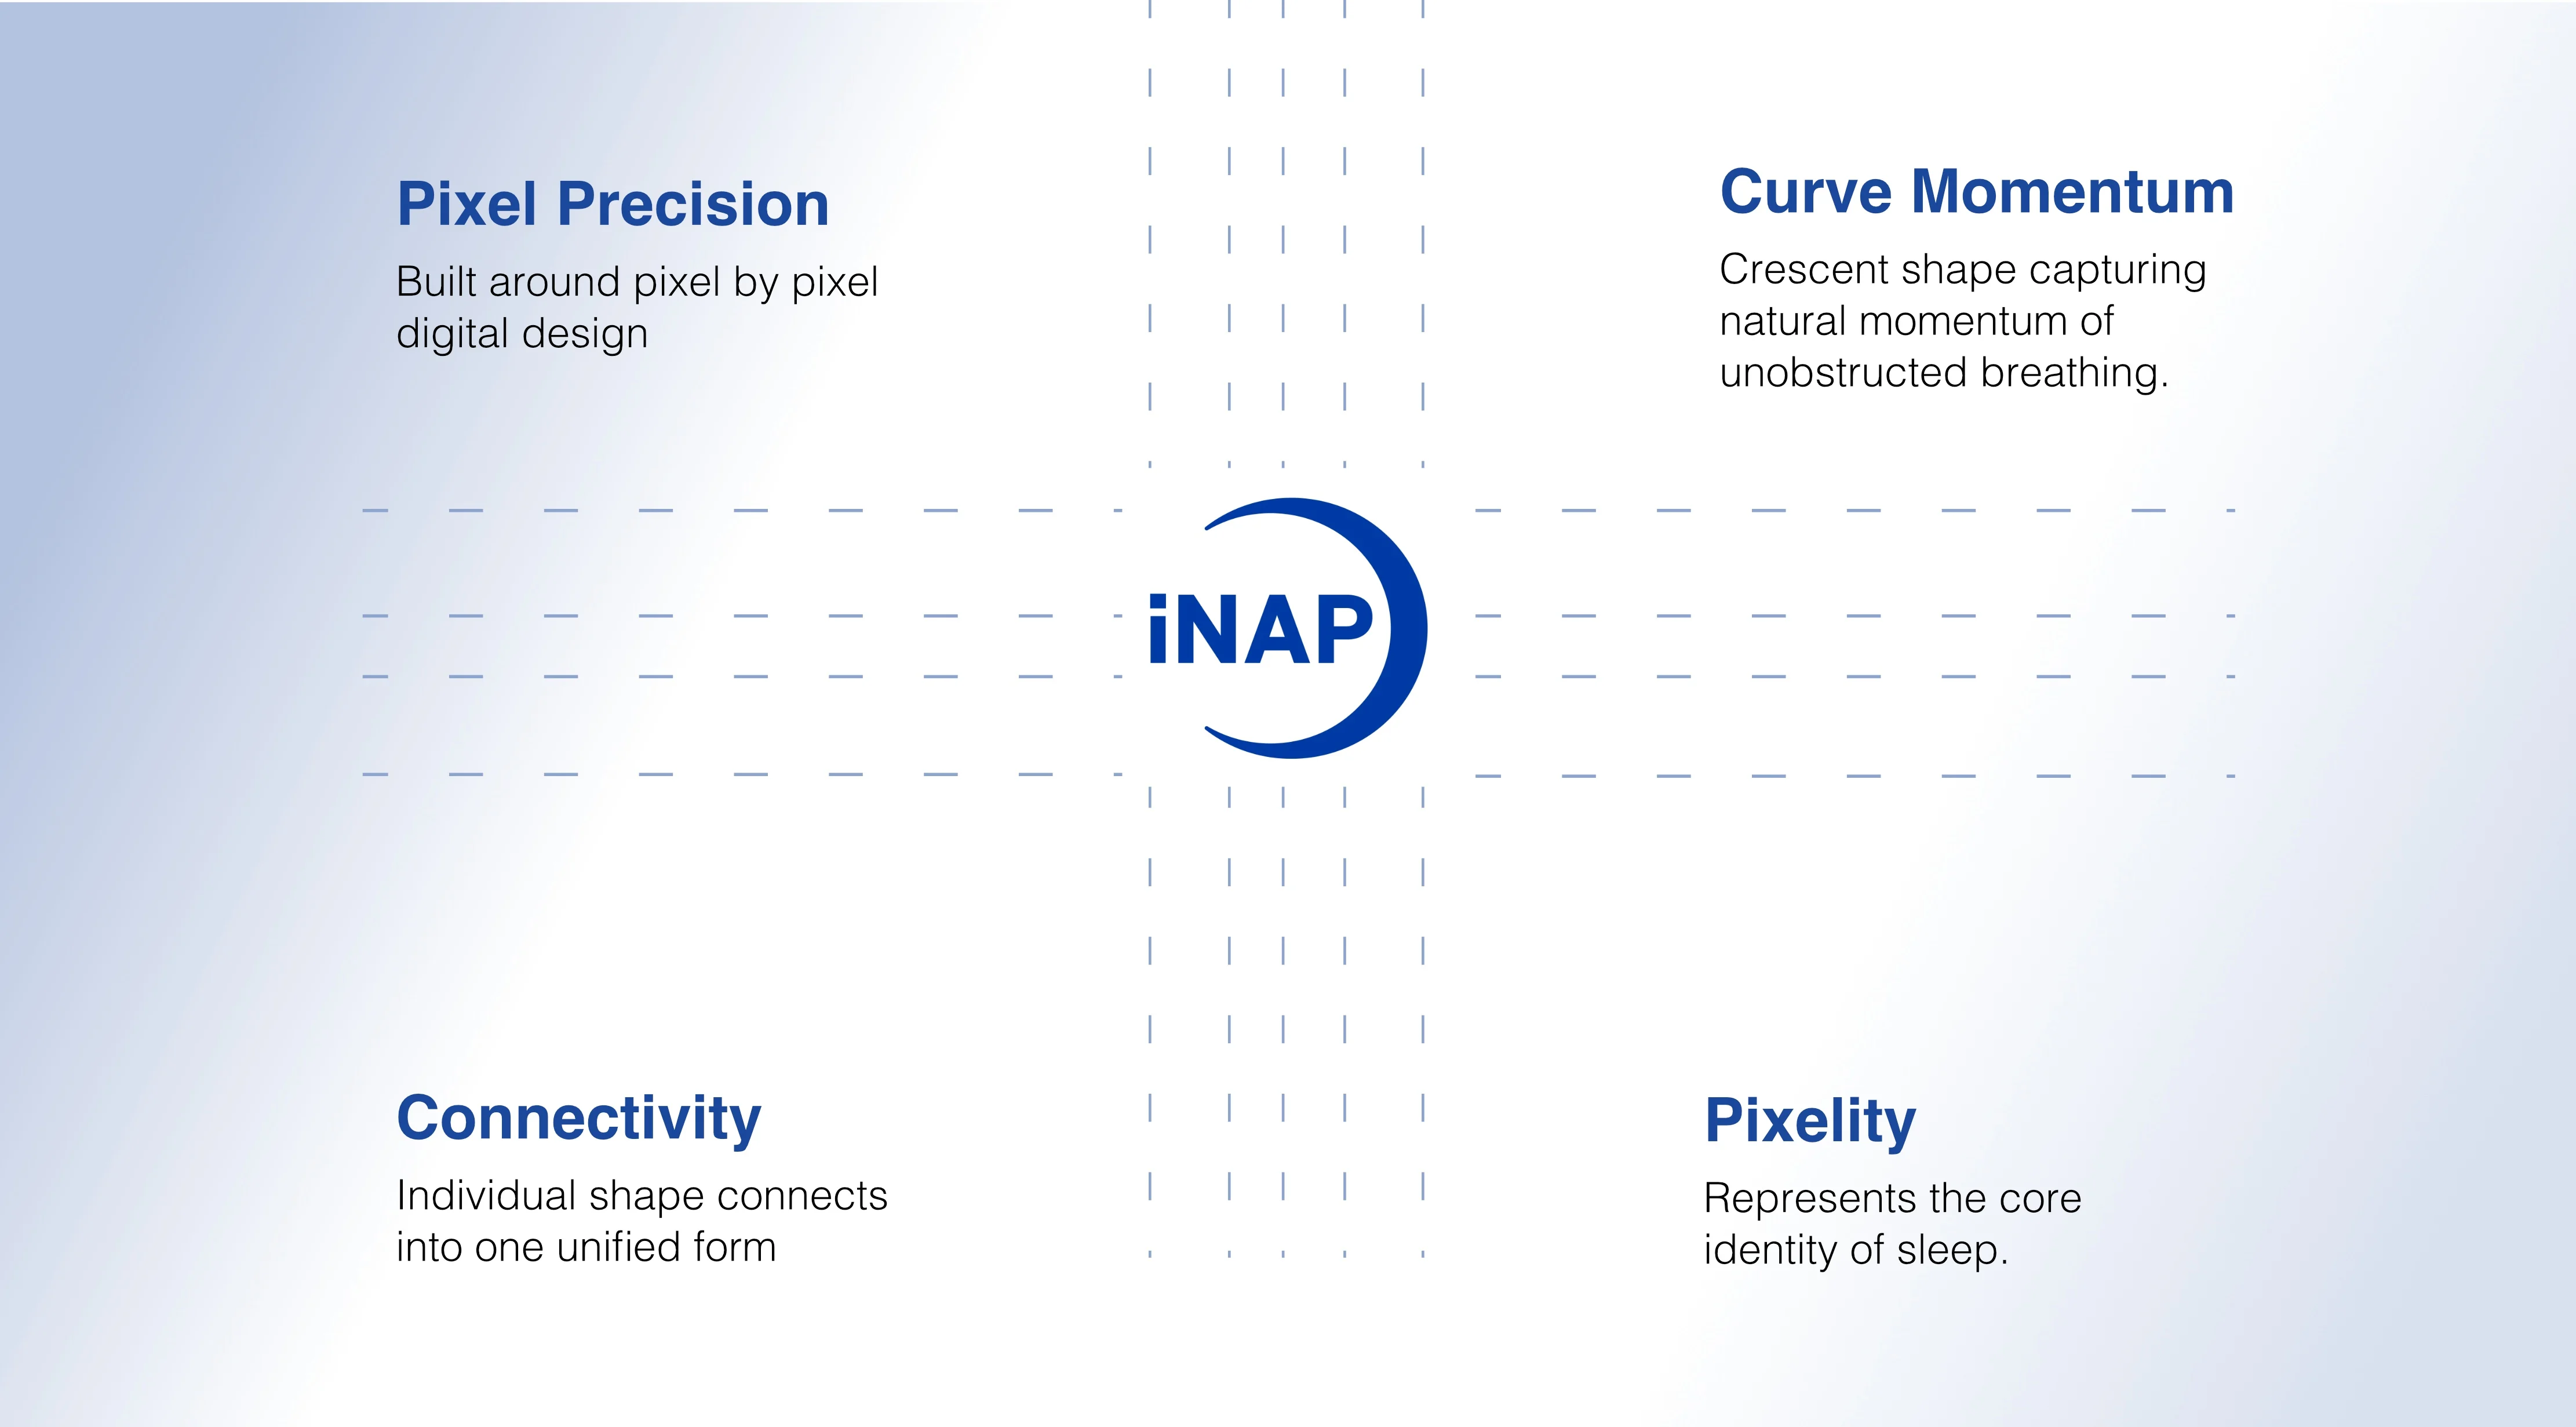
Logo Development / Concept
A Logo Built Around Movement
The iNAP identity combines a precise geometric approach with a curved form inspired by natural breathing, connection, and movement.
Download the Full One-Pager
See the complete iNAP visual communication piece, including patient data, product information, illustrations, iconography, and brand elements.
Final Logo / Copyright
Like this project
Posted Sep 27, 2026
Transformed dense medical data into a clear, engaging one-page visual system—restructuring content, custom iconography, illustrations, and data visualization.
Likes
1
Views
23
Timeline
Mar 15, 2025 - Apr 21, 2025
Clients
iNAP Sleep