Creating Custom Dashboards for KPI Monitoring in Klipfolio

Geta Viasu-Räisänen


Project Scope: Modernizing Business Intelligence for a U.S. Manufacturing Company
I’m currently leading a 4–6 month data visualization and dashboard migration project for a well-established U.S.-based HVAC manufacturing and distribution company. With nearly 50 years in business, this operation has a nationwide customer base and a complex set of performance metrics across sales, service, and finance.
The goal: migrate legacy reports into Klipfolio and design modern dashboards that are not only visually clear, but operationally insightful — supporting better decisions and giving stakeholders a more responsive view of the business.
(Update: 1 and a half months in and 6 dashboards completed)

Legacy Excel vs. Klipfolio
🤖 The Challenge: Outdated Reports, Disconnected Metrics
Before I joined the project, the client relied on Excel-based reports, maintained manually across departments. These reports were time-consuming to update, prone to inconsistencies, and offered little in the way of real-time visibility.
The leadership team needed a more unified, scalable reporting system — one that could track everything from outbound sales efforts to financial performance metrics like revenue and projections. They were looking for dashboards that could evolve with the business, offering clarity and actionable insights without overwhelming the end users.
The shift wasn’t just about better visuals — it was about enabling a more proactive, data-driven culture.
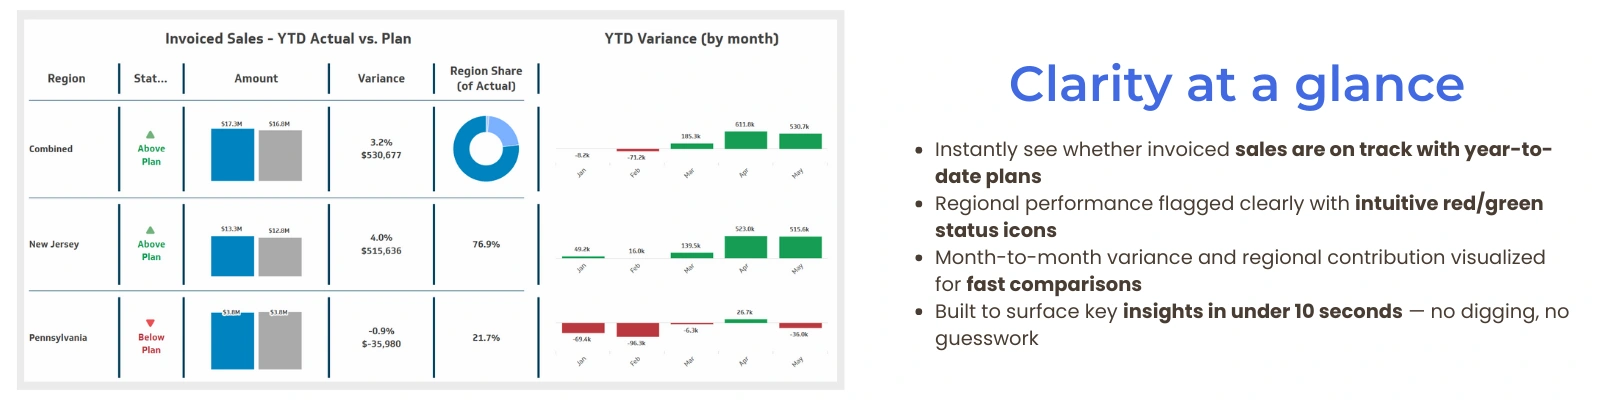
Smart Dashboard | Actionable insights in under 10 seconds
🚀 My Role & Approach
As a freelance data analyst and dashboard designer, I work directly with the company’s Managing Director to bring clarity and speed to their reporting.
Depending on the need, I either:
Translate existing Excel reports into actionable Klipfolio dashboards, or
Explore raw data and proposed fresh KPIs and visualizations they hadn’t considered.
Each dashboard begins with a clear goal: what decision is this meant to support?
From there, I sketch layouts, design intuitive flows, and build just enough to preview the vision before finalizing.
I also clean and model messy or disjointed data sources to ensure the dashboards behave as expected.
⚙️Tools:
Klipfolio for dashboard development
Excel as a primary data source
Data modeling to clean, reshape, and connect disjointed inputs
I also create custom variables and logic to drive dynamic behavior and ensure smooth filtering and accurate results.
💬Communication style:
We keep communication simple and effective through weekly check-ins and message-based updates. We rely on fast iteration loops: build → share preview → refine
🎯Results & Value Delivered
That shift — from “let’s try this out” to “you’re our go-to” — has been one of the most rewarding aspects of this collaboration.
What began as a 1–3 month engagement grew into a 6-month partnership, with renegotiated terms to reflect the strategic value I bring. The initial learning curve (including re-familiarizing myself with Klipfolio) was short-lived — within two weeks, I was delivering high-impact dashboards on a steady rhythm.
The dashboards now:
Replace static Excel reports with real-time, self-serve insights
Empower the Managing Director to track performance with clarity and speed
Reduce reporting friction and manual work across the business
🌟 Reflections
This project reminded me how much I love turning messy data into something that makes people say, “Ah, I see it now.”
It reinforced two core strengths of mine:
Translating business questions into visual answers
Creating clarity out of complexity, fast
It also showed me how quickly trust can grow when communication improves and results speak for themselves.
More than a dashboard project, this was proof that freelance work can be both strategic and deeply collaborative — even across time zones and tools I hadn’t touched in years.
Like this project
Posted May 26, 2025
I partnered with a HVAC business to migrate manual reports into smart, actionable dashboards in Klipfolio. Highlights: data visualization, strategic analytics
Likes
0
Views
0
Timeline
Apr 11, 2025 - Ongoing