FINE – Stock Market Intelligence Dashboard
Lovable Templates
1 collaborator
Template Name
FINE – Stock Market Intelligence Dashboard
Purpose
A sharp, all-in-one dashboard for tracking stock market data, financials, sentiment, and trends, designed for anyone who wants clarity without the clutter. Great for founders, analysts, or curious minds who want to make sense of the market at a glance.
Lovable Prompt
Build a fully functional stock market intelligence dashboard inspired by tools like Fey and TradingView.
It should include an onboarding flow, subscription pricing page, dark mode UI, and real-time data for major indices.
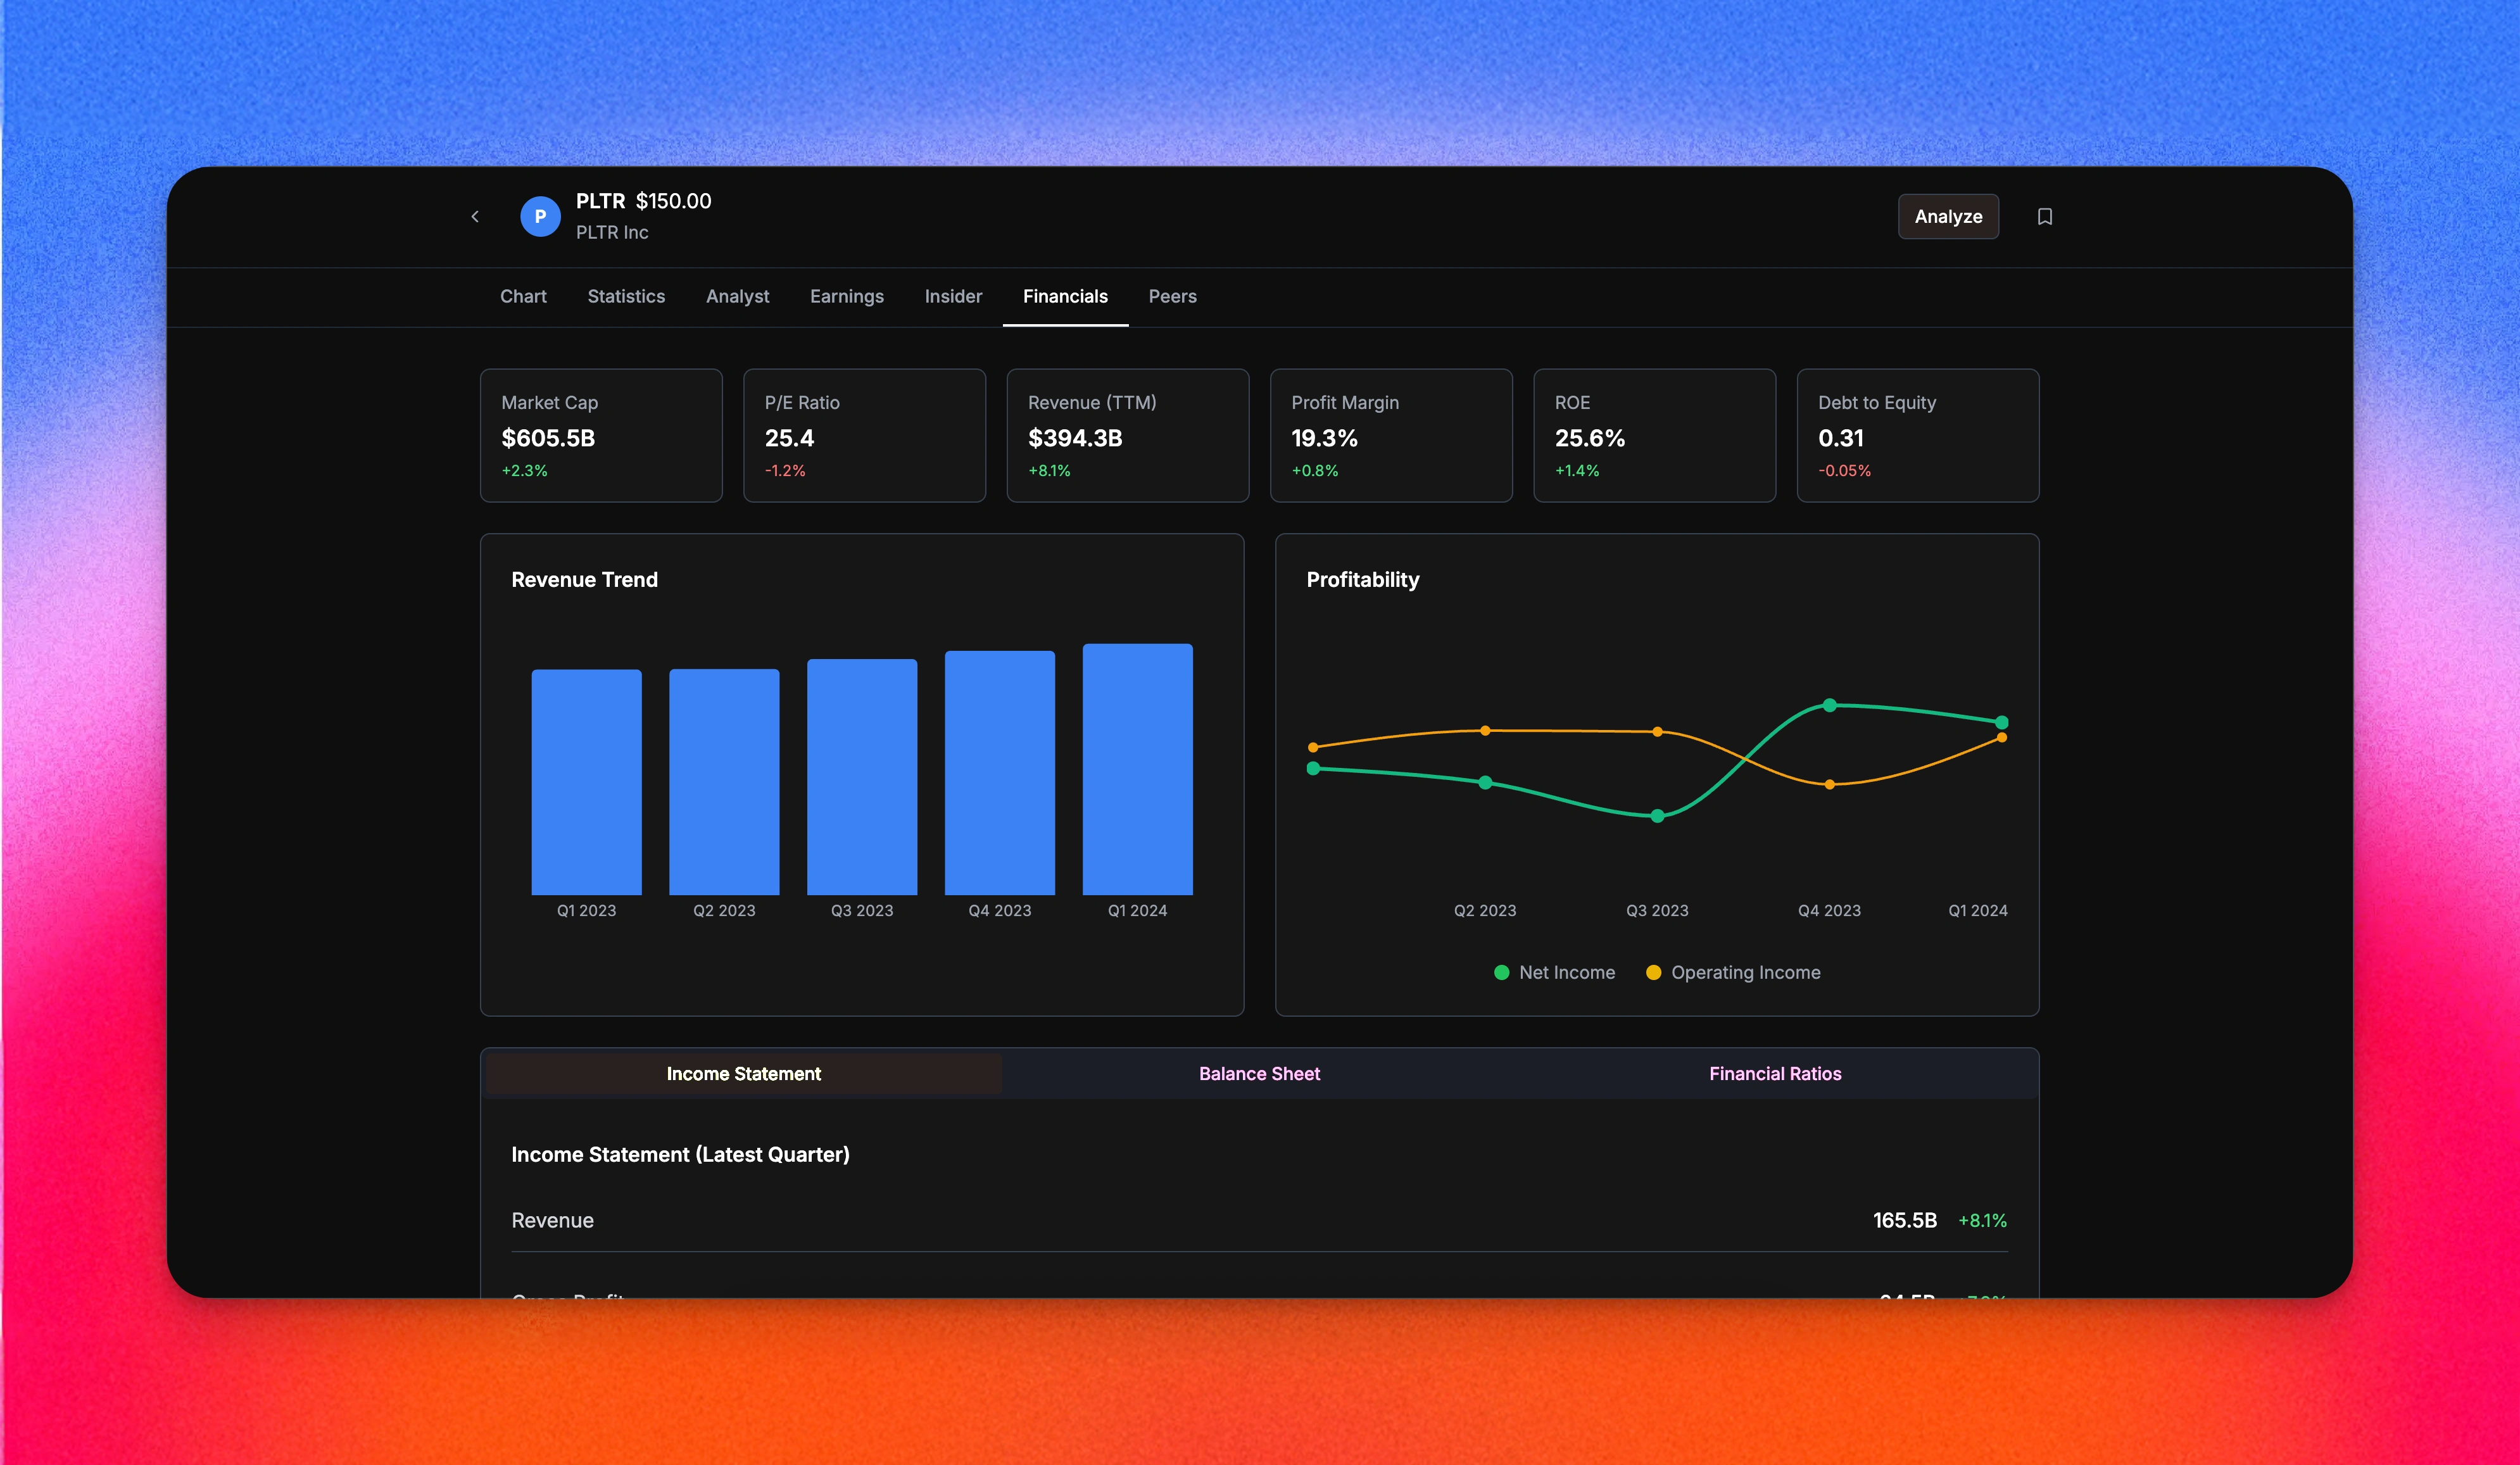
Each stock should have a dedicated insights page with live charts, analyst sentiment, earnings performance, and financials.
Prioritize a slick, clean design with modern typography, minimal distractions, and strong UX flow.
Fonts: Inter.
Color palette: Dark background, vibrant green/red for price movement, subtle gradients for accents.
Preview
Finances
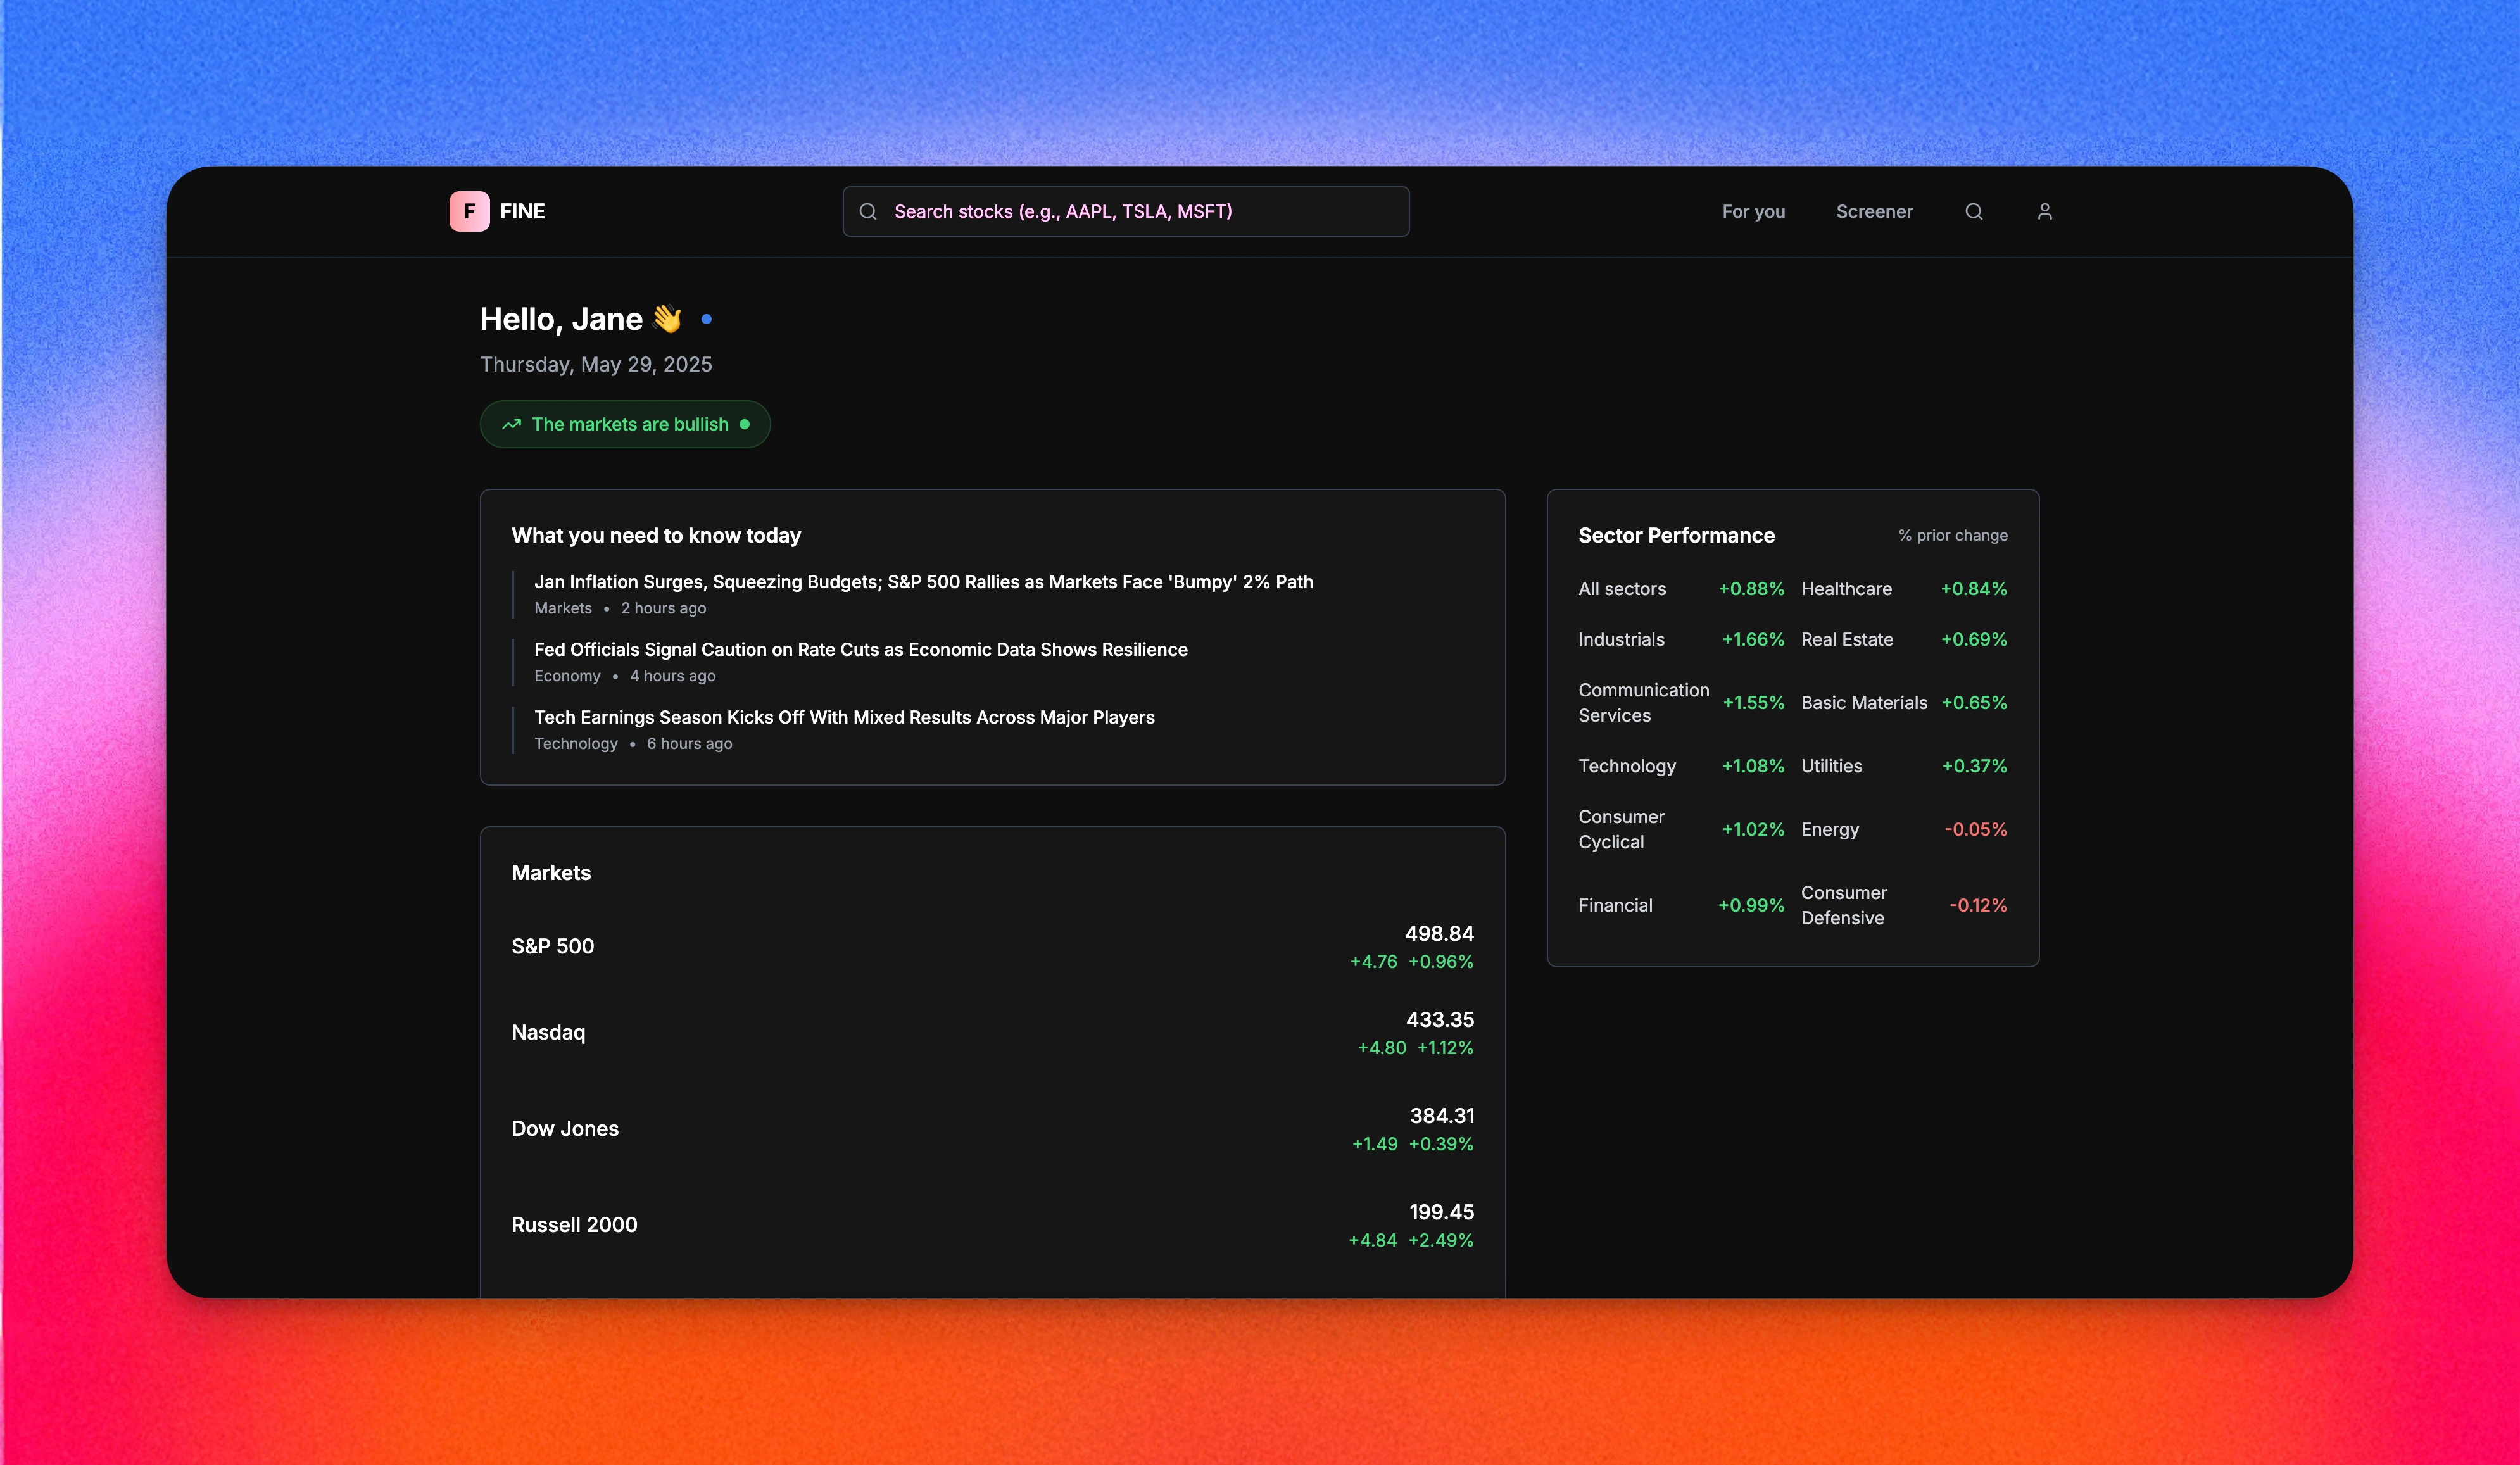
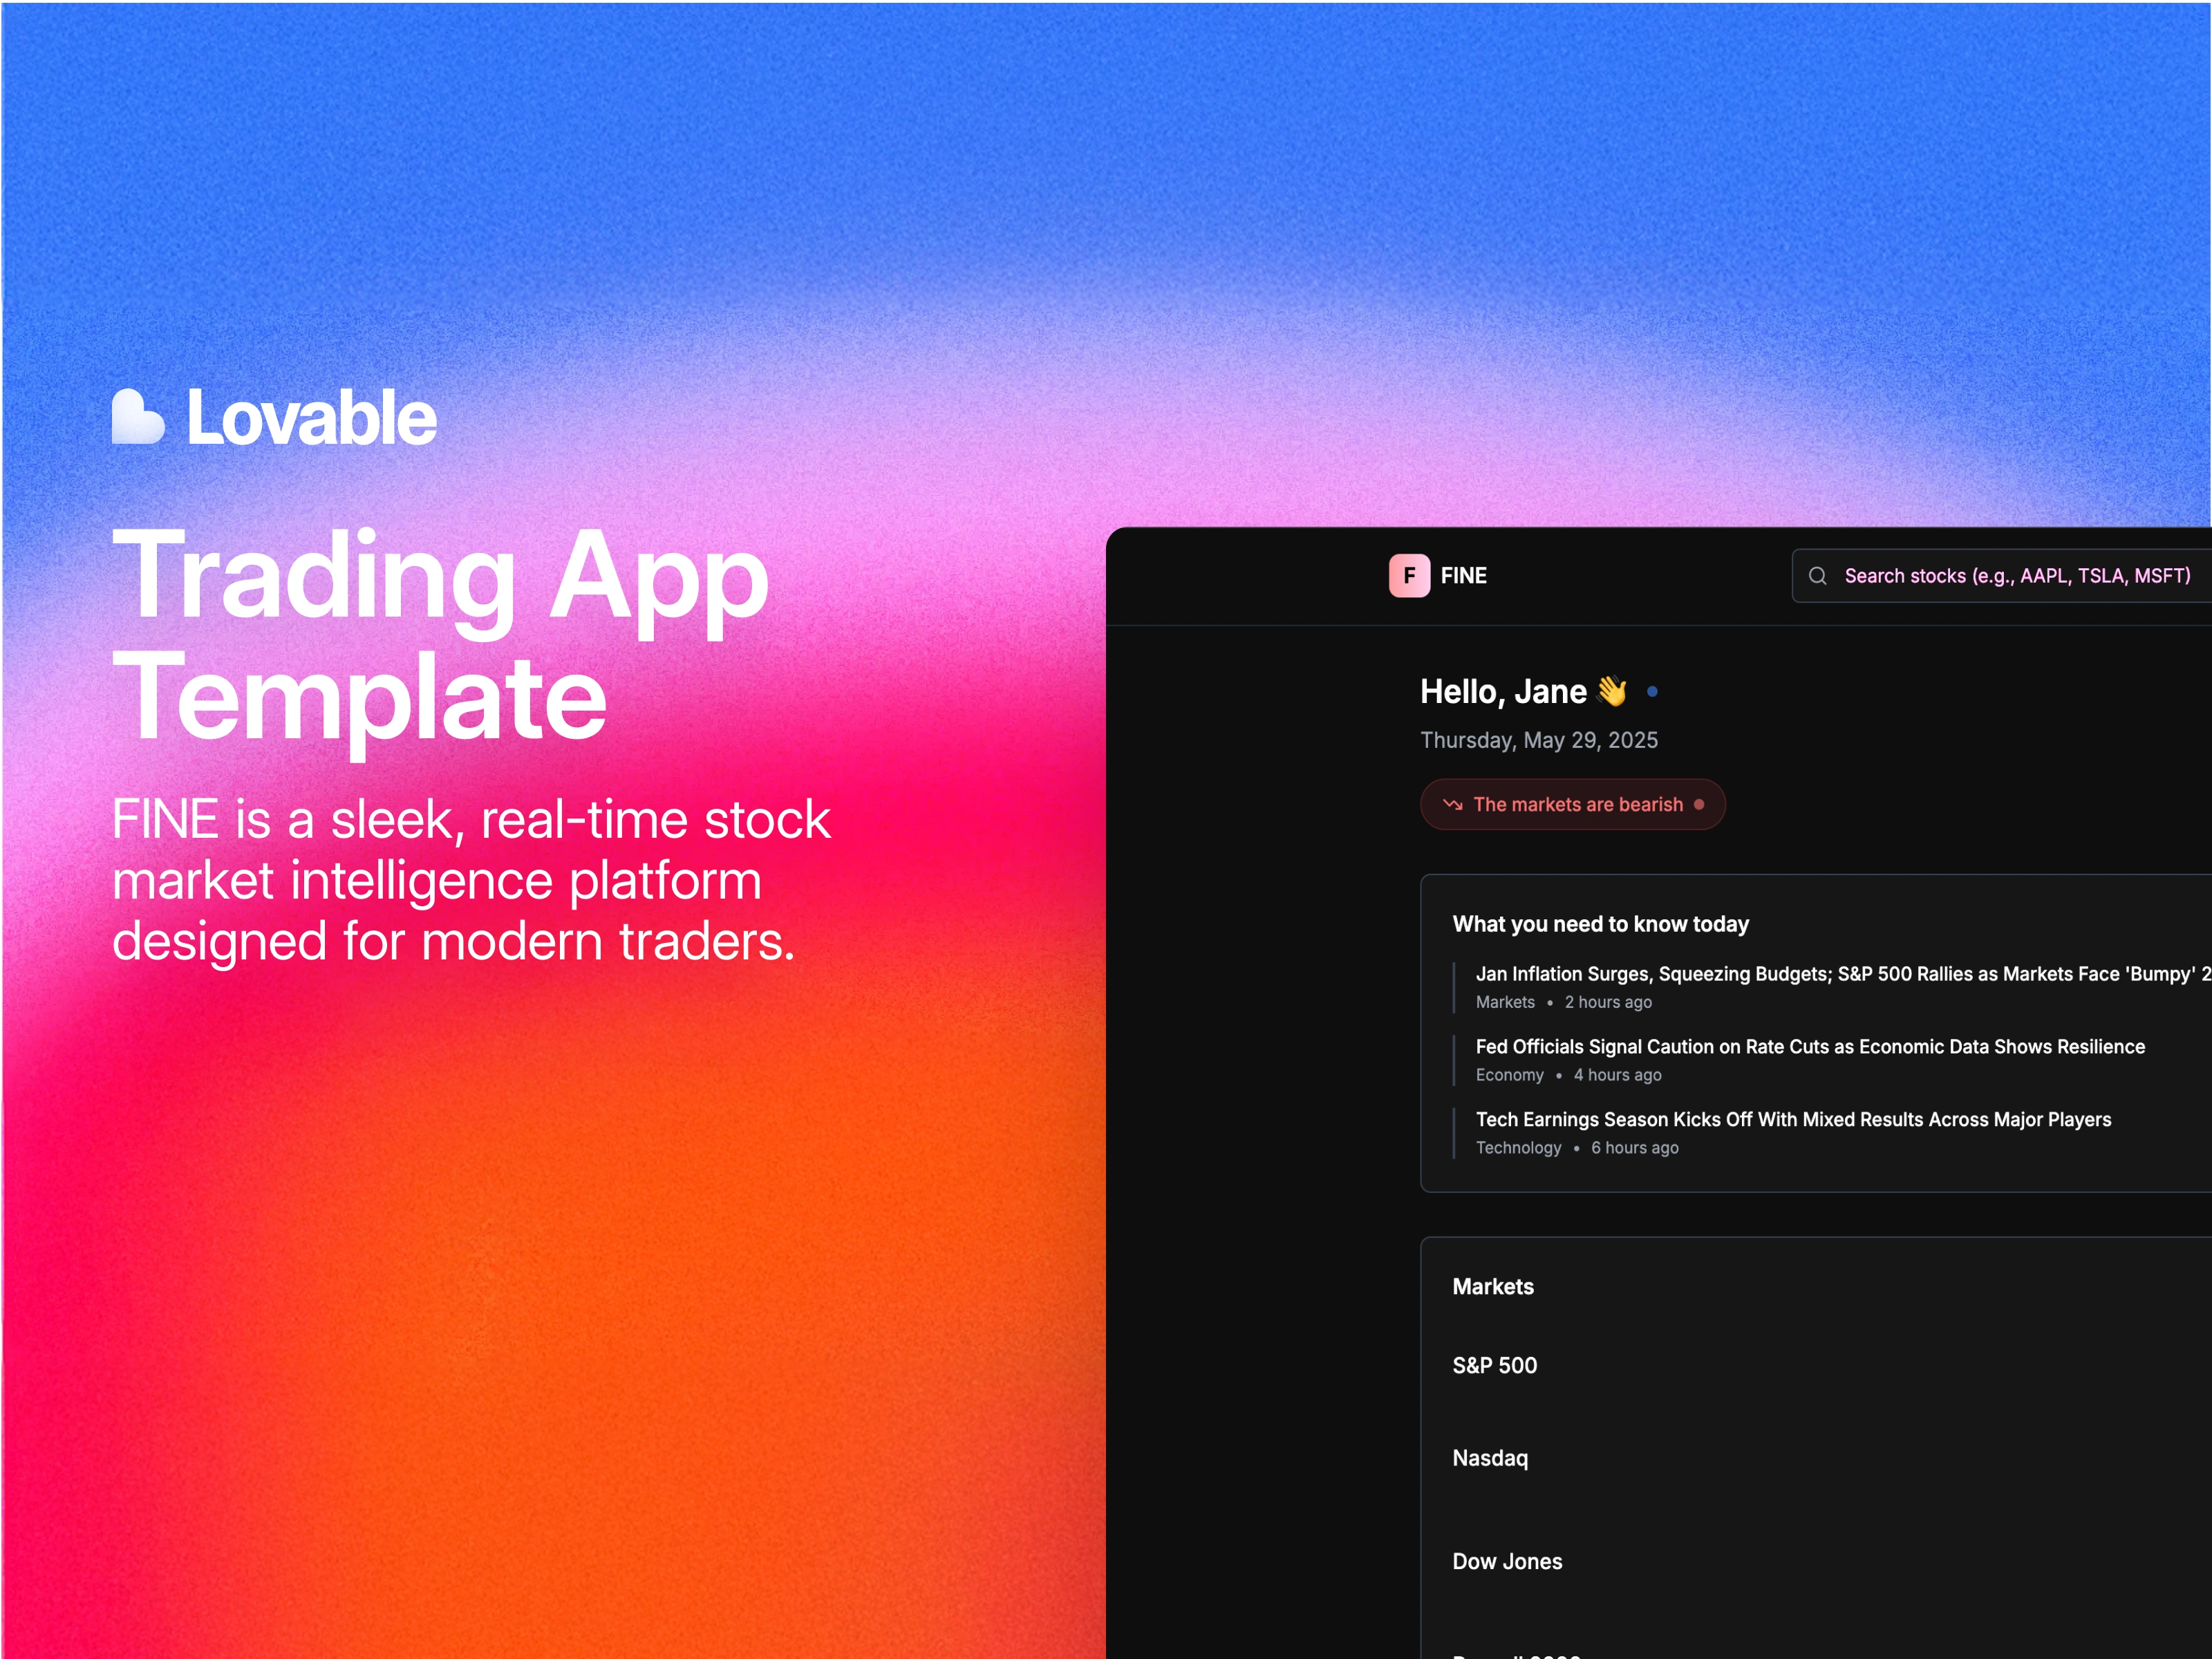
Homepage
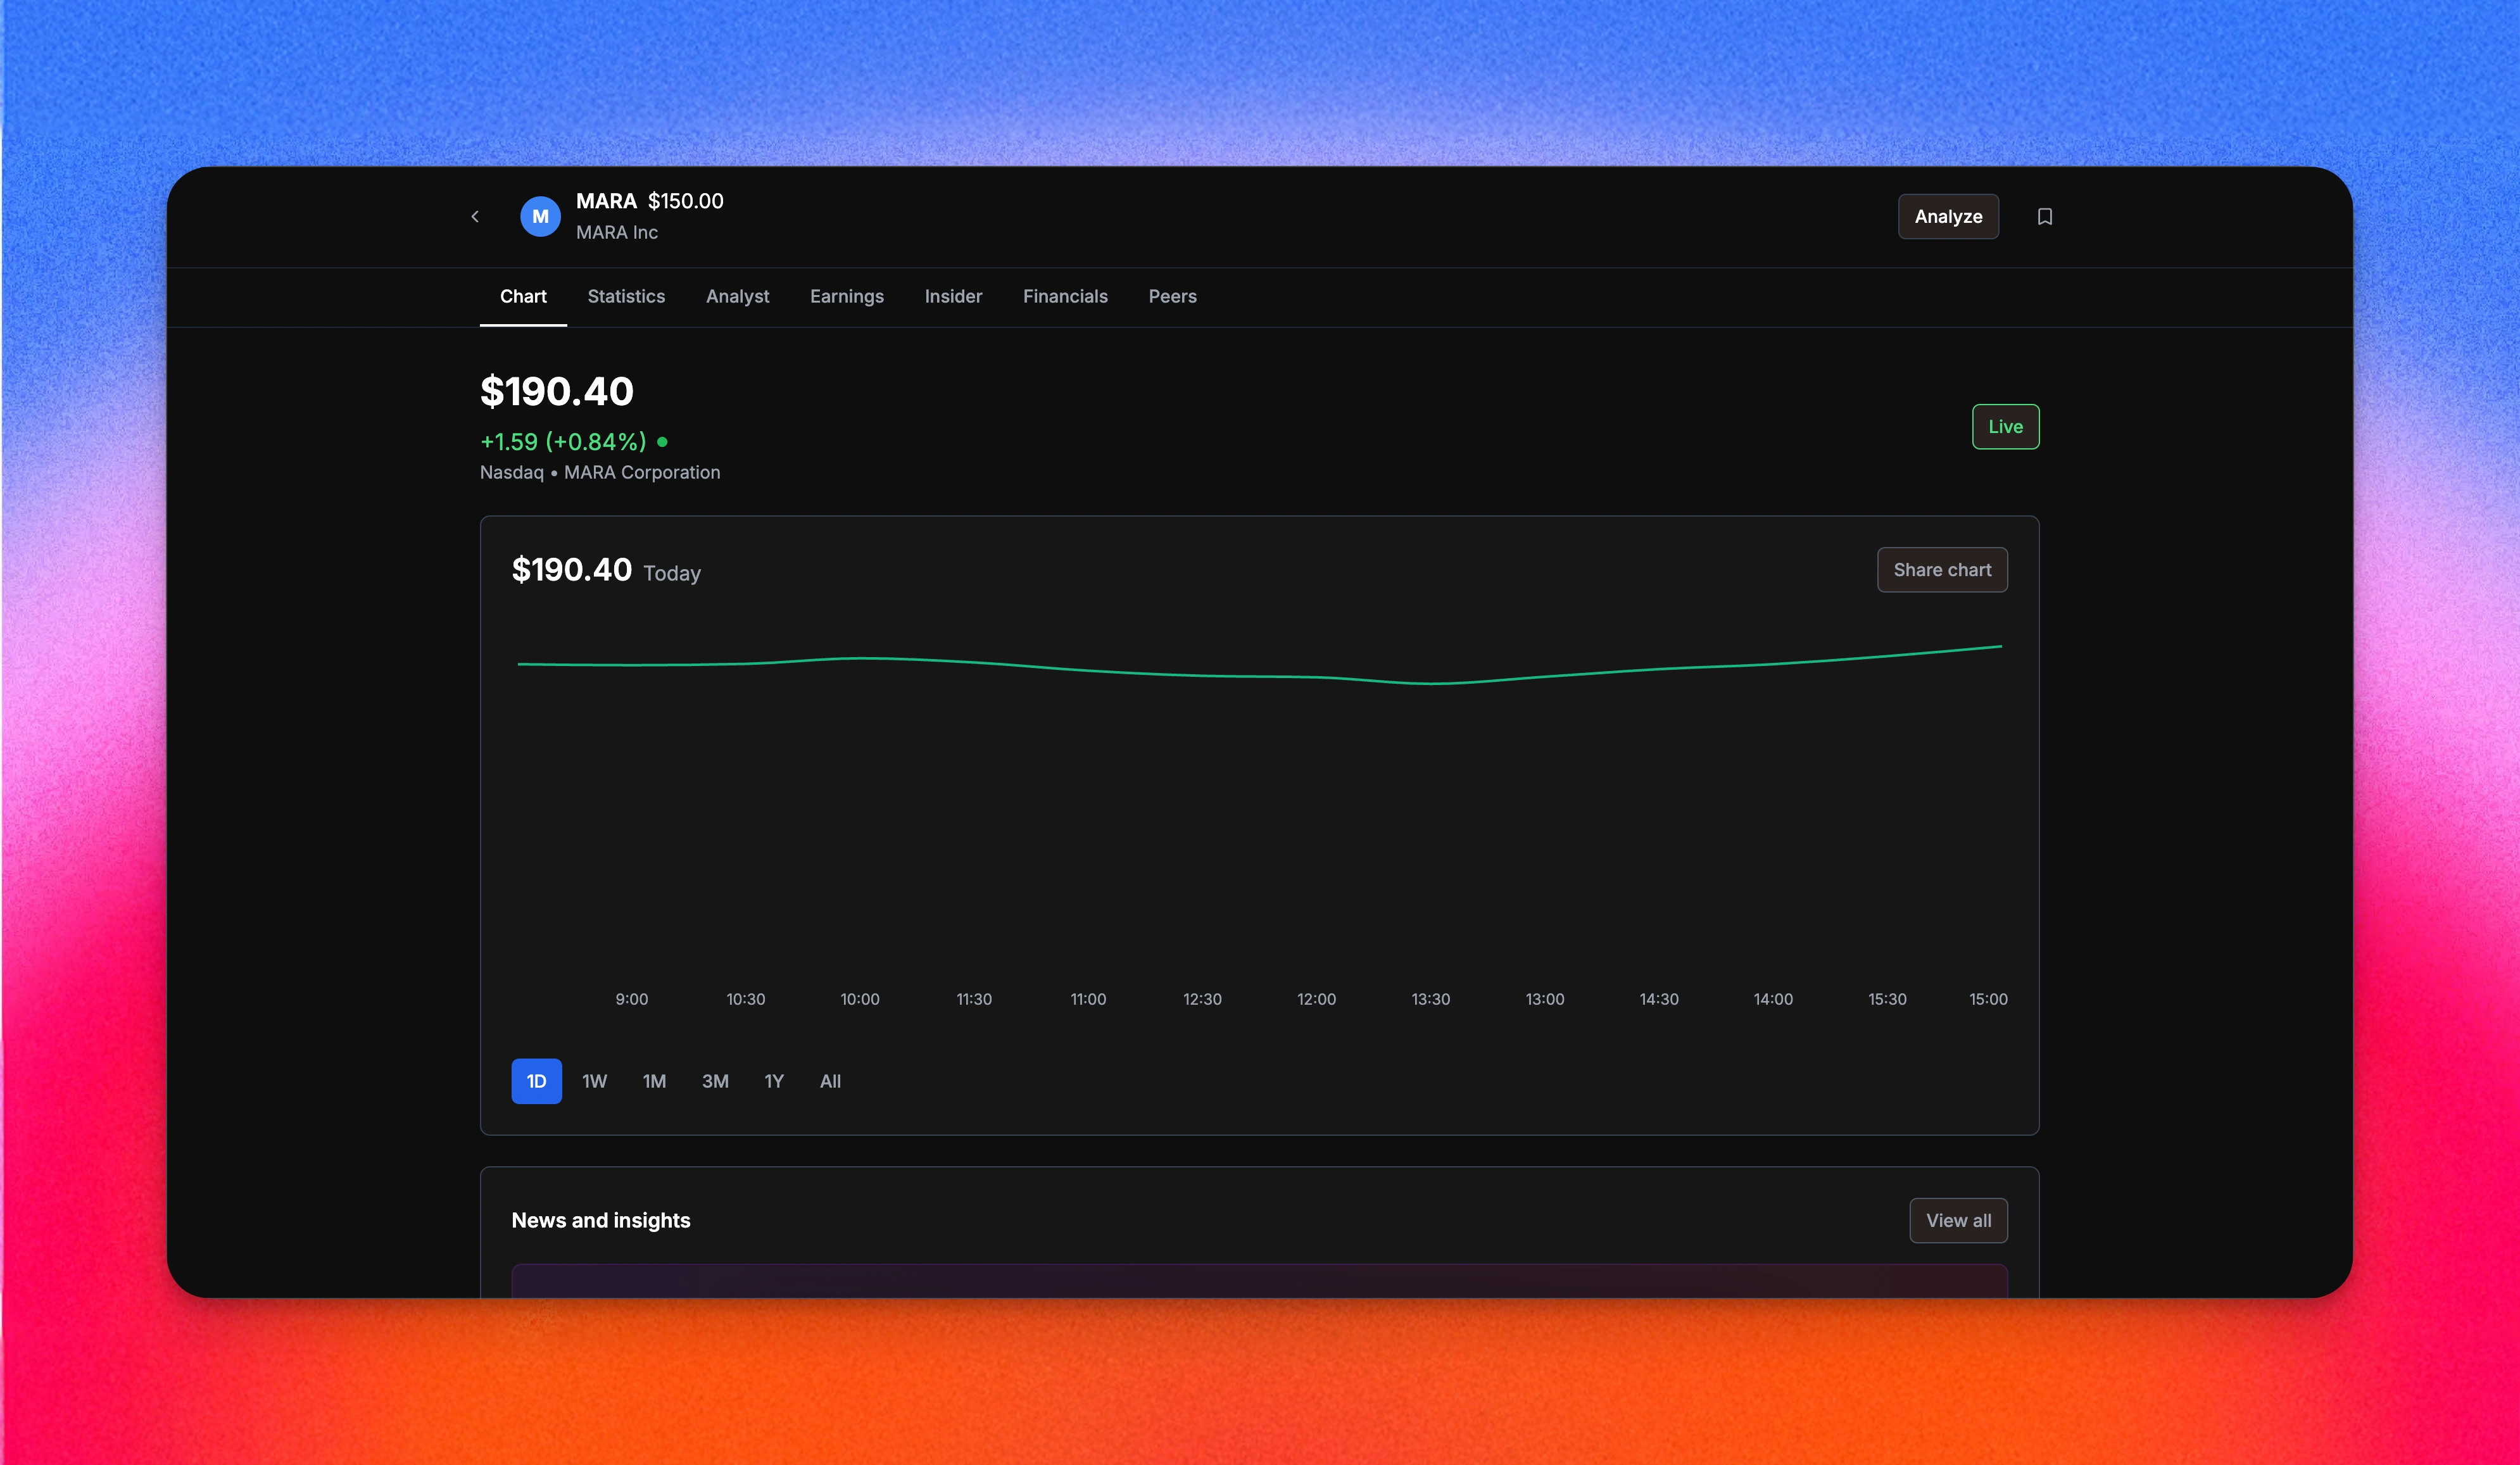
Stock Page
Features
Real-time stock and crypto tracking
Full onboarding and auth
Membership pricing tiers
Visual insights like spider charts, bar graphs, and line charts
Responsive dark-mode UI
Share/screenshot feature
Clean tooltips and hover states
Supabase integration for user state and data storage
Design Notes
Built entirely in Lovable using Inter font for a crisp, modern look
Layout is grid-based for ultimate clarity, charts, stats, and insights don’t compete
Icons are minimal and intentionally flat to support the data focus
Dark mode keeps it serious but gradients soften it visually
Inspired by: Fey, Bloomberg Terminal, Notion-style minimalism
Troubleshooting
For better performance, limit the number of live charts rendering on screen at once
Chart interactions may vary by browser, test on both Chrome and Safari for smoothest tooltips
If data loading breaks, refresh token in Supabase settings
Consider toggling between live mode and demo mode for lighter loads in showcase
Like this project
Posted May 29, 2025
A sharp, all-in-one dashboard for tracking stock market data, financials, sentiment, and trends, designed for anyone who wants clarity without the clutter.
Likes
0
Views
28
Collaborators