Built an interactive sales dashboard

Aastha Kansal

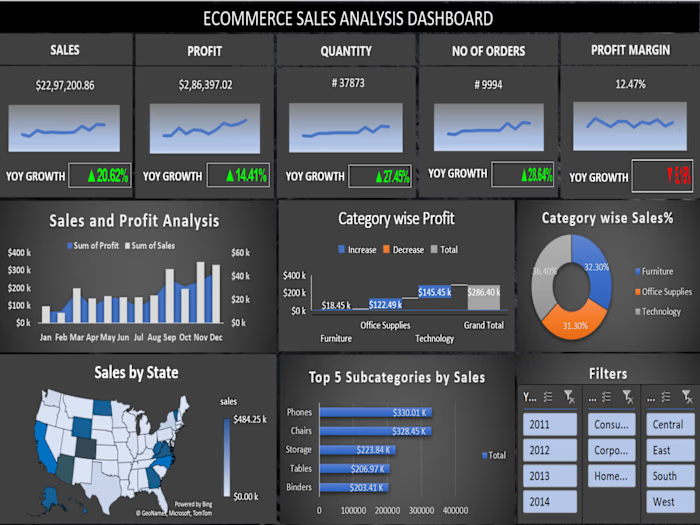
Built an interactive sales dashboard using Microsoft Excel to analyze revenue, customer footfall, and product performance.
📊 Key Highlights:
• Total Sales: $698K+
• Peak Hours: 8–10 AM
• Coffee contributes 39% of revenue
• Friday has highest orders
🛠 Tools Used:
●Pivot Tables
●KPI Cards
● Slicers
●Data Visualization
Like this project
Posted Sep 26, 2026
Built an interactive sales dashboard using Microsoft Excel to analyze revenue, customer footfall, and product performance. 📊 Key Highlights: • Total Sales:...
Likes
0
Views
2