E-Commerce Sales Dashboard Development

Aastha Kansal

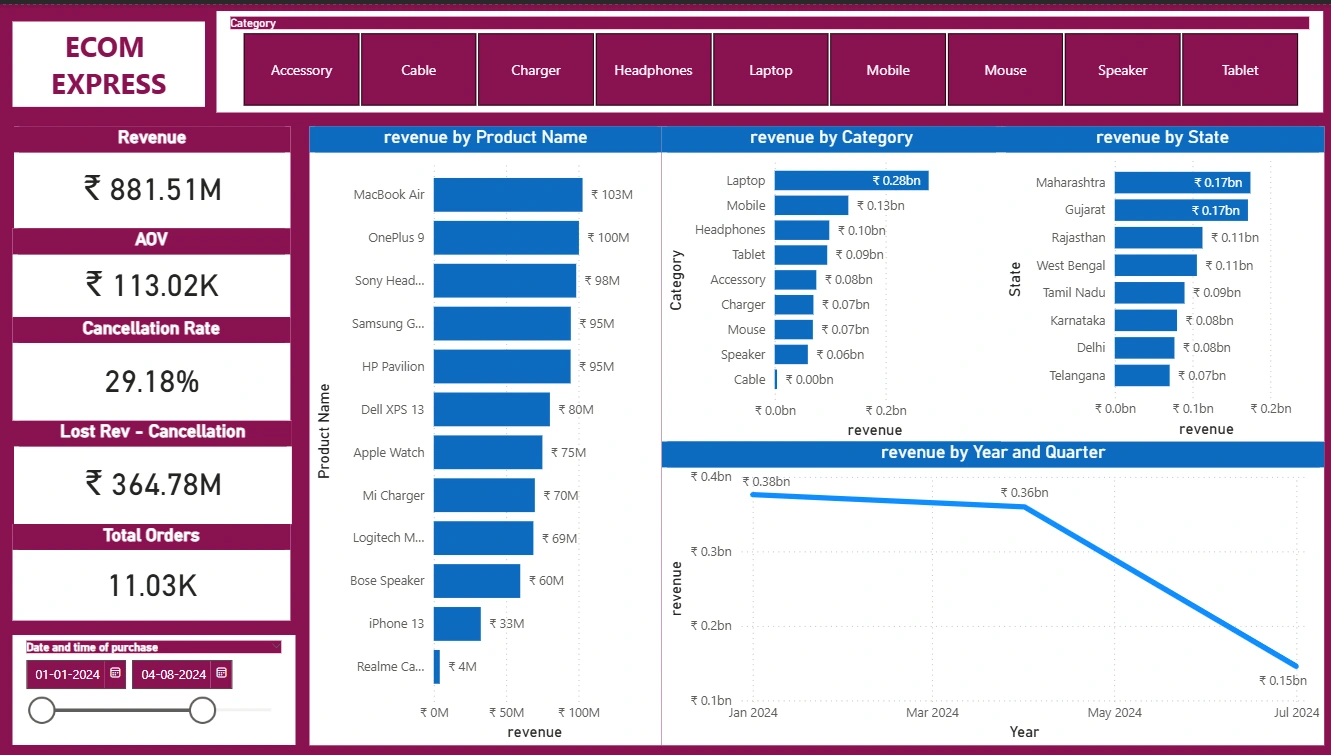
📊 E-Commerce Sales Dashboard (Power BI)
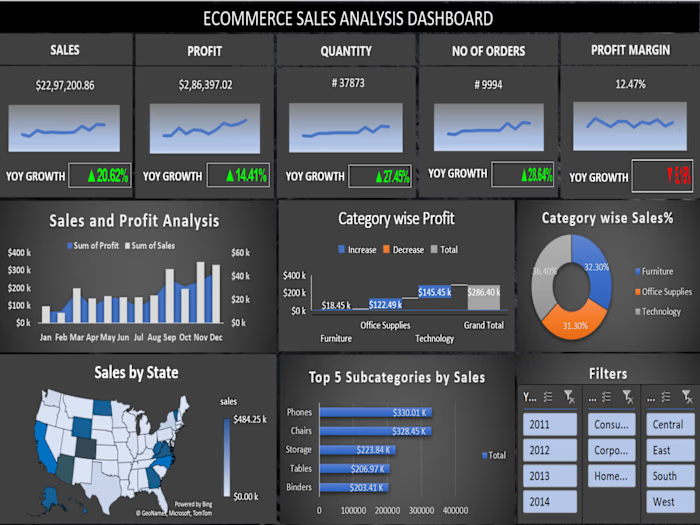
📌 Project Overview This project is an interactive E-Commerce Sales Dashboard built using Power BI to analyze business performance across multiple dimensions such as revenue, product categories, states, and time. The dashboard helps stakeholders quickly understand key metrics like Revenue, Average Order Value (AOV), Cancellation Rate, and Total Orders, enabling data-driven decision-making.
🚀 Key Features 💰 Revenue Analysis – Total revenue of ₹881.51M 📦 Product Performance – Revenue by product name (Top products like MacBook Air, OnePlus 9, etc.) 🗂️ Category Insights – Revenue comparison across categories (Laptop, Mobile, Accessories, etc.) 🌍 Geographical Insights – Revenue distribution by state (Maharashtra, Gujarat, etc.) 📉 Cancellation Impact – Cancellation rate (29.18%) and lost revenue (₹364.78M) 📅 Time Analysis – Revenue trends by year and quarter 🎯 Interactive Filters – Category slicer and date range selection
🛠️ Tools & Technologies Power BI Desktop – Data visualization & dashboard creation Power Query Editor – Data cleaning & transformation DAX (Data Analysis Expressions) – Measures & calculations Excel / CSV Dataset – Data source
📂 Dataset Description The dataset contains e-commerce transaction data with the following fields: Order ID Product Name Category State Revenue Order Date Cancellation Status
📈 Key Metrics Used Revenue = Total sales amount AOV (Average Order Value) = Total Revenue / Total Orders Cancellation Rate (%) = Cancelled Orders / Total Orders Lost Revenue = Revenue lost due to cancellations
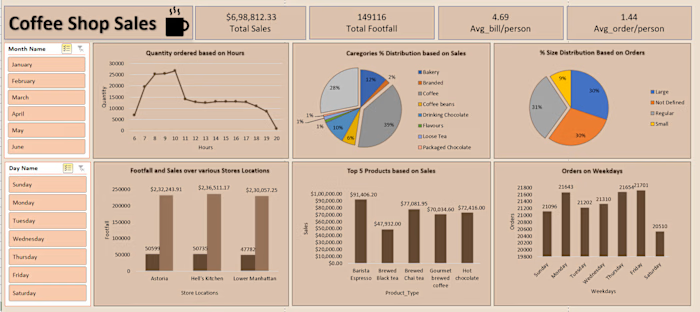
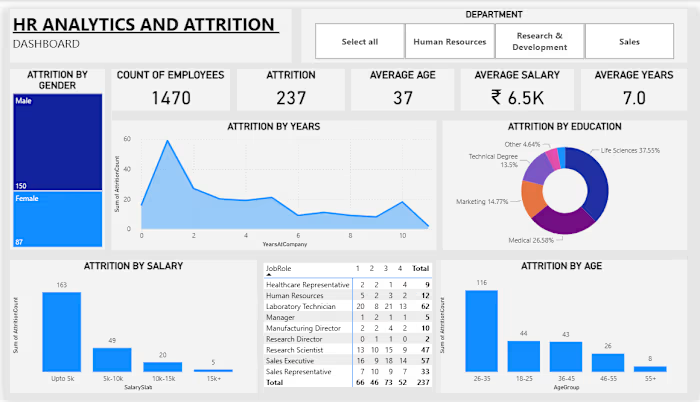
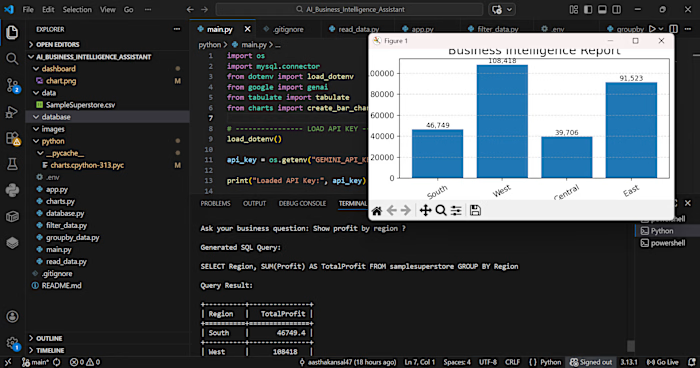
📷 Dashboard Preview
▶️ How to Use Download the .pbix file from this repository Open it in Power BI Desktop Interact with: Category slicer (top panel) Date range filter (bottom left) Analyze trends and insights
📌 Insights Gained Laptops generate the highest revenue Maharashtra & Gujarat are top-performing states High cancellation rate significantly impacts revenue Revenue trend shows a decline over time (needs investigation)
🔥 Future Improvements Add profit & cost analysis Include customer segmentation Add forecasting using Power BI analytics Improve UI/UX with advanced visuals
🙌 Author Aastha Kansal Aspiring Data Analyst
Like this project
Posted Sep 26, 2026
Developed an e-commerce sales dashboard using Power BI for performance analysis.