YouTube Analytics Dashboard for Traversy Media
Piyush Chauhan
📊 YouTube Analytics Dashboard – Traversy Media
This project is a Python-based YouTube Analytics Dashboard that fetches and visualizes public data from the Traversy Media YouTube channel.
Features
-Fetches channel statistics: subscribers, total views, total videos
-Fetches latest video stats: views, likes, comments
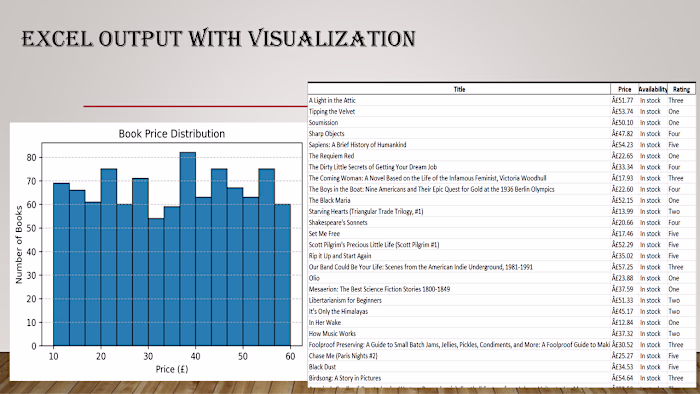
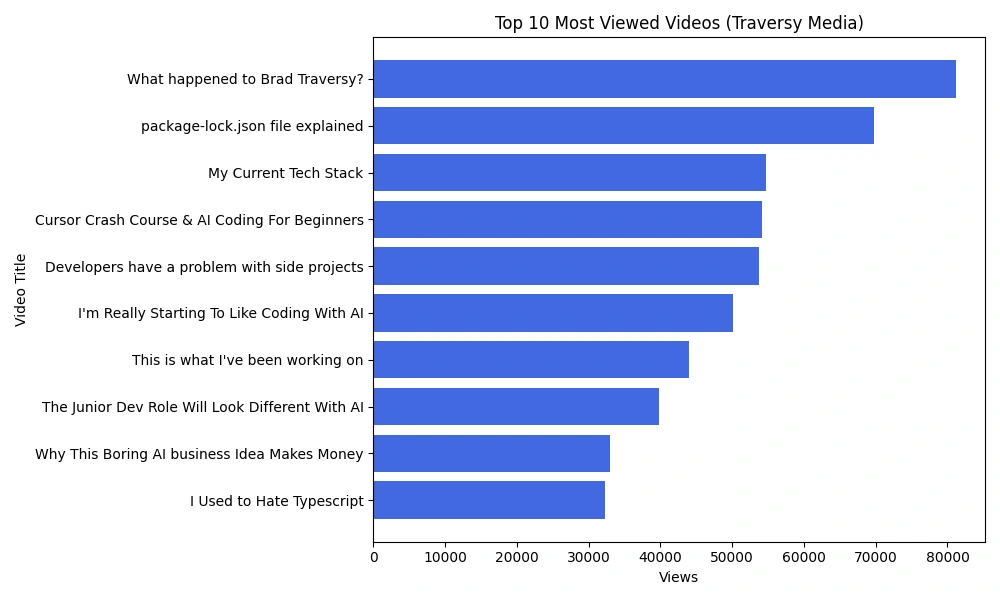
-Exports results to Excel -Generates a bar chart of the top 10 most viewed videos
📊 Sample Output
-📘 Excel File Example: **
🎥 Video Title 👁️ Views 👍 Likes 💬 Comments
JavaScript Crash Course 123,456 4,567 123
Python Tutorial for Beginners 98,765 3,456 89
React JS Full Course 76,543 2,987 72
You can also explore the full Excel report generated by this script: 🔗 Download
📈 Visualization Example: Bar chart
⚡ How to Run
Like this project
Posted Oct 11, 2025
Created a Python-based YouTube Analytics Dashboard for Traversy Media.
Likes
1
Views
4
Clients
Traversy Media