its-Adarsh2003/Portfolio-Optimizer
Adarsh Dubey
Portfolio Optimization
This project demonstrates Modern Portfolio Theory in Python. Using historical stock data, it calculates expected returns, volatility, and the covariance matrix of assets to construct the efficient frontier and find the optimal allocation of assets."
🔧 Tools & Libraries
Python 3.x
Pandas, NumPy
Matplotlib, Seaborn
SciPy Optimizer / PyPortfolioOpt
🚀 Features
Import and process historical stock data
Calculate daily & annual returns
Compute risk, volatility, and Sharpe Ratio
Construct the Efficient Frontier
Identify the optimal portfolio weights
Visualize results with clear charts
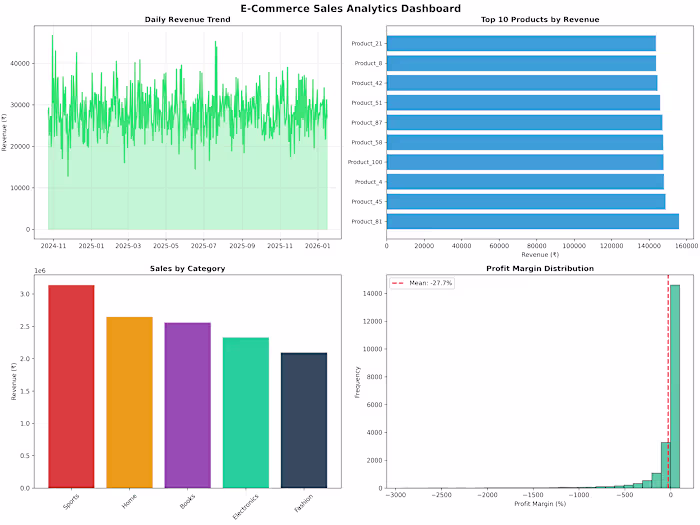
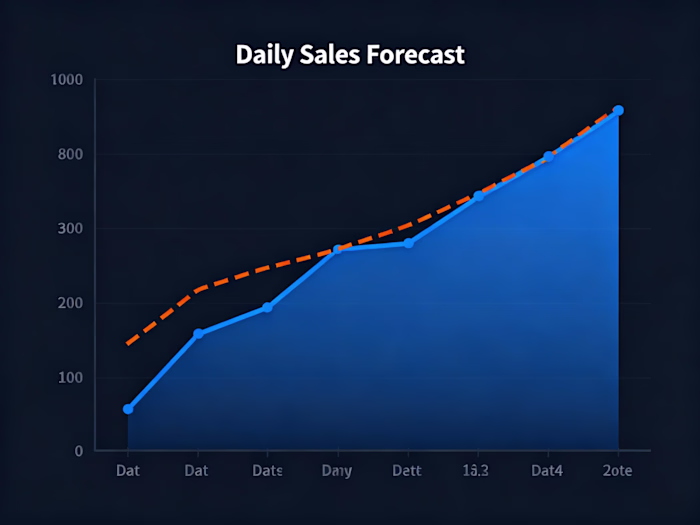
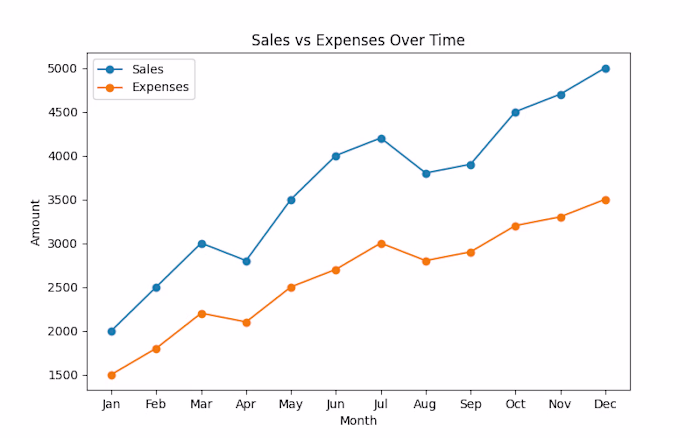
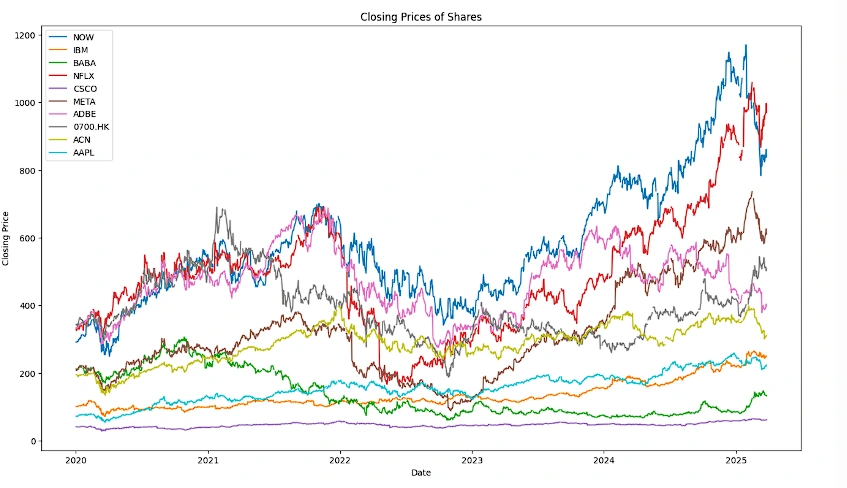
📊 Example Outputs
Closing Prices of Stocks
Portfolio Weights Distribution
This bar chart displays the optimal percentage allocation of each stock in the portfolio. These weights are determined by the optimizer to achieve the best balance between risk and return.
Distributed stocks
This visualization shows how different stocks are distributed across the portfolio. By analyzing the spread of stocks, investors can understand diversification and exposure to different assets. A well-distributed portfolio reduces risk by avoiding over-concentration in a single stock.
Like this project
Posted Sep 2, 2025
Contribute to its-Adarsh2003/Portfolio-Optimizer development by creating an account on GitHub.
Likes
0
Views
3
Timeline
Feb 23, 2025 - Apr 2, 2025
Clients
Personal Project