Retail Sales Analysis Project
Adarsh Dubey
🛒 Retail Sales Analysis – Data Analytics Project
This project is a complete end-to-end retail sales analysis built using Python, Pandas, and visualization libraries.
It explores customer behavior, monthly trends, product category performance, and key revenue drivers using a real retail dataset.
📌 Features
Cleaned and processed real-world retail sales dataset
Missing value handling & proper date-time formatting
Added new features: Month, Year, Weekday
Exploratory Data Analysis (EDA)
Category-wise performance insights
Gender-based revenue analysis
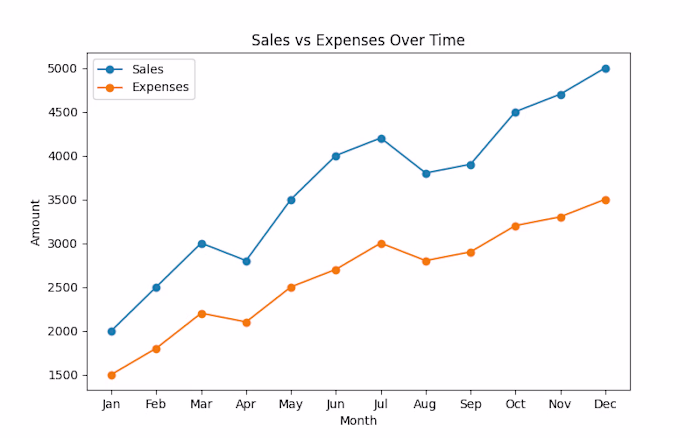
Sales trend visualizations
Cleaned dataset included for reuse
🛠️ Technologies Used
Python
Pandas
NumPy
Matplotlib
Seaborn
Google Colab
📂 Repository Structure
📦 Retail-Sales-Analysis/ │ ├── data/ │ ├── retail-sales-dataset.zip # Raw dataset │ ├── cleaned_retail_sales.csv # Processed dataset │ ├── notebooks/ │ └── retail_sales_analysis.ipynb # Full analysis notebook │ ├── images/ │ ├── category_sales.png │ ├── monthly_trend.png │ ├── weekday_sales.png │ ├── gender_sales.png │ └── README.md
📊 Key Visualizations
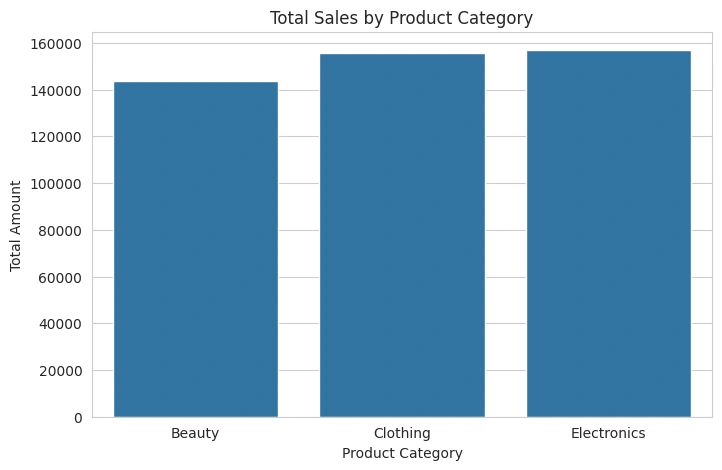
Category Sales Performance
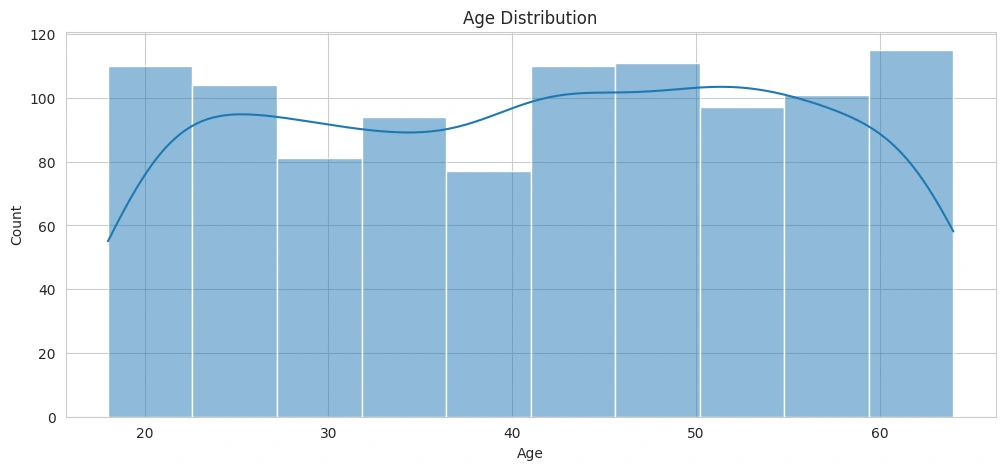
age Sales distribution
Daily sales Forecasting using linear regression
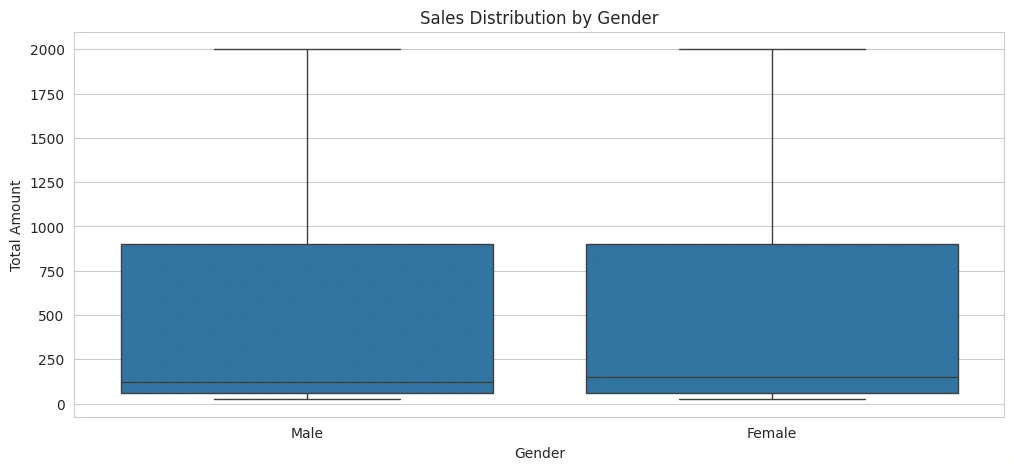
Gender-Based Sales
▶️ How to Run the Project
1. Clone the Repository
Install Dependencies pip install pandas numpy matplotlib seaborn
Open the Notebook
Use either:Google Colab/Jupyter Notebook
Open:notebooks/retail_sales_analysis.ipynb
Run All Cells
The notebook will:
Load the raw dataset
Clean & process it
Generate all charts
Save the cleaned CSV
📌 Key Insights
Electronics & Clothing generated the highest revenue.
December & November show strong seasonal peaks.
Saturday has the most sales activity.
Female customers contributed slightly more revenue.
Sales dominated by the 25–40 age group.
📬 Contact If you’d like help with Data Analytics, EDA reports, dashboards, or ML projects, feel free to reach out!
LinkedIn: www.linkedin.com/in/adarsh-dubey-81881a2a5 Email: dubeyadarsh138@gmail.com
⭐ If you found this project useful, please consider giving it a star!
Like this project
Posted Dec 1, 2025
End‑to‑end analysis of 1,000 retail transactions using Python to reveal sales trends, key product categories, and customer spending patterns
Likes
0
Views
3
Timeline
Nov 28, 2025 - Dec 1, 2025