E-commerce Revenue & Churn Analytics Project
Adarsh Dubey
🚀 E‑Commerce Revenue & Churn Analytics
End‑to‑end analytics project simulating 10,000+ customers and 50,000+ transactions to answer a CEO’s core questions:
“Where is our revenue coming from, which customers are at risk, and what should we do next?”
🔍 In One Glance
Business problem: Improve revenue, profitability, and customer retention for an e‑commerce store.
What this project does:
Builds a complete Python analytics pipeline (data → KPIs → segments → forecast → report)
Segments customers (RFM), flags churn risk, and forecasts revenue
Presents results in an executive‑ready report and an interactive dashboard
Why it matters: Shows how a data analyst can convert raw transactions into clear, monetizable business actions, not just pretty charts.
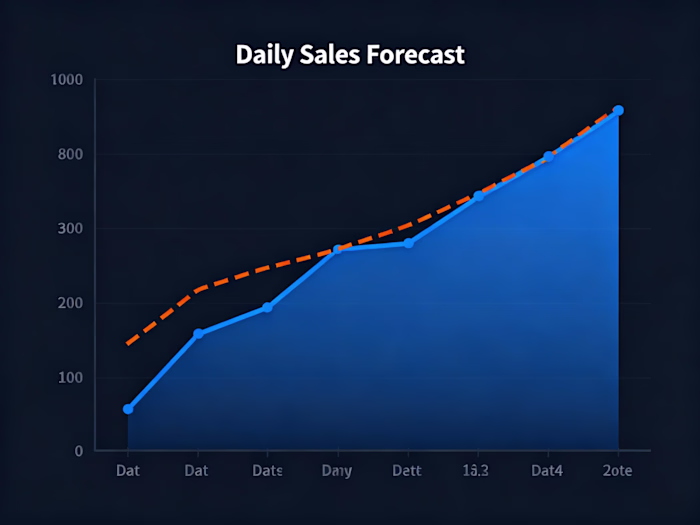
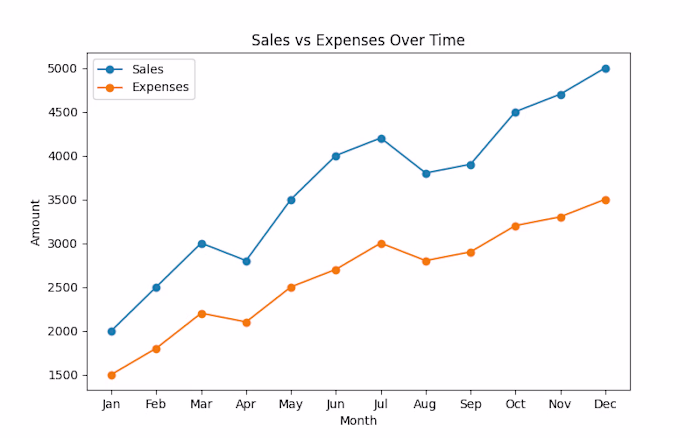
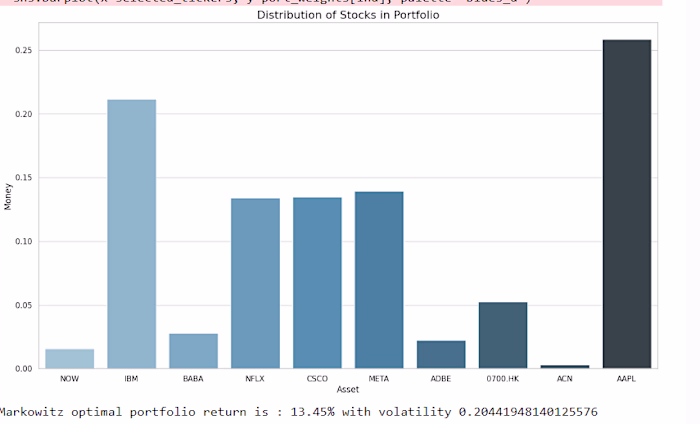
📊 Dashboard Preview
🛠️ Tech Stack
Python, Pandas, NumPy, SQL, Matplotlib, Seaborn
📌 Key KPIs Tracked
Total Revenue & Month-over-Month Growth
Year-over-Year Revenue Growth
Average Order Value (AOV)
Customer Lifetime Value (CLV)
Churn Rate & Revenue at Risk
90-Day Revenue Forecast
💼 Business Impact (Simulated)
Using synthetic but realistic data, this project surfaces insights similar to a real e‑commerce business:
Revenue growth: Detects ~35% year‑over‑year revenue growth and highlights which categories and products drive it.
Customer economics: Confirms the classic pattern that the top 20% of customers generate ≈50% of revenue, motivating VIP/loyalty focus.
Churn risk & value at risk: Flags customers inactive for 60+ days and estimates the total revenue at risk, giving a target list for retention campaigns.
Forecasting: Produces a 90‑day revenue forecast with confidence bands to support inventory planning and marketing budgets.
All of these are backed by code in
analytics_pipeline.py and surfaced in ANALYTICS_REPORT.txt and the dashboard.📊 How to View the Dashboard
To view the dashboard, open
dashboard.html in your browser after cloning the repo.📬 Contact
Like this project
Posted Jan 18, 2026
Built an end-to-end analytics pipeline for e-commerce revenue and churn analysis.
Likes
0
Views
4
