AXiS — Operational Analytics and Business Intelligence (SaaS)
Milan Zaveri
Brand Background
The organization specializes in providing database management and advanced analytics solutions for enterprises. Their new SaaS product, "AXiS," aims to offer operational analytics and business intelligence tools that empower organizations' to derive actionable insights from their data in real time.
Objectives
The goal is to enhance the user experience of "AXiS" by making it intuitive, efficient, and aligned with the needs of the target audience — data analysts, business intelligence professionals, and decision-makers. This case study outlines the UX design process, challenges, solutions, and outcomes.
User Research
Target Users:
Primary: Data analysts, BI professionals, and IT managers.
Secondary: C-level executives looking for high-level insights.
Methods:
Surveys and Interviews: Conducted with existing customers and potential users to understand their pain points, needs, and workflow.
Contextual Inquiry: Observed users in their work environment to see how they interact with current tools and where friction points exist.
Key Insights:
Complex Data Navigation: Users struggle with navigating through large datasets and find it hard to locate specific data points quickly.
Real-Time Analysis: There’s a strong demand for real-time data analysis with minimal latency.
Customizable Dashboards: Users prefer highly customizable dashboards that can be tailored to specific business needs and KPIs.
Collaboration: Teams need to share insights easily with colleagues, necessitating features like shared dashboards and annotations.
Design
Archetypes: Based on the research, three archetypes were created:
Analyst Alex: A data analyst focused on extracting insights from large datasets. Needs efficient tools for querying and visualizing data.
Manager Maya: A BI manager overseeing multiple reports. Needs a dashboard that aggregates key metrics across departments.
Executive Eva: A C-level executive who requires high-level summaries and trend analysis to make strategic decisions.
User Journeys
Analyst Alex: From dataset import to creating detailed visualizations and sharing findings with the team.
Manager Maya: Monitoring the health of various departments through dashboards and setting alerts for key metrics.
Executive Eva: Receiving automated reports with summaries and trend analysis.
Wireframes and Prototyping
Low-Fidelity Wireframes: Created to outline the basic layout and navigation.
High-Fidelity Prototypes: Developed in collaboration with UI designers to include color schemes, typography, and interaction design.
User Testing: Conducted iterative testing with real users to refine the design. Key feedback was gathered on navigation, dashboard customization, and data visualization clarity.
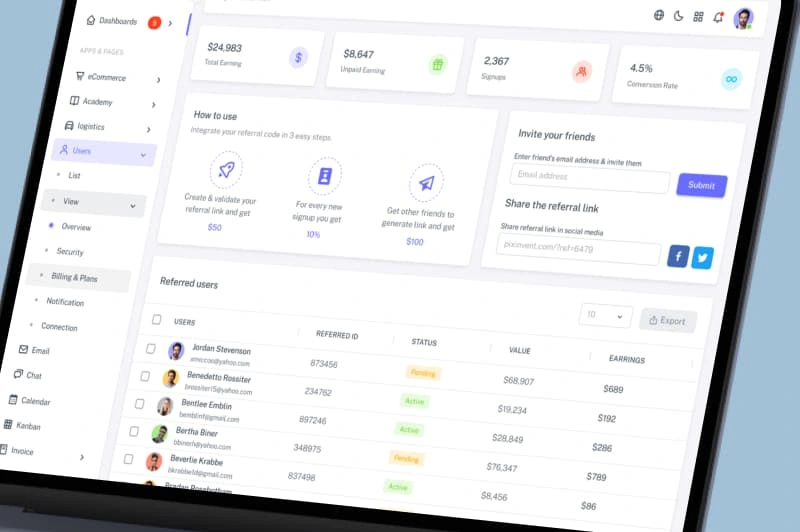
Collaboration Features
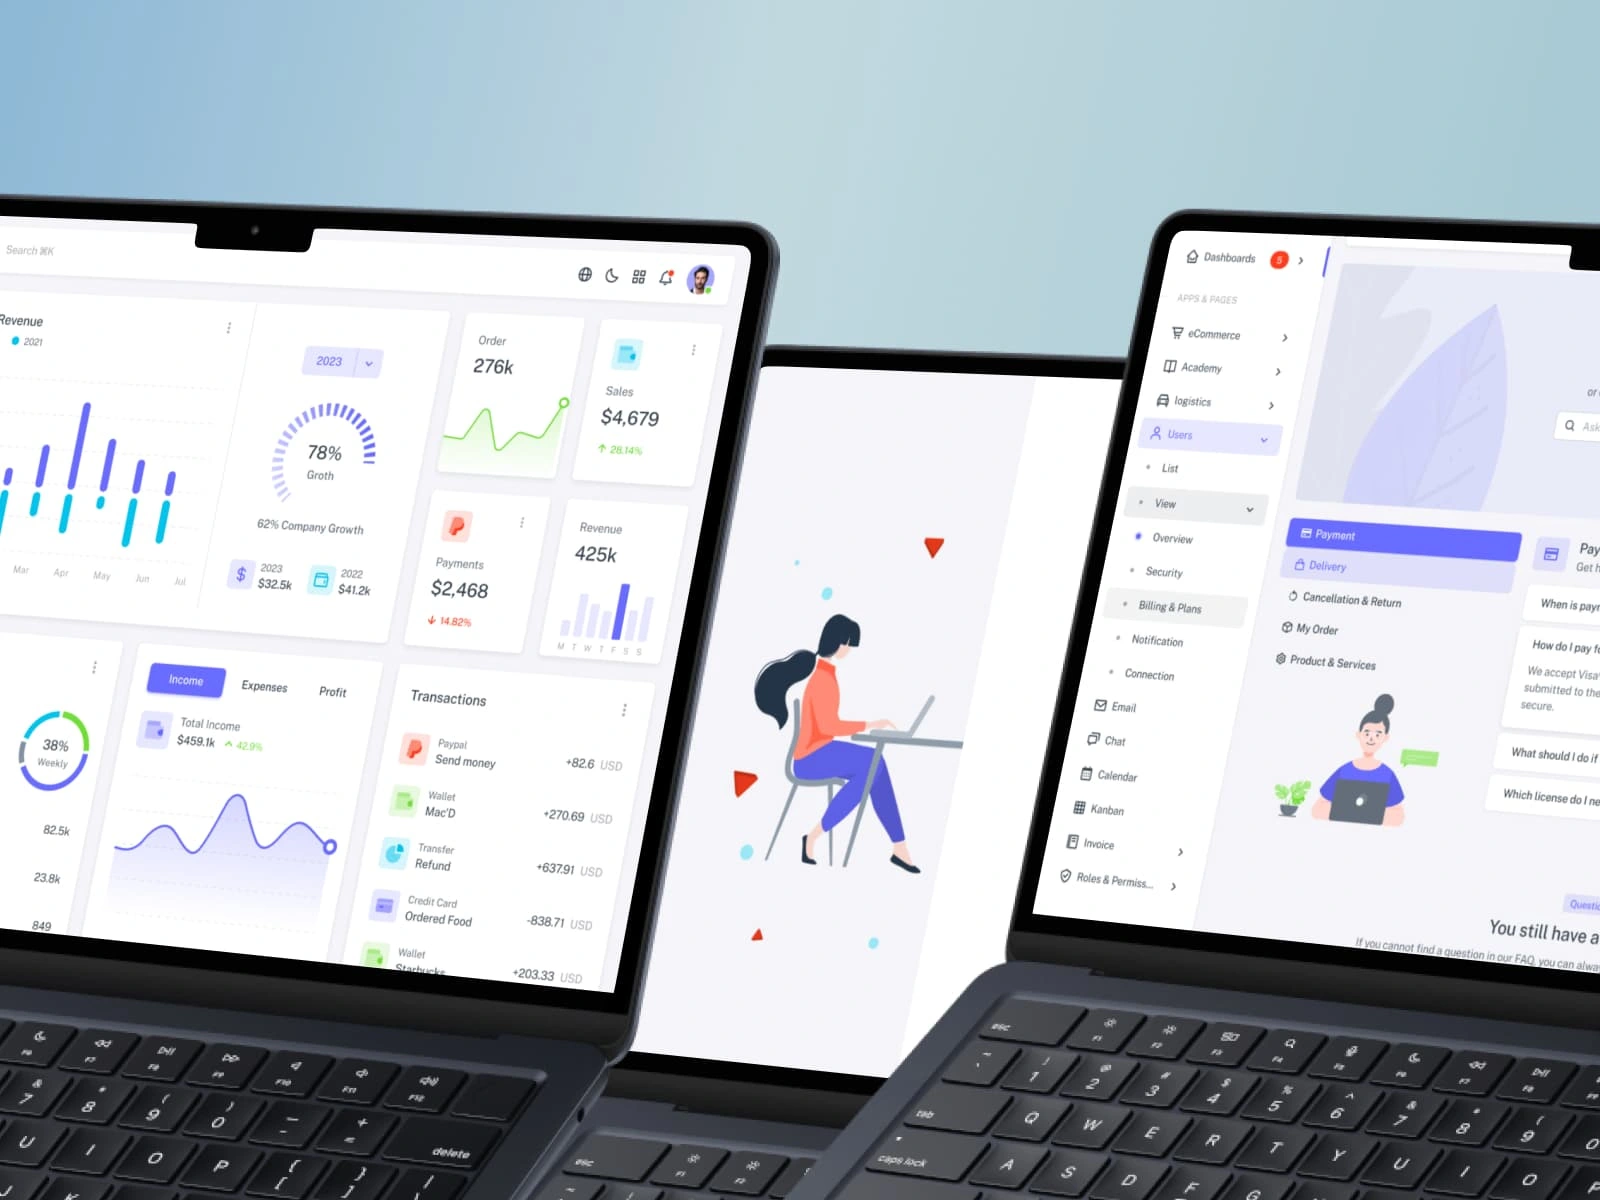
Final Design
Design Solutions
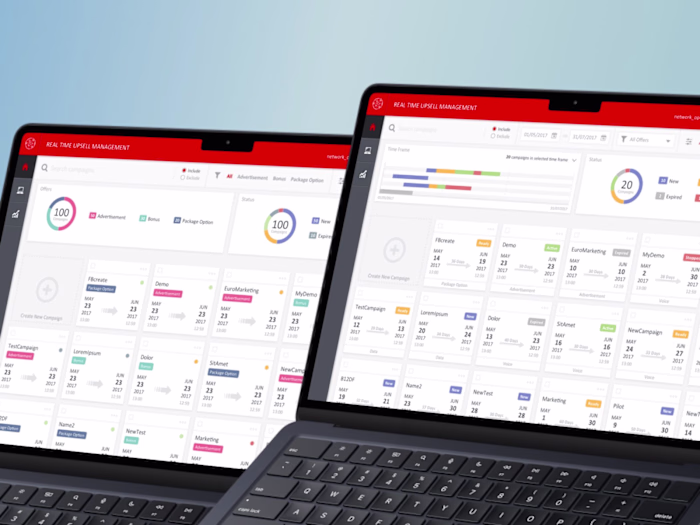
Simplified Navigation: Implemented a global search and filter system allowing users to find datasets and reports quickly.
Real-Time Data Stream: Integrated real-time data streaming capabilities, reducing latency and ensuring up-to-date insights.
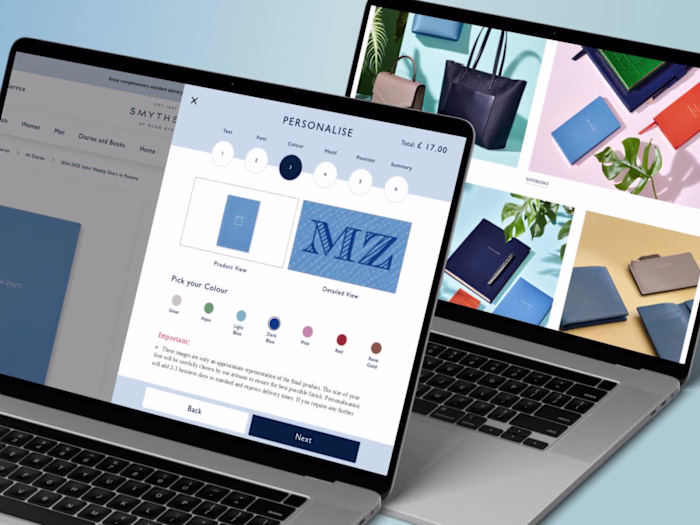
Customizable Dashboards: Provided drag-and-drop functionality for widgets, charts, and graphs, allowing users to build dashboards that meet their specific needs.
Collaboration Features: Enabled shared dashboards, real-time annotations, and comment threads within reports to facilitate team collaboration.
Development and Implementation
Agile Development
Sprint Planning: Prioritized user feedback and critical features, with each sprint focusing on enhancing the user experience.
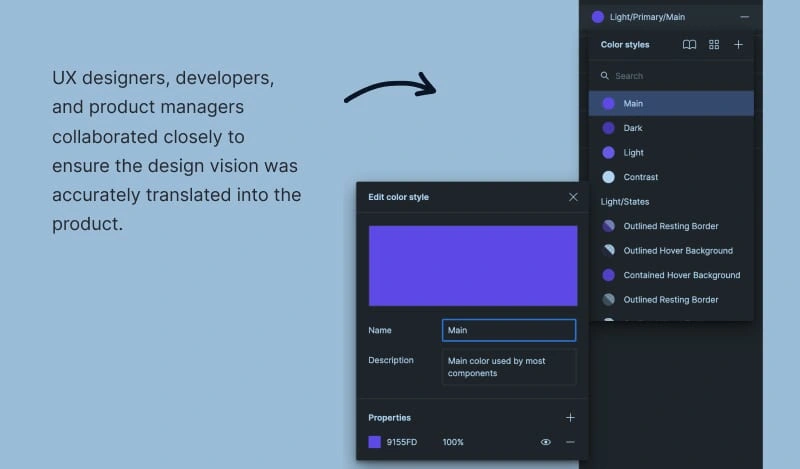
Cross-Functional Teams: UX designers, developers, and product managers collaborated closely to ensure the design vision was accurately translated into the product.
User Onboarding
Interactive Tutorials: Introduced a step-by-step onboarding process to familiarize new users with key features.
In-App Help: Provided tooltips, FAQs, and a dedicated support chat to assist users during their initial interactions.
Cross Functional Team Onboarding
Launch and Post-Launch
Beta Testing
Closed Beta: Released the product to a select group of users to gather final feedback and identify any critical issues.
Feedback Loop: Iterative updates were made based on beta users’ experiences, focusing on performance improvements and minor UX tweaks.
Launch
Marketing Campaign: Highlighted the ease of use, real-time analytics, and customization options as key selling points.
User Training: Conducted webinars and provided comprehensive documentation to help users get the most out of "InsightOps"
Post-Launch Monitoring
User Feedback: Continued to gather and analyse feedback through surveys, support tickets, and social media.
UX Metrics: Tracked user engagement, task completion rates and drop-off points to identify areas for further improvement.
Results
User Satisfaction
Increased Productivity: Users reported a 30% reduction in time spent on data analysis tasks due to streamlined workflows and real-time capabilities.
High Adoption Rate: Over 70% of existing customers adopted the new SaaS product within the first six months.
Positive Feedback: Users praised the customizable dashboards and collaboration features as game-changers for their teams.
Business Impact
Revenue Growth: The successful launch of "AXiS" contributed to a 25% increase in the company’s revenue.
Market Position: The organization solidified its position as a leader in the operational analytics and business intelligence space, gaining several new enterprise clients.
Conclusion
This case study demonstrates the critical role of user experience design in the success of a digital SaaS product. By understanding user needs, iterating on design, and focusing on usability, the organization was able to deliver a product that not only met but exceeded user expectations, driving both customer satisfaction and business growth.
Like this project
Posted Jan 26, 2025
This case study demonstrates the critical role of UX design in the success of a digital SaaS product that drives both customer satisfaction and business growth.
Likes
0
Views
6